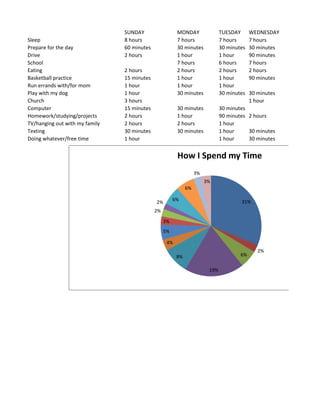
The document outlines how a student spends their time each day of the week. It shows that the majority of time is spent on school (31%), sleep (19%), eating (6%), and driving (6%). Other regular activities include preparing for the day, playing basketball, doing homework, hanging out with family, and having free time. The pie chart at the bottom summarizes the total hours spent on each activity over the course of a week.