Outsized Return

Alexander buys and sells US Equities and Listed Equity Options using a macro top down view to identify growth drivers and risk factors that cause significant price fluctuations over a 3 month to 3 year cycle. The strategy focuses on isolating risk factors and growth drivers to specific sectors, industries and/or macroeconomic trends. Our investment team then uses bottom up fundamental analysis to drive security selection. After security selection, a concentrated book is created of best ideas both long, short, or both. We manage risk by aligning the portfolio, macroeconomic themes, growth drivers, risk factors, security selection and positive expectancy to deliver asymmetrical outsized returns per unit of risk. The baseline for each investment is an asymmetrical return profile of $3 dollars of profit for each $1 dollar of potential loss.
Recommended

Recommended
More Related Content
What's hot
What's hot (20)
Similar to Outsized Return
Similar to Outsized Return (20)
Recently uploaded
Recently uploaded (20)
Outsized Return
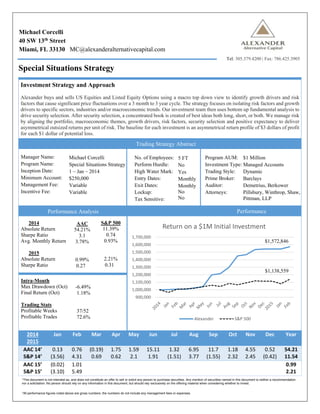
- 1. *This document is not intended as, and does not constitute an offer to sell or solicit any person to purchase securities. Any mention of securities named in this document is neither a recommendation nor a solicitation. No person should rely on any information in this document, but should rely exclusively on the offering material when considering whether to invest. *All performance figures noted above are gross numbers, the numbers do not include any management fees or expenses. Michael Corcelli 40 SW 13th Street Miami, FL 33130 MC@alexanderalternativecapital.com Special Situations Strategy Investment Strategy and Approach Alexander buys and sells US Equities and Listed Equity Options using a macro top down view to identify growth drivers and risk factors that cause significant price fluctuations over a 3 month to 3 year cycle. The strategy focuses on isolating risk factors and growth drivers to specific sectors, industries and/or macroeconomic trends. Our investment team then uses bottom up fundamental analysis to drive security selection. After security selection, a concentrated book is created of best ideas both long, short, or both. We manage risk by aligning the portfolio, macroeconomic themes, growth drivers, risk factors, security selection and positive expectancy to deliver asymmetrical outsized returns per unit of risk. The baseline for each investment is an asymmetrical return profile of $3 dollars of profit for each $1 dollar of potential loss. 2014 2015 Jan Feb Mar Apr May Jun Jul Aug Sep Oct Nov Dec Year AAC 14’ S&P 14’ 0.13 (3.56) 0.76 4.31 (0.19) 0.69 1.75 0.62 1.59 2.1 15.11 1.91 1.32 (1.51) 6.95 3.77 11.7 (1.55) 1.18 2.32 4.55 2.45 0.52 (0.42) 54.21 11.54 AAC 15’ S&P 15’ (0.02) (3.10) 1.01 5.49 0.99 2.21 Tel: 305.379.4200 | Fax: 786.425.3905 Trading Strategy Abstract Manager Name: Program Name: Inception Date: Minimum Account: Management Fee: Incentive Fee: Michael Corcelli Special Situations Strategy 1 – Jan – 2014 $250,000 Variable Variable No. of Employees: Perform Hurdle: High Water Mark: Entry Dates: Exit Dates: Lockup: Tax Sensitive: 5 FT No Yes Monthly Monthly No No Program AUM: Investment Type: Trading Style: Prime Broker: Auditor: Attorneys: $1 Million Managed Accounts Dynamic Barclays Demetrius, Berkower Pillsbury, Winthrop, Shaw, Pittman, LLP Performance Analysis Performance 2014 Absolute Return Sharpe Ratio Avg. Monthly Return 2015 Absolute Return Sharpe Ratio AAC 54.21% 3.1 3.78% 0.99% 0.27 S&P 500 11.39% 0.74 0.93% 2.21% 0.31 Intra-Month Max Drawdown (Oct) Final Return (Oct) Trading Stats Profitable Weeks Profitable Trades -6.49% 1.18% 37/52 72.6% 900,000 1,000,000 1,100,000 1,200,000 1,300,000 1,400,000 1,500,000 1,600,000 1,700,000 Return on a $1M Initial Investment Alexander S&P 500 $1,572,846 $1,138,559