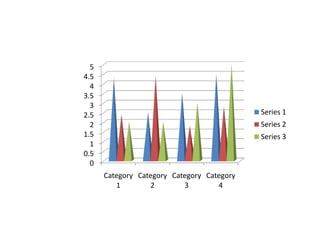
The document is a line graph showing 3 data series across 4 categories. Series 1 shows the highest values which decrease across the categories, Series 2 values are lower than Series 1 and also decrease across categories, and Series 3 has the lowest values that slightly increase from the first to last category.