1. Principal Investigator/Program Director (Last, first, middle): Wahlby, Carolina
Specific Aims
Microscopy has emerged as one of the most powerful and informative ways to analyze cell-based high-throughput
screening (HTS) samples in experiments designed to uncover novel drugs and drug targets. However, many dis-
eases and biological pathways can be better studied in whole animals–particularly diseases that involve organ
systems and multicellular interactions, such as metabolism and infection. The worm Caenorhabditis elegans
is a well-established and effective model organism that can be robotically prepared and imaged, but existing
image-analysis methods are insufficient for most assays.
We propose to develop algorithms for the analysis of high-throughput C. elegans images, validating them
in three specific experiments to identify chemicals to cure human infections and genetic regulators of host re-
sponse to pathogens and fat metabolism. Novel computational tools for automated image analysis of C. elegans
assays will make whole-animal screening possible for a variety of biological questions not approachable by cell-
based assays. Building on our expertise in developing image processing and machine learning algorithms for
high-throughput screening, and on our established collaborations with leaders in C. elegans research, we will:
Aim 1: Develop algorithms for C. elegans viability assays to identify modulators of pathogen infection
Challenge: To identify individual worms in thousands of two-dimensional brightfield images of worm pop-
ulations infected by Microsporidia, and measure viability based on worm body shape (live worms are curvy
whereas dead worms are straight).
Approach: We will develop algorithms that use a probabilistic shape model of C. elegans learned from
examples, enabling segmentation and body shape measurements even when worms touch or cross.
Impact: These algorithms will quantify a wide range of phenotypic descriptors detectable in individual
worms, including body morphology as well as subtle variations in reporter signal levels.
Aim 2: Develop algorithms for C. elegans lipid assays to identify genes that regulate fat metabolism
Challenge: To detect worms versus background, despite artifacts from sample preparation, and detect
subtle phenotypes of worm populations.
Approach: We will improve well edge detection, illumination correction, and detection of artifacts (e.g. bub-
bles and aggregates of bacteria) and enable image segmentation in highly variable image backgrounds using
level-set segmentation. We will also design feature descriptors that can capture worm population phenotypes.
Impact: These algorithms will provide detection for a variety of phenotypes in worm populations. They will
also improve data quality in other assays, such as those in Aims 1 and 3.
Aim 3: Develop algorithms for gene expression pattern assays to identify regulators of the response of
the C. elegans host to Staphylococcus aureus infection
Challenge: To map each worm to a reference and quantify changes in fluorescence localization patterns.
Approach: We will develop worm mapping algorithms and combine them with anatomical maps to extract
atlas-based measurements of staining patterns and localization. We will then use machine learning to distin-
guish morphological phenotypes of interest based on the extracted features.
Impact: These algorithms will enable addressing a variety of biological questions by measuring complex
morphologies within individual worms.
In addition to discovering novel anti-infectives and genes involved in metabolism and pathogen resistance,
this work will provide the C. elegans community with (a) a versatile, modular, open-source toolbox of algorithms
readily usable by biologists to quantify a wide range of important high-throughput whole-organism assays, (b)
a new framework for extracting morphological features from C. elegans populations for quantitative analysis of
this organism, and (c) the capability to discover disease-related pathways, chemical probes, and drug targets in
high-throughput screens relevant to a variety of diseases.
Primary collaborators
Gary Ruvkun and Fred Ausubel, MGH/Harvard Medical School: Development, execution, and follow-up of
large-scale C. elegans screens probing metabolism and infection. Polina Golland and Tammy Riklin-Raviv,
MIT Computer Science and Artificial Intelligence Lab: Illumination/bias correction, model-based segmentation,
and statistical image analysis. Anne Carpenter, Broad Imaging Platform: Software engineering and support.
Specific Aims Page 44
2. Principal Investigator/Program Director (Last, first, middle): Wahlby, Carolina
Research Strategy
A Significance
The NIH is committed to translating basic biomedical research into clinical practice and thereby impacting global
human health 1 , and Francis Collins identifies high-throughput technology as one of five areas of focus for the
NIH’s research agenda 2 . For many diseases, researchers have identified successful novel therapeutics or
research probes by applying technical advances in automation to high-throughput screening (HTS) using either
biochemical or cell-based assays 3–6 . Researchers are using genetic perturbations such as RNA interference or
gene overexpression in cell-based HTS assays to identify genetic regulators of disease processes as potential
drug targets 7–9 . However, the molecular mechanisms of many diseases that deeply impact human health
worldwide are not well-understood and thus cannot yet be reduced to biochemical or cell-based assays.
Ideally, researchers could approach disease from a phenotypic direction, in addition to the traditional molec-
ular approach, by searching for chemical or genetic regulators of disease processes in whole model organisms
rather than isolated cells or proteins. Moving HTS towards more intact, physiological systems also improves
the likelihood that the findings from such experiments accurately translate into the context of the human body
(e.g., in terms of toxicity and bioavailability), simplifying the path to clinical trials and reducing the failure of po-
tential therapeutics at later stages of testing. In fact, for some diseases, a whole organism screen may actually
be necessary to break new therapeutic ground; in the search for novel therapeutics for infectious agents, for
example, it is widely speculated that the traditional approach of screening for chemicals that directly kill bac-
teria in vitro has been largely exhausted 10 . Our work recently identified six novel classes of chemicals that
cure model organisms from infection by the important human pathogen E. faecalis through mechanisms distinct
from directly killing the bacterium itself 11 . Anti-infectives with new mechanisms of action are urgently needed to
combat widespread antibiotic resistance in pathogens.
Enabling HTS in whole organisms is therefore recognized as a high priority (NIH PAR-08-024) 12,13 . C.
elegans is a natural choice. Manually-analyzed RNAi and chemical screens are well-proven in this organism,
with dozens completed 14–16 . Many existing assays can be adapted to HTS; instrumentation exists to handle
and culture C. elegans in HTS-compatible multi-well. Its organ systems have high physiologic similarity and
genetic conservation with humans 17,18 . C. elegans is particularly suited to assays involving visual phenotypes:
physiologic abnormalities and fluorescent markers are easily observed because the worm is mostly transparent.
The worms follow a stereotypic development pattern that yields identically-appearing adults 19,20 , such that
deviations from wild-type are more readily apparent.
The bottleneck that remains for tackling important human health problems using C. elegans HTS is image
analysis (NIH PA-07-320) 21,22 . It has been recently stated, “Currently, one of the biggest technical limitations
for large-scale RNAi-based screens in C. elegans is the lack of efficient high-throughput methods to quantitate
lethality, growth rates, and other morphological phenotypes” 23 . Our proposal to develop image analysis
algorithms to identify regulators of infection and metabolism in high-throughput C. elegans assays
would bring image-based HTS to whole organisms, and have the following impact:
• Identifying novel modulators of infection by the NIH priority pathogen Microsporidia (Aim 1). Mi-
crosporidia are emerging human pathogens whose infection mechanisms are almost completely unknown.
Further, they inflict agricultural damage and are on the EPA list of waterborne microbial contaminants of
concern 24,25 . Identifying anti-microsporidian therapeutics is a special challenge because they are eukary-
otes. Moreover, they are obligate intracellular pathogens so they are not amenable to traditional antibiotic
screens; screening for drugs to kill them requires the presence of a validated, infectible host whose im-
mune system is homologous to mammals, such as C. elegans 26,27 . This screen could identify not only
useful chemical research probes and compounds that kill these pathogens outright, but also those that
block microbial virulence, are modified by the host for full efficacy (prodrugs), or enhance host immunity.
• Identifying novel regulators of fat metabolism (Aim 2). Disregulation of metabolism results in many
common and expensive chronic health conditions; diabetes alone affects 24 million Americans 28 . Energy
centers must receive and integrate nutritional information from multiple peripheral signals across multiple
tissues and cell types to elicit appropriate behavioral and metabolic responses; screening in a whole
organism is important. In particular, screening with a strain of C. elegans with an RNAi-sensitive nervous
system will likely reveal novel energy regulators of therapeutic and research value.
Research Strategy Page 45
3. Principal Investigator/Program Director (Last, first, middle): Wahlby, Carolina
• Identifying novel regulators of infection by the pathogen Staphylococcus aureus (Aim 3). S. aureus
is life-threatening for immune-compromised patients. Recently, antibiotic-resistant MRSA strains have
created an urgent need for therapeutics with a new mechanism of action 29 . We will identify genetic
regulators of the C. elegans host’s response to infection by S. aureus 30 . These will lead to potential drug
targets useful for boosting humans’ innate immunity.
• Enabling the automated analysis of a wide variety of C. elegans screens. Because C. elegans
has proven to be an excellent model for many human organs and processes, the impact of algorithms
for automated scoring for currently intractable C. elegans image-based screens on our understanding and
treatment of a variety of human diseases will be substantial. Adding novel C. elegans algorithms to existing
open-source software will create a flexible toolbox that can be applied to other types of assays (including
alternative formats such as microfluidics chambers; see Yanik support letter) with minimal modification:
Aim 1: The algorithms developed for Aim 1 will enable scoring viability and other body morphology assays
probing a number of biological processes. Our collaborators plan several RNAi and chemical screens
using live/dead assays to identify modulators of many other clinically relevant pathogens (see Ausubel
and Mylonakis support letters).
Aim 2: The algorithms developed for the fat metabolism assay can also be used to quantify the levels of
any stain within worms, to measure protein expression levels, the degree of staining by fluorescent dyes
or antibodies, and promoter activity in reporter assays probing a wide range of biological processes.
Aim 3: Where localization patterns are of interest, the algorithms developed for the gene expression
pattern assay will often be directly applicable, especially given the proposed machine learning capabilities.
Many benefits come from the automation of image analysis for such screens: (a) increased throughput so
as to enable genome-scale RNAi and large-scale chemical screens in whole animals; (b) quantitative re-
sults amenable to data mining 31–33 ; (c) increased objectivity and consistency; and (d) increased sensitivity
to subtle phenotypes, which often can not be scored reliably by eye. The requisite automation of sample
preparation and image acquisition has the welcome side effect of improving consistency and providing a
permanent record of the experiment.
• Creating open-source software for the C. elegans community. C. elegans is used for studying com-
plex multicellular biological processes by more than 11,000 researchers in 750 laboratories worldwide
(http://www.WormBase.org, January 2010), and the close-knit community rapidly shares methods 17,18,34,35 .
Based on our experience developing the CellProfiler software system (see Preliminary studies), packag-
ing automated image analysis algorithms in user-friendly software encourages their use by the broader
research community. Although we developed CellProfiler solely for high-throughput screening, 70% of
studies citing it actually used it to quantify low-throughput assays (fewer than 100 samples). In this pro-
posal we focus on developing algorithms that are robust and efficient for large-scale experiments, but we
anticipate they will become an everyday tool for many researchers in the C. elegans community, a good
investment since many of these are funded by the NIH.
Thus, in addition to the discovery of potential drugs and drug targets related to metabolism and infection,
which could significantly impact the global burden of human disease, our aims will yield open-source software
for automated, accurate, quantitative scoring for a wide range of C. elegans image-based assays that are
currently intractable. The impact will be multiplied by C. elegans laboratories worldwide using the resulting
software to study a wide variety of pathways relevant to basic biological research and human disease, in both
low-throughput and high-throughput experiments.
B Innovation
In response to the strong demand for C. elegans screening, we propose to build on our technological innovations
in sample preparation and imaging and our computational innovations for cells and brains to now create a novel
technology for C. elegans. Our proposed work to develop novel algorithms for identifying and characterizing
worms in microscopy images will bridge the final gap, for the first time enabling widespread identification of
genetic and chemical regulators of human biological processes and diseases via whole-organism screening.
Research Strategy Page 46
4. Principal Investigator/Program Director (Last, first, middle): Wahlby, Carolina
Assay development, high-throughput Assay improvement Algorithm Follow up on infection and Software engineering,
sample preparation and imaging and validation development metabolism regulators dissemination,
and tutorials
Aim 1: Microsporidia viability Wählby group
Ausubel Wählby group (Genovesio) Ausubel
assay: group group
(Madden) Golland group Carpenter group
single worm segmentation (Riklin-Raviv) Wählby group
Wählby group
Aim 2: Fat metabolism lipid Ruvkun Wählby group (Ljosa) Ruvkun
assay: worm population group (Madden) Golland group group
segmentation (Riklin-Raviv)
Wählby group
Aim 3: S. aureus infection Ausubel (Ljosa) Ausubel
Wählby group
gene expression assay: worm group Golland group group
(Madden)
mapping, machine learning (Riklin-Raviv)
Figure C.1: Project overview, including the contributions of collaborating groups.
Automated image analysis for high-throughput screening of C. elegans is, in itself, novel: screens have so
far been performed by eye due to the lack of suitable image analysis algorithms (excepting our simple E. faecalis
screen 11 ), limiting the number, types, and sizes of screens. Visual examination for a genome-wide RNAi screen
takes 0.5–4 people-years; a large chemical screen 1 requires more than 10 people-years. Using the algorithms
we will develop, such screens can be analyzed in weeks or months. Existing algorithms for C. elegans are
insufficient; they were developed for low-throughput, high-resolution, 3-D, or time-lapse images 36–46 , or for
embryos, which have a different appearance than adults 47–53 .
Several algorithmic innovations are necessary in order to quantify a variety of C. elegans phenotypes and
attain the robustness required for routine high-throughput screening. We propose a novel, simplified represen-
tation for worm shapes that lends itself to a probabilistic interpretation. This allows us to adapt shape models
to identification of worms in a high-throughput context, and leads to a novel algorithm for detangling worms by
morphology-guided graph search. We will also build upon methods from our work in deformation analysis 54
and per-cell classification of cellular phenotypes by machine learning 55 to quantify phenotypic variation and
fluorescence localization in individual worms.
C Approach
Overview of the team and the approach
The proposed project is founded on several multi-year existing collaborations between groups studying infection
and metabolism using C. elegans (Ausubel and Ruvkun), and computational groups focused on developing
algorithms for biomedical research (Wahlby, Carpenter, and Golland), making us uniquely situated to accomplish
the proposed aims. As shown in Figure C.1, our interdisciplinary team is highly interactive and our approach
to image assay development is a highly iterative process; typically the majority of the work is in multiple rounds
of validation and testing of novel or existing algorithms while optimizing sample preparation protocols to ensure
robust real-world performance. Each proposed aim is independent, but in several instances, improvements
made for one aim will benefit the others. Later sections detail our proposed algorithm development for each aim,
which will occur in the rich, collaborative, interdisciplinary environment of algorithm and software development
at the Broad Institute and MIT. Here we outline the team and the approach.
Project leadership and algorithm development: The PI, Carolina Wahlby, will lead and coordinate the
collaborating groups for the project. Based on Dr. Carpenter’s work with Golland’s group across the street
at MIT’s CSAIL (since 2004 55–59 ) and the Ausubel and Ruvkun C. elegans laboratories across the Longfellow
Bridge at MGH (since 2005 11,60 ), Dr. Wahlby was able to quickly take leadership of these projects in 2009,
start her own collaborations, and develop new ideas for C. elegans image analysis with the Golland group (see
support letter). In less than one year, this collaboration resulted in a joint, peer-reviewed paper accepted for
publication 61 , another submitted, and the present proposal. The project’s success so far is due to Dr. Wahlby’s
strong computational background and previous experience managing highly interdisciplinary collaborations on
¨
application-oriented image analysis (see Bengtsson and Ekstrom/Alderborn support letters).
Wet laboratory work: The Ausubel and Ruvkun groups are separately funded, equipped, and committed to
completing the wet laboratory work to image thousands of samples for each assay (see Table C.1, Preliminary
studies section, Resources file, and support letters). Furthermore, the laboratories are dedicated to the study
of infection and metabolism and are separately funded to follow up on “hits” from the screens, in some cases
Research Strategy Page 47
5. Principal Investigator/Program Director (Last, first, middle): Wahlby, Carolina
Table C.1: Overview of image sets to be collected by Ausubel and Ruvkun groups.
Aim Assay Group Images Scale
1 Viability assay Ausubel & Brightfield only (shape reveals viability of worms in 5000–100,000
(Microsporidia)c Ruvkun response to infection) chemicals
2 Lipid assayb Ruvkun Brightfield of oil red O (stains lipids) Genome-wide RNAi
3 S. aureus-induced Ausubel Brightfield + GFP-fluorescence (reports expression of Genome-wide RNAi
expression patternc clec-60:GFP in response to infection) + myo-2:mCherry
Screens funded by: a NIH R01 AI085581-01 b NIH R01 DK070147-06 & Broad Institute c NIH R01 AI064332-05 & R01 AI072508-02.
collaborating with the Broad Institute’s Chemical Biology Platform, which has extensive experience in converting
hit compounds into usable research probes or drugs.
Software development, dissemination, resource sharing, and reproducible research: The Carpenter
group (see support letter) will implement, test, and disseminate the project team’s algorithms into readily usable
software following good software engineering practices. In keeping with the Broad Institute’s mission to create
advanced research tools for the scientific community, the Data/Software Sharing file details our plans for com-
prehensive sharing of both the data (images) and software produced. Specifically, the algorithms developed will
be made readily usable by biologists via the open-source CellProfiler software project for high-throughput image
analysis 57 . A major advantage of this system is that each analysis run retains complete information about the
algorithms and settings used, enabling reproducible research 62 . CellProfiler runs on Windows, PC, and Unix
systems, including computing clusters, and reads many image file formats via the BioFormats library 63 . The
C. elegans algorithms will also be available via ImageJ 64 , due to a funded project to interface it with CellProfiler
(Carpenter, Eliceiri, and Rasband). Building on this existing software eliminates the waste of building a separate
interface for worm algorithms and ensures longevity and dissemination for the algorithms.
In addition to software engineering for the project, the Carpenter group will also be primarily responsible for
software dissemination and support through direct training with other high-throughput C. elegans laboratories
(see Roy, Mylonakis, and Yanik support letters, for example), via conferences (e.g., The International C. elegans
Meeting, Worm Genomics and Systems Biology Conference), via the Worm Breeder’s Gazette 35 , via online
tutorials, and via public C. elegans-specific tutorials to train biologists to use the software.
Timeline: Work on Aim 1 will take place during the first two years. Work on Aim 2 will commence six
months after funding and will be finished by the end of the third year. Work on Aim 3 will begin halfway through
the second year and will be finished by the end of year 5.
Preliminary studies supporting the approach
In this section, we describe the independent and collaborative research completed within and among the
Wahlby, Carpenter, Golland, Ausubel, and Ruvkun groups that provides the foundation for this proposal.
High-throughput C. elegans microscopy screen for regulators of Enterococcus faecalis infection:
We recently published the first whole-animal C. elegans microscopy screen analyzed by automated image
analysis 11 . Building on a smaller, manually-scored screen 65 , we tested 37,214 chemicals for their ability to
rescue C. elegans worms from an otherwise lethal E. faecalis infection. We acquired fluorescence images of the
dead worms stained with SYTOX dye, plus brightfield images showing the entire worm population. Although the
image-analysis approach was relatively simple, the screen uncovered six structural classes of compounds that
are “anti-infectives” and appear to cure C. elegans animals without directly affecting the growth of E. faecalis.
Three of these are novel structural classes of compounds that were not found in in vitro screens for antimicrobial
compounds. This validates a major premise of our proposal, that image-based screens in the whole organism
C. elegans will reveal compounds acting through novel mechanisms of action, in this case, mechanisms that
are only manifest when the complex host/pathogen relationship is intact.
High-throughput C. elegans sample preparation, image acquisition, and assay development: The Ru-
vkun and Ausubel labs, with help from the Carpenter group, have established the pioneering C. elegans High-
Throughput Screening Core Facility 66 . Both groups have extensive experience in developing assays and con-
ducting large-scale screens to probe important biological questions in C. elegans, having completed manually-
scored C. elegans screens relating to longevity 67–69 , E. faecalis infection 65,70 , metabolism 71,72 , RNA inter-
Research Strategy Page 48
6. Principal Investigator/Program Director (Last, first, middle): Wahlby, Carolina
ference 73 , Candida albicans infection 74 , synapses 75 , immune response 76 , molting 77 , miRNA 78 , diabetes 79 ,
innate immune signaling 80 , neuroendocrinology 81 . The specific assays they developed for this proposal are
described later, in the context of each Aim.
The screening center uses a workflow in which a precise number of worms within a specified size/age range
are dispensed by a COPAS large particle sorter into 4–6 multi-well plates per hour, and subsequently processed
using automated plate washers and microscopes. The workflows enable both RNAi and chemical screening
and imaging at multiple wavelengths. The team is skilled at optimizing assay parameters such as genetic
background, readout, food source, salt concentration, temperature, timing, number of replicates, and number
of animals per well. Imaging is optimized by transfer from agar to liquid media to minimize imaging artifacts
and a paralytic drug is often added to slow worm movement, minimizing misalignment between subsequently
imaged channels. Microscopy imaging is the primary screening method: plate readers do not offer per-worm or
morphological readouts and are often not compatible even with bulk fluorescence-level assays 66 ; customized
flow cytometers can measure certain phenotypes 82,83 , but current equipment to retrieve worms from a 96-well
plate is too slow and inconsistent.
Both laboratories lead their fields and have productive records of pursuing hits from C. elegans screens. The
Ausubel laboratory’s reputation stems from pioneering discoveries that many human microbial pathogens also
kill C. elegans 84–89 , typically using similar virulence factors 84,86–92 , and that key features are shared between
C. elegans’ immune system and the innate immune systems of mammals 80,93–97 . The Ruvkun lab is well-
respected for work using C. elegans molecular genetics and genomics, leading to the discovery of microRNAs 98 ,
the first detection of microRNAs in other animals 99 , and the discovery of their role in gene regulation. Most
relevant to the proposed project is the discovery of key members of the insulin pathway that control metabolism
and longevity 100 , that were later found to be conserved in mammals.
Development of image analysis and machine learning algorithms for biomedicine: The Wahlby,
Carpenter, and Golland groups each have substantial experience developing and applying image analysis al-
gorithms to important problems in cell biology and biomedical imaging. Our expertise spans the full spectrum
required for the proposed project: developing advanced image analysis algorithms, validating them in the con-
text of real-world biological problems, and creating practical, useful software tools that are made publicly and
freely available.
Dr. Wahlby was one of the pioneers in developing advanced segmentation methods for phenotype quan-
tification in fluorescence microscopy images of cells 101 , using nuclear stains for seeded segmentation of cyto-
plasms 102 , a widely used approach today. Our algorithms for accurate delineation of individual cells in culture
and tissue 103 have proven valuable in a number of our own image-based biological experiments 104–108 . The
algorithms have become widely used via a software tool 109 that also incorporates our novel algorithms for sig-
nal detection 110 . The algorithms are also a key component of CellProfiler 57 as a result of our collaboration
with the Carpenter group in 2003. We have also developed a new apprach for quantification of signal colo-
calization 111,112 and designed methods for quantitative measurements using novel staining techniques 113,114 .
Our recent work on C. elegans with this proposal’s collaborators produced a novel method for segmentation of
clusters of worms using a probabilistic shape model 61 .
The Carpenter and Golland groups began collaborating in 2004 to expand the range of cell types and
phenotypes amenable to automated analysis for high-throughput screening. This produced algorithms for the
accurate identification of cell edges based on Voronoi diagrams in an image-based metric space 56 , an approach
for illumination correction for fluorescence microscopy images 58,115,116 , a combination of existing algorithms,
including Wahlby’s, for the accurate identification of difficult-to-segment nuclei 57 , a workflow for handling the
unprecedented hundreds of numerical measurements for each of millions of cells in dozens of experiments 58 ,
and a software infrastructure in which to incorporate these algorithms and approaches (detailed below). The
software, CellProfiler, and some of its algorithms will be useful for the C. elegans work proposed here. Most
importantly, these algorithms have been cited in hundreds of papers in the past three years, demonstrating that
they serve an unmet need in biomedical research. We directly collaborated in many important studies in a wide
variety of biological fields of study 55,57,59,117–126 .
Machine learning has become increasingly useful in our work on scoring phenotypes in image-based screens
in cases when a complex combination of features is required to differentiate between classes. We adapted the
principles of content-based image retrieval 127 and created a system for scoring complex phenotypes in high-
Research Strategy Page 49
7. Principal Investigator/Program Director (Last, first, middle): Wahlby, Carolina
throughput image-based screens using iterative feedback and machine learning 55 . We have used this software
for large-scale screens for dozens of phenotypes that could not be scored by traditional methods 55,128 , many of
which are likely to be published in the next 1–2 years. Typically, no customization is required to accurately score
phenotypes, aside from initial segmentation and feature extraction, overcoming a significant bottleneck in assay
development for screens. The approach and software should be equally successful for C. elegans screens,
once accurate measurements can be obtained from individual worms.
Aside from this collaborative work, the Golland group has established computational frameworks for image-
based statistical analysis of shapes as well as shape-based segmentation. Their shape analysis research 129–133
explores the morphological variability of brain structures across and within different populations, which led
to the development of a discriminative shape model 54 . The underlying mathematical frameworks are either
level-set or MRF models—both are state-of-the-art techniques for segmentation. While the analysis and ex-
traction of brain structures has been the main focus of the group’s research 134 , the segmentation of natural
images with various forms of priors such as shape symmetry, GMM models and user interaction have also
been explored 135–141 . These two complementary lines of research cover most aspects of the problems at
hand—foreground/background segmentation, delineation of individual worms based on shape, and extraction
of numerical measurements that are specific to worm phenotypes.
Modular open-source software for image analysis: Together, the Wahlby, Carpenter, and Golland groups
have a track record of producing user-friendly software that is valued by the scientific community and capa-
ble of generating useful biological discoveries. The Carpenter, Golland, and Sabatini groups launched the
open-source CellProfiler software project to give biologists a user-friendly interface to mix and match advanced
image analysis algorithms (including our own, described above) in a modular way for high-throughput exper-
iments 56–58,115,125,142–144 . We also created companion software, CellProfiler Analyst, for the exploration and
analysis of multi-dimensional, image-based screening data which could not be handled by existing software,
commercial or open-source 125 . These tools will be directly applicable to C. elegans-derived data.
CellProfiler has been useful to the biological community by many measures: (a) It has been cited more
than 150 times in the 3 years since publication, including high-profile studies unaffiliated with our groups, 145–155
(b) The CellProfiler software is downloaded at a rate of 360/month, (c) There was widespread support from
screening centers and laboratories around the world for our recent NIH R01 proposal to support CellProfiler.
Aim 1: Algorithms for C. elegans viability assays to identify modulators of pathogen infection
To score chemical perturbants for their ability to rescue C. elegans from an otherwise lethal infection by the
pathogen Microsporidia, we will develop algorithms to count live and dead worms in each sample. These
algorithms will delineate individual worms from clusters of worms and extract shape features that can distinguish
curvy, live worms from straight, dead worms.
The successful C. elegans viability screen described in Preliminary studies 11 relied on measuring a fluores-
cent viability stain (SYTOX) across the population without needing to identify individual worms. However, for this
Microsporidia assay, and other future live/dead screens, it is preferable to instead classify each animal as live
or dead based on its shape in brightfield images; SYTOX staining adds reagent costs and sample preparation
time and it is a less reliable indicator of viability from a biological perspective 66 . In addition, SYTOX stains some
pathogens we plan to screen as well as some types of debris, thus obscuring the signal from the worms.
Experimental approach
While non-touching worms can usually be delineated in brightfield images based on the differences in intensi-
ties between foreground and background, image intensity alone is not sufficient for touching and overlapping
worms. The high-throughput screening assays addressed here require algorithms that separate touching and
overlapping worms in static images, where motion cues are unavailable. Moreover, edges and intensity vari-
ations within the worms often mislead conventional segmentation algorithms. On the other hand, while the
varying postures of the worms introduce significant extrinsic geometrical differences, the worms have similar
intrinsic geometrical properties (such as length and width profile). We propose a probabilistic shape model that
captures this type of knowledge in an automated segmentation method. The key ideas are the construction
of a low-dimensional shape-descriptor space and the definition of a probability measure on it. Closely related
approaches for shape representation include the active shape model (ASM) and its variants 156 , and medial
Research Strategy Page 50
8. Principal Investigator/Program Director (Last, first, middle): Wahlby, Carolina
A F G
y‐position after alignment
worm diameter (pixels)
B
C
D
D x‐position after alignment control point
H
E
E
Figure C.2: Constructing a worm model. A: Rotated input image. B: Initial segmentation. C: Skeleton. D: Pruned skeleton
with local radii at control points. E: Parameterized shape, recreated from descriptor. F: Connected control points of N=454
training worms after mirroring, alignment by translation, and rotation. G: Variation in radius along the length of all N worms.
H: The effect of varying the weights of the “eigenworms” corresponding to the seven largest eigenvalues of the final model.
Any 3-D properties of the worms will be captured as projections in our 2-D images. In fact, the sixth “eigenworm” appears
to capture the C. elegans lifting its head.
axis transform methods 157 for capturing shape variability in anatomical structures and other objects 158,159 and
others. We learn the possible shape variations from N training worms obtained by automated segmentation of
a subset of worms that do not touch or overlap.
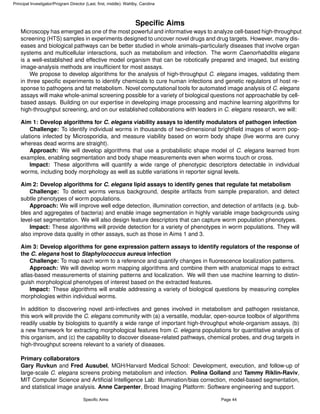
1. Construct a low-dimensional worm shape descriptor from the skeleton of the shape and its distances
to the boundaries, given by the medial-axis transform 160 . Fig. C.2 exemplifies our proposed computationally
efficient representation of the shape, where we extract the skeleton of each worm (Fig. C.2C), and prune spurs
by iteratively removing the shortest spur of every branch point of the skeleton. Once a non-branched skeleton
is obtained, we find end points, and sample n control points uniformly along the skeleton. The original worm
shape can be approximately restored by placing discs with radius equal to the local worm width (Fig. C.2D) at
each control point, and smoothing the edges by the pair-wise convex hull of the discs (Fig. C.2E).
2. Reduce dimensionality by Principal Component Analysis (PCA): Align descriptors by similarity trans-
formation (i.e., rotation and translation, no scale or skew) by minimizing the sum of the Euclidean distances of
corresponding points along the skeletons. Thus, non-rigid components of the deformations are completely cap-
tured within the shape variations. To make variations in worm shape symmetrical, the training set is doubled to
2N by mirroring all samples. Fig. C.2F shows the aligned skeletons of the training set. The significant similarity
of the worms’ radii profiles (Fig. C.2G) allows representation of the differences in the radii by a single value,
which corresponds to the median thickness of the worm. The deformations of the postures are described by
the coordinates of the n aligned control points and the variation in thickness, resulting in a (2n + 1) dimensional
data space. We project the vector representations of the parameterized skeletons into a lower-dimensional
feature space by PCA 161 . All the worms in the training set can be restored with good approximation by linear
combinations of the eigenvectors, or “eigenworms” (Fig. C.2H).
3. Find posture probabilities and resolve clusters by graph search algorithm: The weights w of
the training worms define a probability measure on the feature space of the worm deformations: p(x) ∝
exp(−wT Σ−1 w), where ΣL = diag(λ1 ... λL ) as in 162 . After the input images have been partitioned into worm
L
regions (individuals and clusters) and background (Fig. C.3B) as discussed later, we find the skeleton of each
clusters using the medial-axis transform 160 (Fig. C.3C). We represent the skeleton by a sparse direct graph
Gs = {V , E}. The vertices V of the graph represent the skeleton segments (Fig. C.3C)) and the edges E con-
nect pairs of vertices representing pairs of skeleton segments with common intersection points. We represent a
worm candidate by a path p1 ... pN in the graph containing one or more vertices. Set K to the estimated number
of worms in a cluster (given by cluster area) and Let p1 ... pN denote the paths in the graph. We find K out of N
paths in the graph by minimizing the cost functional
K K k−1
E(p1 ... pK ) = − log P(pk ) + α ˜
|pk ∩ pl | + β|Vk |,
k=1 k=2 l=1
Research Strategy Page 51
9. Principal Investigator/Program Director (Last, first, middle): Wahlby, Carolina
A B
v
v vv
v
v v
C D
Figure C.3: Resolving clusters. A: Input image, B: Figure C.4: Three examples of resolved clusters (bottom) shown
binary image of cluster, and C: its pruned skeleton: together with original images (top). Worms close to the well edge
vs indicate vertices; os indicate groups of edges. D: were excluded from this analysis.
Final segmentation result.
where | · | denote cardinality or size. The first term is a requirement that the selected set of paths will have the
highest probability to represent true worm shapes. The second term is a requirement that the sum of pairwise
overlaps between the selected paths will be minimal. The third term is the number of vertices that are not
included in the union of the selected paths, constraining the paths to cover the worm-cluster skeleton, and α
and β are scaling factors. A global minimum can by obtained by an exhaustive search for all the subsets of K
N
out of N paths in Gs . This is however a combinatorial problem of order K . To reduce the computational time
we apply a greedy 163 strategy where at each stage we make a locally optimized choice of a path in the graph,
until we select K paths. We applied the proposed segmentation approach to images containing worm clusters
that could not be resolved based on gray-scale information alone. Most of the worms were correctly segmented
as verified by visual evaluation (Fig. C.3D and C.4).
4. Measure worm viability by scoring the live/dead phenotype as the worm’s length along the medial axis
divided by the straight distance between worm’s end points 37,164 . Initial studies also indicate that the shape
characteristics described by the eigenworms provide a good measure of viability.
Validation, evaluation, and benchmarks
To validate and evaluate the proposed algorithm we will use a set of 6000 expert-annotated brightfield images
from a previous screen 11 in addition to images from the Microsporidia screen itself. Overall, our goal is to
achieve “screenability” in terms of both accuracy and computational speed. Accuracy: We will use metrics
accepted in the screening field to assess accuracy based on the ability to distinguish control wells with worm
populations of known phenotype—hundreds of these controls are included in each experiment. If the assay
readout is Gaussian, we will aim for a Z’-factor 165 above 0.5 (>0.2 would still be acceptable); if not, we will use
classification sensitivity and specificity, overall aiming to avoid visual examination for 90–95% of the samples.
During the iterative process of algorithm and assay development, we will also validate individual steps of the
image analysis pipeline (foreground/background segmentation, worm cluster resolution, live/dead scoring) as
appropriate, comparing algorithm results to “ground truth” provided by our worm experts. Speed: Image pro-
cessing should keep pace with image acquisition; given current image acquisition rates and cluster computing
costs, our goal is 6 CPU-minutes or less per image on a typical CPU. The methods proposed are likely to meet
this goal, but there are many ways to reduce computational costs if needed.
Potential problems and alternative strategies
Initial foreground/background segmentation is a prerequisite for the proposed cluster separation. If
local adaptive thresholding is not sufficient, we will rely on more advanced methods, such as level-sets for
foreground/background separation (Aim 2).
Cluster skeletonization may not coincide with the centers of the worms, skewing the cluster separation.
Research Strategy Page 52
10. Principallnvestigator/Program Director (Last, first, middle): Wahlby, Carolina
A B
Figure C.S: A: Input image with well edges and bubbles of size and color simi/ar to the worms. B: The well edges masked
away by convex hull. C: Gradient magnitude defines bubble edges. 0 : Inverted image after removal of artifacts. E: Outline
of worms (green) after background illumination correction.
Over-segmenting the clusters using watersheds 166 will, apart from dividing the worms into many pieces, also
place watersheds at bright ridges between worms. Merging will not entangle crossing worms, but a selective
merging that keeps watershed boundaries placed at bright ridges (based on local intensity information , similar
to our previous work 103, but allowing also incomplete watersheds) , will lead to a binary image where bright
ridges are marked as background. A skeleton of such an image is more likely to guide the probabilistic shape
model to a correct segmentation result. A distance transform of the binary image can guide the merging step,
forcing it to preserve ridges located at a worm's thickness from the cluster edge.
Scoring viability from clusters: If individual worms cannot be segmented, we will measure the proportion
of cluster area occupied by straight worm segments by a simple algorithm that fits long line segments inside
the cluster. The algorithm considers all pairs of pixels in a connected region, and if a line > 75% of the typical
worm length can connect the pair while remaining in the worm region, the pixels along the line are marked as
belonging to a dead worm.
Aim 2: Algorithms for C. e/egans lipid assays to identify genes that regulate fat metabolism
To identify regulators of fat metabolism, we will extract lipid-related phenotypic features from populations of
worms. This requires robust foreground/background separation, artifact removal, and definition of biologically
relevant feature descriptors. Improvements in the first two of these goals will be applicable to a variety of assays,
including those described in Aims 1 and 3.
The Ruvkun group completed a genome-wide C. elegans RNAi screen for genes regulating lysosomal con
tent using the fluorescent dye llile Red 6o ,71, revealing a wide range of functional components of the mammalian
cellular wasting cycle, due to the conservation between C. elegans and mammals in these pathways. Although
it was the first screen to probe these pathways in an intact, living animal, the scoring was manual and non
quantitative. The group recently discovered that the stain oil red 0, unlike Nile Red, labels the major fat storage
compartment 60 . We expect to uncover novel regulators of energy metabolism using this true fat stain. We
will carry out the screen using a C. e/egans strain hypersensitive to RNAi. We will also perform the screen in
C. e/egans strains with perturbations in metabolic/longevity pathways; in the insulin-signaling deficient mutant
daf-2 and the calorically restricted mutant eat-2. We have already acquired images from > 4,000 samples (in
duplicate) after many months of iterative improvements in sample preparation and image acquisition.
Experimental approach
As compared to Aim 1's viability assay, which requires identification of individual worms to measure shape,
the lipid assay can be scored by averaged measurements from non-separated worms. The challenges include
robust separation of image foreground (worms) from background, elimination of well edges and artifacts, and
identification of descriptive features that reflect the fatness phenotype of each worm population correctly. We
have discovered that identifying the foreground in brightfield images of C. e/egans requires a more accurate
intensity threshold than is the case for most fluorescently labeled cell-based assays. In some cases, local
adaptive thresholding 167 is sufficient, but for more difficult cases we propose to define foreground/background
using level-set segmentation that combines image intensity with gradient information. The accidental inclusion
of non-worm material in the segmentation result may skew extracted feature measures leading to poor accuracy.
Research Strategy Page 53
11. Principallnvesligalor/Program Direclor (Lasl, first , middle): Wahlby , Carolina
o u O'
.~ O.S
Per image measurements ... fat 2E10
' ... fat daf·2
1li 059
..... + vvt
l:
.~ 0. 58 o lean 189
..c
.......... 0 .57
c
o
'';::;: 056
Q.
'
o
Vl
0.55
..0
fO 0 .54 o
"0 o
ii!. °sa.6S~----='. 7 - - -0 .7=-2-----co.7 4 '---: 7S
O = =-= :-=" O~.:----= 79:-----: .9
0""' 0""=" -=-'0
92
Blue absorption/worm are-!
Figure C_ Quantification of oil red 0 accumulation (an indicator of fat accumulation) for worms fed with different bacterial
6:
RNAi clones. Each point in the plot represents a worm population in a well.
Due to the specifics of sample preparation, this assay produces many artifacts that are not seen in Aim 1 's assay,
such as bubbles. We propose to eliminate artifacts based on gradient magnitude and color.
1. Correct for background illumination variations using existing methods based on iteratively fitting a
surface (8-spline) to the image background 168. Illumination correction of color images is often performed on
the L-component in L*a*b color space;167 here we propose to apply the correction on each of the RG8-color
channels separately, giving the combined effect of illumination and color correction in a single step.
2. Segment foreground/background by level-set methods that rely on low level image data (intensity and
gradients). We use the level-set formulation 169 for a parameterization-free representation of the evolving worms
contours. We define segmentation by assigning the positive and the negative levels of the level-set function to
the object foreground and background respectively, representing the object boundary by the intersection of the
level-set function with the zero plane. The functional consists of a region-based term that encourages homo
geneity of image intensity in semantically related regions 170,171 , an edge-based term that rewards coincidence
of the object boundary with the image edges 172,173, and an edge alignment constraint that encourages evolution
of the object boundary in a direction normal to the image edges 174,175. We use the first variation of the level-set
functional to define the gradient-descent equations that control the evolution of the object contour.
3. Identify and eliminate image artifacts starting with the well edge, which can often be found by simple
intensity thresholding. However, using a binary thresholding result as a mask often leads to the loss of dark
objects close to the well edge. We therefore refine the thresholding result by defining the convex hull 167 of
the binary mask, leading to a simple and robust well segmentation (Fig. C.58). We filter out bubbles based
on their gradient magnitude being greater than that of the worm edges (see Fig. C.5A vs D). Finally, we filter
out other artifacts such as bacterial aggregates and dust based on color, texture, and median of a distance
transformation 167 , which provides a valuable metric to discriminate between worm clusters and artifacts based
on thickness.
4. Extract fat-related features from populations of worms such as averages of intensity, texture and color
(defined by individual color channels and their ratios). We will also extract normalized granularity features 176
to quantify the texture of the oil red 0 stain, and measure worm width without extracting individual worms by
distance transformation of the binary image foreground. The distribution of values within the resulting distance
map provides a measure of width , discriminating between populations of thick versus thin worms.
5. Select descriptive features by machine learning applied to a large number of features extracted from
set of control images with known phenotypes , prepared in parallel with the screen images (see Aim 3, although
there in the context of per-worm measurements) . Fig. C.6 shows four worm phenotypes from a preliminary
experiment of the lipid assay. The two features that resulted in the best separation of the four phenotypes were
extracted and plotted (Fig. C.6), where each point represents an image of a population of worms in a well ,
yielding preliminary separation of some phenotypes .
Validation, evaluation, and benchmarks: Our approach to evaluate screen ability is the same as in Aim 1.
Research Strategy Page 54
12. Principallnvestigator/Program Director (Last, first, middle): Wahlby, Carolina
1001-------:::=------~~~~=:::;-J
_ control Wild type Wild type
worms with worms with
E80 CJglp-1
_ daf-2 wild type
fat
~ 60 phenotype phenotype
'0
Qj 40
r'Jt~
II'''', /,1- " /
r , ,
.£l
§ 20 daf-2 (fat) I. '1"'1, daf-2 (fat)
' - ', ' , ': ' r,i l ' " , 'I: mutants with
c mutants 1", 1 ,' ", ' ': ,1 , II.
" ,,", I'
with fat ,I '(' , " -, ' : ' . ' I J
wild type
" •I .' ~ ;. ' l Ii' " I phenotype
~. 1
,j " I' I (
I '
"I'"I'." :
0.2 0.3 0.4 0.5 phenotype
Oil red 0 accumulation (absorbance)
I I""
. '. ' r, '., I ',t ,I I ;
I I,
II , , ' " ,
I
Figure C,7: Worm populations are often heterogeneous making measurements extracted from individual worms more
powerful to identify phenotypes,
Worm population heterogeneity from non-penetrant RNAi may lead to poor separability of phenotypes, as
they disappear in population averages. If this is the case, feature extraction from individual worms will likely be
more powerful. Fig. C.? shows data from an initial experiment where oil red 0 stain was quantified in individual
worms . Although genetically identical, some wild type worms display the phenotype of fat mutants, and vice
versa. The assay may be best scored by the percentage of individual worms meeting threshold criteria. Per
worm measurements can be extracted by selecting only those worms in the population that do not touch or
overlap (as long as this does not introduce a bias), or by using the methods proposed in Aim 1. We will also
investigate a prior-based level-set approach 135,136,139,177-181 for the extraction of individual worms incorporating
the shape model described in Aim 1.
Subtle phenotypes: Anatomical information , such as localization of fat to worm embryos or gut, plays an
important role in visual phenotype interpretation. If the features described above are not sufficient to discriminate
between subtle phenotypes, we will apply the anatomical atlas described in Aim 3.
Aim 3: Algorithms for gene expression pattern assays to identify regulators of the response of
the C. elegans host to Staphylococcus aureus infection
To identify regulators of an animal's response to infection by the clinically important human pathogen S. aureus,
and to identify potential anti-infectives with novel mechanisms of action, we will use machine learning to classify
relevant infection-response phenotypes based on the staining patterns in individual worms.
The Ausubel group has fused the promoter of c/ec-60 to GFP to create a transgenic strain of C. e/egans that
expresses the GFP reporter only when infected with S. aureus (Fig . C.8A). Expression is normally constrained to
the posterior intestinal cells upon infection; our goal is to identify samples where the immune-related pathways
have been perturbed and the pattern is altered; the targets of these perturbations will be regulators of the
expression of immune effectors.
Experimental approach
We will measure signal localization and local texture after subdividing the animal in two different ways, then use
machine learning to discern the phenotype of interest. The proposed steps are as follows:
1. Map worms to a canonical coordinate system where variations in posture have been removed while
minimizing the deformation of the textures and intensity distributions within the worms. This is a prerequisite
for comparing localization patterns between worms that are posed differently. It is also valuable for visual
examination, as a montage of straightened worms provides a clear visual overview that can help validate hits.
As depicted in Fig. C.8, we will extract each single worm (or worm in a cluster, using the segmentation
techniques of Aim 1), then re-map each worm by extracting a series of one-pixel-separated lines orthogonal to
the medial axis curve and align them along a straight line that represents the anterior-to-posterior extension of
the worm (Fig. C.8D-F). Distinguishing head from tail is facilitated by the use of a C. e/egans strain whose head
is labeled with the red fluorescent marker mye-2:mCherry.
Research Strategy Page 55
13. Principal Investigator/Program Director (Last, first, middle): Wahlby, Carolina
Figure C.B: Worm straightening
(schematic). A: Original fluorescent
image. B: Foreground/background seg
mentation of corresponding brightfield
image. C: Single worm from fluorescence
image. 0: Medial axis and cross sections,
F straightened in E and re-sampled to F
Previous work on worm straightening has established that the main problem is that of finding a medial axis
curve in 20 and 30 36 . For the limited resolution of HTS images, we propose to use control points along the
medial axis transform 157 (as in Aim 1), and approximate the worm's medial axis by a smooth spline function .
We expect the method to successfully minimize the loss of intra-worm morphology because the rotations of the
lines will be rigid, and the only loss of image resolution will be due to pixel interpolation at rotation.
2. Extract intensity and texture features from fixed regions along the worm to capture the spatial
aspects of the localization. We will partition the straightened worm into pieces of equal length, then extract
intensity and texture features from each partition.
3. Create an atlas of the main anatomical features to allow features to be extracted from biologically
meaningful regions. In this assay, the emphasis is on signal localization and texture; a worm is not a random
structure, and by mapping each worm to an anatomical atlas simplified to the resolution available in a high
throughput experiment, the context of the signals can be accessed .
We will compute the mean length and the mean width profile from a representative subset of the straightened
worms in the experiment. The Ausubellab will inspect 5-10 randomly sampled worms and independently outline
the epithelium, gut, head, and uterus. These are the anatomical features that are easily discernible with the
magnification and staining of this assay ; for other assays the regions of interest will be different. Previous work
has demonstrated the feasibility of constructing a worm atlas for high-resolution 3-D images 182. Some of its
measurement techniques may transfer, but different algorithms are required for low-resolution, high-throughput
screens where multiple worms touch and overlap.
4. Extract intensity and texture features from each region in the atlas. We will deform the atlas to match
the shape of the straightened worm, then extract intensity and texture features from the regions corresponding
to each anatomical feature. We plan to deform the atlas rather than the worm because it will be beneficial to
preserve the scale of the textures in the tissue.
5. Train a boosting classifier to discern the phenotype of interest in individual worms. We will train the
classifier in an iterative fashion, building on techniques that have performed well for cells 55. Using an interactive
software tool, our collaborators in the Ausubel lab will initially identify a few animals as positive or negative for
the phenotype. The tool will then train a classifier and display a number of worms with putative labels. Next, our
collaborators will correct the computer's errors, the classifier will be retrained, and so on. This iterative process
continues until the classifier is sufficiently accurate.
We will use fast gentle boosting183, which has performed well and shown resilience to overtraining in cell
based screens 55 ,128. The resulting classifier consists of a sequence of rules (decision stumps), each of which
is a nonlinear function of only one feature . Thus, it is more transparent than many other methods: the user can
see which features the classifier is using. Once we have obtained boosting scores for each individual worm, we
will compute enrichment scores for each sample by reference to a beta-binomial model fitted to the experiment
wide distribution of per-worm scores 55 . Based on our experience with subtle cellular phenotypes, we believe
that a training set of a few hundred worms will be sufficient.
Validation, evaluation, and benchmarks: Our approach to evaluate screenability is the same as in Aim 1.
Potential problems and alternative strategies
Discriminating head from tail based on their width profiles as has been successful in previous work on
high-resolution images of individual worms 164. We propose this solution if no flurescent markers are available.
Overlapping worms: Worms are transparent, so the signals from two overlapping worms will mix. If this
becomes a problem, we will algorithmically mark overlapping pixels before straightening and transformation so
that they can be excluded from the feature extraction steps.
Research Strategy Page 56