
Recommended
More Related Content
Viewers also liked
Viewers also liked (14)
Esterson Gorlachev Slr Poster Geer 2010
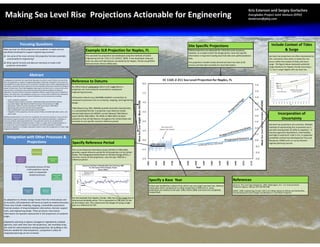
- 1. Kris Esterson and Sergey Gorlachev Ki Et dS g yG l h Making Sea Level Rise Projections Actionable for Engineering Making Sea Level Rise Projections A i M ki g S L l Ri P j i Actionable f E gi bl for Engineering i g Everglades Project Joint Venture (EPJV) Everglades Project Joint Venture (EPJV) kesterson@pbsj.com k @ bj Focusing Questions F i Q ti Site Specific Projections Site Specific Projections Include Context of Tides I l d C f Tid Most sea level rise (SLR) projections are academic in origin and not Most sea level rise (SLR) projections are academic in origin and not pl SLR P j i f N pl , FL Example SLR Projection for Naples, FL E Global projections are adequate for initial discussion purposes. & Surge & Surge specifically developed to support engineering processes. specifically developed to support engineering processes However, as a project enters the design phase, more site‐specific Are some of the most common SLR projection formats essentially h l l d l d h h d f This sea level rise projection was developed using the methods of USACE / information is required including local tide data and uplift/subsidence Sea level rise projections are often represented as unactionable for engineering? Engineering Circular 1165‐2‐211 (USACE, 2009). It was developed using sea E i i Ci l 1165 2 211 (USACE 2009) I d l d i data. d thin, monotonic lines when in reality the rise level rise rates and tidal datums calculated by for Naples, Florida using NOAA l l i t d tid l d t l l t d b f N l Fl id i NOAA occurs within the context of tides and storm What specific formats and data are necessary to make a SLR What specific formats and data are necessary to make a SLR This projection includes locally derived sea level rise rates (2.02 p j y ( National Ocean Service (NOS) data. National Ocean Service (NOS) data surge. The figure below represents potential p j projection actionable? mm/yr) and tide data recorded at a local tide station. surge elevations for Naples, Florida assuming a l i f N l Fl id i 1:1 rise in surge heights with sea level rise. 11 i i h i ht ith l l i Abstract As adaptation to sea level rise moves from discussion to action in south Florida the role of sea As adaptation to sea level rise moves from discussion to action in south Florida, the role of sea level rise projections in support of engineering design is examined. Projections of sea level rise Reference to Datums Reference to Datums are available from many sources and in many forms. However, there is often a gap between the information provided by these projections and the actionable information required for design of information provided by these projections and the actionable information required for design of B f By referencing an orthometric d t i th t i datum and a tidal d t d tid l datum a coastal infrastructure. Given that adaptation planning for sea level rise is in a nascent form, the improvements in projections that would be produced by iterative feedback during their projection can more easily be connected to subsequent j ti il b t dt b t application, has been limited. Projections originally crafted to support discussion of adaptation li ti h b li it d P j ti i i ll ft d t t di i f d t ti engineering processes. engineering processes p , p p p , y q options, the initial step in the adaptation process, are in many cases insufficient for subsequent engineering in their present form. Common limitations can be overcome by including: Orthometric datums (e g NAVD88) establish a connection to (e.g. NAVD88) establish a connection to • Local, not global, projections , g ,p j subsequent processes such as surveying, mapping, and engineering subsequent processes such as surveying mapping and engineering • Projections given relative to specific, standardized tidal and orthometric datums • (e.g. Mean Higher High Water and North American Vertical Datum of 1988) ( h h d h l f ) design. design. • Specifying a reference period (e.g National Tidal Datum Epoch 1983 2001) Specifying a reference period (e g National Tidal Datum Epoch 1983‐2001) • Specifying a base year for the start of the projection Tidal datums (e.g. MSL, MHHW) quantify local tide characteristics ( g , )q y • Clear quantification and communication of uncertainty • Integration of the projections into the context of tides, extratidal high water events, and Integration of the projections into the context of tides extratidal high water events and p j y y in a standardized format. A projection may reference locally storm surge derived tidal datums for NOAA’s current National Tidal Datum Incorporation of co po at o o Additional improvements come from the recognition that sea level projections may not be the p g p j y Epoch (NTDE 1983‐2001). The NTDE of 1983‐2001 has been final decision support product, but are an input to other statistical evaluations, modeling, or economic analyses supporting engineering. The projection’s format can be adjusted for l h ’ f b d df adopted so that all tidal datums throughout the United States will U t i t Uncertainty be based on one specific common reference period compatibility with these secondary processes. Finally, in a region with multiple projections in compatibility with these secondary processes. Finally, in a region with multiple projections in use, projections must be designed to be transparent and intercomparable to facilitate Sea level rise projections are uncertain. Multiple harmonious adaptation of complex, dependent systems under the management of a wide range methods of representing this uncertainty are in of agencies and actors. of agencies and actors use with varying levels of utility to engineers. A scenario approach (low/historic, intermediate, h (l /h d and high) is used by EC 1165‐2‐211. A subjective d hi h) i d b EC 1165 2 211 A bj ti Integration with Other Processes & Integration with Other Processes & probability method was developed by Titus and b bilit th d d l d b Tit d Narayanan (1995) and is in use by Florida s Narayanan (1995) and is in use by Florida’s Projections j Specify Reference Period Specify Reference Period regional planning councils. regional planning councils The current National Tidal Datum Epoch (NTDE) of 1983‐2001, SLR Projection SLR Projection provides a good reference period for SLR projections in the United id d f i d f SLR j ti i th U it d States The Intergovernmental Panel on Climate Change (IPCC) a States. The Intergovernmental Panel on Climate Change (IPCC), a Is original SLR common source of SLR projections uses the year 1990 for a common source of SLR projections, uses the year 1990 for a Groundwater f information Model M d l reference period. adequate? Interannual Variation in Monthly Mean Sea Level since 1980 Variation in Monthly Mean Sea Level since 1980 An example process of how For Tide Station 8725110 Naples, Florida a SLR projection may be SLR j i b Source: NOAA used in a sequential di ti l Infrastructure analytical process. anal tical process Coastal Well Engineering Engineering Field Field Design Vulnerability Specify a Base Year Specify a Base Year References A base year establishes a datum from which one can project sea level rise Without A base year establishes a datum from which one can project sea level rise. Without James G. Titus and Vijay Narayanan. 1995. Washington, D.C.: U.S. Environmental j y y g Protection Agency. 186 pp. EPA 230‐R95‐008 a base year direct comparisons to other projections is difficult (i.e. some y p p j ( Cost‐Benefit Adaptation projections are relative to the year 1990, others 2000, and some are completely g g , USACE. 2009. Engineering Circular 1165‐2‐211.Water Resource Policies and Authorities, Analysis Planning Planning unspecified). ifi d) Incorporating Sea‐Level Change Considerations in Civil Works Programs. For this example from Naples, Florida, MSL has a 0.3m range due to F hi l f N l Fl id MSL h 03 d As adaptation to climate change moves from the initial phases and As adaptation to climate change moves from the initial phases and interannual variability alone This is equivalent to 148 years of SLR variability alone. This is equivalent to 148 years of SLR on to action, SLR projections will serve as inputs to several processes. on to action, SLR projections will serve as inputs to several processes. at the historic rate. This underscores the danger of using a single at the historic rate This underscores the danger of using a single These may include modeling, mapping, vulnerability assessment, These may include modeling, mapping, vulnerability assessment, yea as a e e e ce o S . year as a reference for SLR. financial analysis of impacts/adaption alternatives, decision support financial analysis of impacts/adaption alternatives, decision support tools, and engineering design. These processes may require , g g g p y q information not typically represented in SLR projections of academic yp y p p j origin. g Adaptation planning in regions managed or regulated by multiple p p g g g g y p agencies, each with their own SLR projections, will inevitably bring the need for intercomparison among projections. By building in the features needed for intercomparison, a projection’s utility for integrated planning can be increased.