More Related Content
More from joseleorcasita (20)
Daily livestock report oct 11 2012
- 1. Vol. 10, No. 197 / October 11, 2012
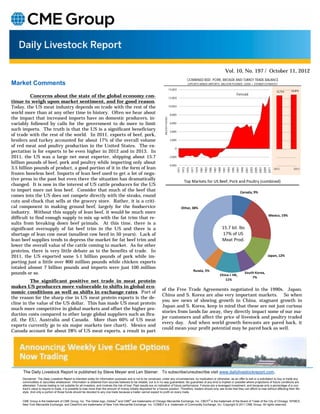
COMBINED BEEF, PORK, BROILER AND TURKEY TRADE BALANCE
Market Comments EXPORTS MINUS IMPORTS, MILLION POUNDS, USDA + STEINER ESTIMATES
14,000 12,875
12,714
Forecast
Concerns about the state of the global economy con- 12,000
tinue to weigh upon market sentiment, and for good reason.
Today, the US meat industry depends on trade with the rest of the 10,000
world more than at any other time in history. Often we hear about 8,000
the impact that increased imports have on domestic producers, in-
MILLION POUNDS
variably followed by calls for the government to do more to limit 6,000
such imports. The truth is that the US is a significant beneficiary 4,000
of trade with the rest of the world. In 2011, exports of beef, pork,
broilers and turkey accounted for about 17% of the overall volume 2,000
of red meat and poultry production in the United States. The ex- 0
pectation is for exports to be even higher in 2012 and in 2013. In
2011, the US was a large net meat exporter, shipping about 15.7 -2,000
billion pounds of beef, pork and poultry while importing only about
-4,000
3.5 billion pounds of product, a good portion of it in the form of lean
1971
1973
1975
1977
1979
1981
1983
1985
1987
1989
1991
1993
1995
1997
1999
2001
2003
2005
2007
2009
2011
2012 2013
frozen boneless beef. Imports of lean beef used to get a lot of nega-
tive press in the past but even there the situation has dramatically
Top Markets for US Beef, Pork and Poultry (combined)
changed. It is now in the interest of US cattle producers for the US
to import more not less beef. Consider that much of the beef that Canada, 9%
comes into the US does not compete directly with the steaks, round
cuts and chuck that sells at the grocery store. Rather, it is a criti-
cal component in making ground beef, largely for the foodservice Other, 38%
industry. Without this supply of lean beef, it would be much more
Mexico, 19%
difficult to find enough supply to mix up with the fat trim that re-
sults from breaking down beef primals. At this time, there is a
significant oversupply of fat beef trim in the US and there is a 15.7 bil. lbs
shortage of lean cow meat (smallest cow herd in 50 years). Lack of 17% of US
lean beef supplies tends to depress the market for fat beef trim and Meat Prod.
lower the overall value of the cattle coming to market. As for other
proteins, there is very little debate as to the benefits of trade. In
2011, the US exported some 5.1 billion pounds of pork while im- Japan, 12%
porting just a little over 800 million pounds while chicken exports
totaled almost 7 billion pounds and imports were just 100 million
Russia, 5%
pounds or so. China + HK,
South Korea,
7%
The significant positive net trade in meat protein 11%
makes US producers more vulnerable to shifts in global eco-
of the Free Trade Agreements negotiated in the 1990s. Japan,
nomic conditions as well as shifts in exchange rates. Part of
China and S. Korea are also very important markets. So when
the reason for the sharp rise in US meat protein exports is the de-
you see news of slowing growth in China, stagnant growth in
cline in the value of the US dollar. This has made US meat protein
Japan and S. Korea, keep in mind that these are not just curious
much more competitive in global markets and offset the higher pro-
stories from lands far away, they directly impact some of our ma-
duction costs compared to other large global suppliers such as Bra-
jor customers and affect the price of livestock and poultry traded
zil, the EU, Australia and Canada. More than 60% of US meat
every day. And when world growth forecasts are pared back, it
exports currently go to six major markets (see chart). Mexico and
could mean your profit potential may be pared back as well.
Canada account for about 28% of US meat exports, a result in part
The Daily Livestock Report is published by Steve Meyer and Len Steiner. To subscribe/unsubscribe visit www.dailylivestockreport.com.
Disclaimer: The Daily Livestock Report is intended solely for information purposes and is not to be construed, under any circumstances, by implication or otherwise, as an offer to sell or a solicitation to buy or trade any
commodities or securities whatsoever. Information is obtained from sources believed to be reliable, but is in no way guaranteed. No guarantee of any kind is implied or possible where projections of future conditions are
attempted. Futures trading is not suitable for all investors, and involves the risk of loss. Past results are no indication of future performance. Futures are a leveraged investment, and because only a percentage of a con-
tract’s value is require to trade, it is possible to lose more than the amount of money initially deposited for a futures position. Therefore, traders should only use funds that they can afford to lose without affecting their life-
style. And only a portion of those funds should be devoted to any one trade because a trader cannot expect to profit on every trade.
CME Group is the trademark of CME Group, Inc. The Globe logo, Globex® and CME® are trademarks of Chicago Mercantile Exchange, Inc. CBOT® is the trademark of the Board of Trade of the City of Chicago. NYMEX,
New York Mercantile Exchange, and ClearPort are trademarks of New York Mercantile Exchange. Inc. COMEX is a trademark of Commodity Exchange, Inc. Copyright © 2011 CME Group. All rights reserved.