Q1 2013 infographic
- 1. WHERE THE JOBS ARE
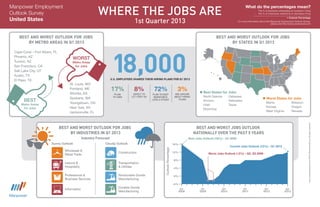
Manpower Employment What do the percentages mean?
The % of employers anticipating an increase in hiring
Outlook Survey – the % of employers expecting to decrease hiring
1st Quarter 2013
= Outlook Percentage
United States For more information about the Manpower Employment Outlook Survey,
please visit http://press.manpower.com
BEST AND WORST OUTLOOK FOR JOBS BEST AND WORST OUTLOOK FOR JOBS
BY METRO AREAS IN Q1 2013 BY STATES IN Q1 2013
18,000
Cape Coral – Fort Myers, FL
Phoenix, AZ
WORST
Tucson, AZ Metro Areas
San Francisco, CA for Jobs
Salt Lake City, UT
Austin, TX
El Paso, TX U.S. EMPLOYERS SHARED THEIR HIRING PLANS FOR Q1 2013
St. Louis, MO
Portland, ME 17% 8% 72% 3% Best States for Jobs
Wichita, KS PLAN EXPECT TO PLAN TO KEEP ARE UNSURE
TO HIRE LET STAFF GO WORKFORCE ABOUT HIRING North Dakota Delaware
Spokane, WA LEVELS STEADY PLANS Worst States for Jobs
BEST Youngstown, OH
Arizona Nebraska
Maine Missouri
Metro Areas Utah Texas
for Jobs New York, NY Kansas Oregon
Wyoming
Jacksonville, FL West Virginia Nevada
www.manpowergroup.com ©2012 ManpowerGroup. All rights reserved.
BEST AND WORST OUTLOOK FOR JOBS BEST AND WORST JOBS OUTLOOK
BY INDUSTRIES IN Q1 2013 NATIONALLY OVER THE PAST 5 YEARS
Industry Forecast Best Jobs Outlook (16%) – Q1 2008
Sunny Outlook Cloudy Outlook 16%
Current Jobs Outlook (12%) – Q1 2013
Outlook Percentage
Wholesale & 12%
Construction Worst Jobs Outlook (-2%) – Q2, Q3 2009
Retail Trade
8%
Leisure & Transportation
Hospitality & Utilities 4%
Professional & Nondurable Goods 0%
Business Services Manufacturing
-4%
Durable Goods
Information Q1 Q1 Q1 Q1 Q1 Q1
Manufacturing 2008 2009 2010 2011 2012 2013