S&P 500: Near-Term Resistance Proves Formidable
•
0 likes•61 views

WHEAT: When Panic Buying Begets Panic Buying The following commentary caused me to look at a six month chart of Wheat: Russia Bans Grain Exports after Drought Shrivels Crop: Russia announced Thursday that it would ban grain exports through the end of the year, a response to a scorching drought that has destroyed millions of acres of Russian wheat and hobbled the country’s agricultural revival. The ban on grain exports by Russia, one of the world’s largest wheat producers, helped propel wheat prices in the United States toward their highest levels in nearly two years.
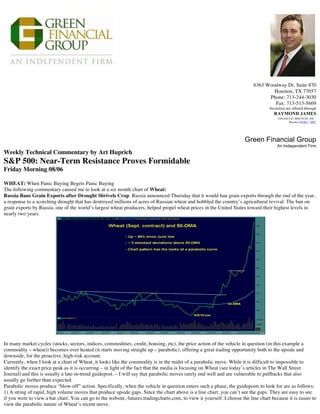
![2) Climactic changes in trend. In other words, following the string of rapid price gains, the vehicle in question records a “key reversal” in that after
posting a new high, it fades into the close, closing at of very near the lows of the session.
3) Sometimes, after the climactic change in trend, there is a downside gap the next day.
So what can high risk proactive accounts do with this information? You can choose to go long wheat, hoping the move continues. I am not
leaning in this direction, but am actually looking to go in the opposite direction (play the downside). However, if you choose otherwise, while there
isn’t a pure exchange-traded note that tracks Wheat, there are two that have wheat as a component. The two are iPath Dow Jones-UBS Grains Total
Return Sub-Index ETN (JJG/$42.30) and ELEMENTS MLCX Grains Index Fund (GRU/$6.22). Please call Closed-End Funds Research for details
The alternative is to buy the DB Agriculture Short ETN (ADZ/$32.80). While this ETN consists of corn, wheat, soybeans, and sugar #11, please
call Closed-End Funds Research for details. This is the direction I think high-risk, proactive accounts that will manage the risk (identify and follow a
stop loss discipline) should be considering.
Tactically, you can attempt to pick the top, wait for a climactic trend change (see point # 2 above) or tranche into a one third position or one half
position at three or two different points. I prefer the last tactic.
I’ve also included a two year chart overlaying Wheat (scale on right side of the chart) and the DB Agriculture Short ETN [(ADZ), scale on the left
side of the chart]. You’ll notice the proximity of resistance for Wheat and support for ADZ.
Charts courtesy of Thomson Reuter.](data:image/gif;base64,R0lGODlhAQABAIAAAAAAAP///yH5BAEAAAAALAAAAAABAAEAAAIBRAA7)
Recommended
More Related Content
Similar to S&P 500: Near-Term Resistance Proves Formidable
Similar to S&P 500: Near-Term Resistance Proves Formidable (20)
More from Jeff Green
More from Jeff Green (20)
S&P 500: Near-Term Resistance Proves Formidable
- 1. 6363 Woodway Dr. Suite 870 Houston, TX 77057 Phone: 713-244-3030 Fax: 713-513-5669 Securities are offered through RAYMOND JAMES FINANCIAL SERVICES, INC. Member FINRA / SIPC Green Financial Group An Independent Firm Weekly Technical Commentary by Art Huprich S&P 500: Near-Term Resistance Proves Formidable Friday Morning 08/06 WHEAT: When Panic Buying Begets Panic Buying The following commentary caused me to look at a six month chart of Wheat: Russia Bans Grain Exports after Drought Shrivels Crop: Russia announced Thursday that it would ban grain exports through the end of the year, a response to a scorching drought that has destroyed millions of acres of Russian wheat and hobbled the country’s agricultural revival. The ban on grain exports by Russia, one of the world’s largest wheat producers, helped propel wheat prices in the United States toward their highest levels in nearly two years. In many market cycles (stocks, sectors, indices, commodities, credit, housing, etc), the price action of the vehicle in question (in this example a commodity – wheat)) becomes over heated (it starts moving straight up – parabolic), offering a great trading opportunity both to the upside and downside, for the proactive, high-risk account. Currently, when I look at a chart of Wheat, it looks like the commodity is in the midst of a parabolic move. While it is difficult to impossible to identify the exact price peak as it is occurring – in light of the fact that the media is focusing on Wheat (see today’s articles in The Wall Street Journal) and this is usually a late-in-trend guidepost. – I will say that parabolic moves rarely end well and are vulnerable to pullbacks that also usually go further than expected. Parabolic moves produce “blow-off” action. Specifically, when the vehicle in question enters such a phase, the guideposts to look for are as follows: 1) A string of rapid, high volume moves that produce upside gaps. Since the chart above is a line chart, you can’t see the gaps. They are easy to see if you were to view a bar chart. You can go to the website, futures.tradingcharts.com, to view it yourself. I choose the line chart because it is easier to view the parabolic nature of Wheat’s recent move.
- 2. 2) Climactic changes in trend. In other words, following the string of rapid price gains, the vehicle in question records a “key reversal” in that after posting a new high, it fades into the close, closing at of very near the lows of the session. 3) Sometimes, after the climactic change in trend, there is a downside gap the next day. So what can high risk proactive accounts do with this information? You can choose to go long wheat, hoping the move continues. I am not leaning in this direction, but am actually looking to go in the opposite direction (play the downside). However, if you choose otherwise, while there isn’t a pure exchange-traded note that tracks Wheat, there are two that have wheat as a component. The two are iPath Dow Jones-UBS Grains Total Return Sub-Index ETN (JJG/$42.30) and ELEMENTS MLCX Grains Index Fund (GRU/$6.22). Please call Closed-End Funds Research for details The alternative is to buy the DB Agriculture Short ETN (ADZ/$32.80). While this ETN consists of corn, wheat, soybeans, and sugar #11, please call Closed-End Funds Research for details. This is the direction I think high-risk, proactive accounts that will manage the risk (identify and follow a stop loss discipline) should be considering. Tactically, you can attempt to pick the top, wait for a climactic trend change (see point # 2 above) or tranche into a one third position or one half position at three or two different points. I prefer the last tactic. I’ve also included a two year chart overlaying Wheat (scale on right side of the chart) and the DB Agriculture Short ETN [(ADZ), scale on the left side of the chart]. You’ll notice the proximity of resistance for Wheat and support for ADZ. Charts courtesy of Thomson Reuter.