SlideShare a Scribd company logo
1 of 80
Download to read offline
1
Estonian Business School
Chair of Management
TRANSITIONING TO A PERFORMANCE-BASED
ELECTRICITY NETWORK PRICE REGULATION IN
ESTONIA
A CASE STUDY
Master’s thesis
by
Jaanus Uiga
Supervisor: Anto Liivat
Adviser: Märt Ots, PhD
Tallinn 2017
2
I herewith declare that I have written the Master’s Thesis independently. References
have been indicated for the publications, claims, options and different sources by other
authors.
25th
May 2017 ............................/J. Uiga/
ii
TABLE OF CONTENTS
LIST OF TABLES......................................................................................................iv	
LIST OF FIGURES..................................................................................................... v	
ABBREVIATIONS.....................................................................................................vi	
ABSTRACT................................................................................................................vii	
INTRODUCTION ....................................................................................................... 1	
1.	 LITERATURE REVIEW.................................................................................. 4	
1.1.	 Monopolies and regulation ............................................................................ 4	
1.2.	 Price regulation of electricity network companies......................................... 6	
1.2.1.	 Traditional regulation and performance-based regulation..................... 6	
1.2.2.	 Regulation models used for electricity networks................................. 10	
1.2.3.	 Designing a performance-based price regulation ................................ 11	
1.2.4.	 Risks of using performance incentives ................................................ 13	
1.3.	 Balanced Scorecard and Strategy Maps....................................................... 15	
1.3.1.	 Strategy and the Balanced Scorecard................................................... 15	
1.3.2.	 Limitations and critique....................................................................... 16	
1.3.3.	 Strategy Maps ...................................................................................... 17	
2.	 RESEARCH METHODOLOGY.................................................................... 19	
2.1.	 Research design ........................................................................................... 19	
2.2.	 Background of the analysed case................................................................. 21	
2.2.1.	 Electricity market in Estonia................................................................ 21	
2.2.2.	 Electricity network price regulation in Estonia ................................... 23	
2.3.	 Sampling and the respondent group............................................................. 26	
2.4.	 Data collection ............................................................................................. 27	
2.5.	 Data analysis................................................................................................ 28	
2.6.	 Research limitations..................................................................................... 29	
3.	 RESULTS AND DISCUSSION....................................................................... 31	
3.1.	 Price regulation framework in Estonia ........................................................ 31	
3.1.1.	 Existing price-regulation framework................................................... 31	
3.1.2.	 Potential performance-based price regulation framework................... 33	
3.2.	 Network company’s management................................................................ 35
iii
3.2.1.	 Financial aspects.................................................................................. 35	
3.2.2.	 Customer expectations......................................................................... 36	
3.2.3.	 Internal aspects..................................................................................... 36	
3.2.4.	 Learning and growth............................................................................ 38	
3.3.	 Further observations..................................................................................... 38	
3.3.1.	 The future of network companies ........................................................ 38	
3.3.2.	 Other observations ............................................................................... 39	
3.4.	 Discussion.................................................................................................... 40	
3.4.1.	 Implications and propositions.............................................................. 40	
3.4.2.	 Strategy Map........................................................................................ 42	
3.4.3.	 Further research ................................................................................... 44	
CONCLUSIONS ........................................................................................................ 47	
REFERENCES........................................................................................................... 50	
APPENDICES............................................................................................................ 55	
Appendix 1. A selection of performance areas and metrics .................................... 56	
Appendix 2. Risks of using performance incentives ............................................... 62	
Appendix 3. Interviewed People.............................................................................. 63	
Appendix 4. Introduction to the interview and questions........................................ 64	
Appendix 5. Possible price regulation frameworks for Estonia .............................. 66	
Appendix 6. Strategy Map and its KPIs................................................................... 67	
RESÜMEE.................................................................................................................. 68
iv
LIST OF TABLES
Table 1. Deserved and underserved market power........................................................ 5	
Table 2. Key principles for designing a performance incentive mechanism............... 11	
Table 3. Potential risks of using performance incentives: mitigation and avoidance.. 14	
Table 4. Electricity network operators in Estonia in 2015........................................... 22	
Table 5. Sample calculation of the allowed revenue of the DSO................................ 24	
Table 6. Traditional and emerging performance areas ................................................ 56	
Table 7. Reliability Performance Metrics.................................................................... 56	
Table 8. Employee Safety Performance Metrics ......................................................... 57	
Table 9. Public Safety Performance Metrics ............................................................... 57	
Table 10. Customer Satisfaction Performance Metrics ............................................... 58	
Table 11. Plant Performance Metrics........................................................................... 58	
Table 12. Cost Performance Metrics ........................................................................... 59	
Table 13. System efficiency Performance Metrics...................................................... 59	
Table 14. Customer Engagement Performance Metrics .............................................. 60	
Table 15. Network Support Services Performance Metrics......................................... 61	
Table 16. Environmental Goals Performance Metrics................................................. 61	
Table 17. Potential risks of using performance incentives: mitigation and avoidance 62	
Table 18. Possible frameworks for electricity network price regulation in Estonia.... 66
v
LIST OF FIGURES
Figure 1. Cost of service regulation and performance (incentive)-based regulation..... 7	
Figure 2. Allowed revenues under cost-of-service regulation....................................... 8	
Figure 3. Costs and prices under a performance-based regulation................................ 9	
Figure 4. Regulation of selected power and utilities in Europe................................... 10	
Figure 5. Conceptual illustration of a performance-based price regulation................. 12	
Figure 6. Implementation of a performance-based regulation..................................... 13	
Figure 7. The Balanced Scorecard Framework............................................................ 16	
Figure 8. An example Strategy Map and its connections to the Balanced Scorecard . 18	
Figure 9. A conceptual illustration of electricity sector price regulation in Estonia ... 21	
Figure 10. Average prices of network service operators in Estonia 2006 – 2015 ....... 25	
Figure 11. Average price of network service in Estonia 2006 – 2015......................... 25	
Figure 12. A potential Strategy Map of an electric utility under a performance-based
price regulation............................................................................................ 42	
Figure 13. A potential Strategy Map and its KPI’s for an electric utility under a
performance-based price regulation............................................................ 67
vi
ABBREVIATIONS
BSC balanced scorecard
CAIDI customer average interruption duration index
CAPEX capital expenditure
CPI consumer price index
DSO distribution system operator
EBITDA earnings before interest taxes depreciation and amortisation
EVA economic value added
GWh gigawatt hour
KPA key performance area
KPI key performance indicator
MW megawatt
MWh megawatt hour
OFGEM office of gas and electricity markets of the United Kingdom
OPEX operational expenses
PBR performance-based regulation
RAB regulatory asset base
R&D research and development
RoR rate on return
RPI retail price index
RPI-x retail price index minus x
SAIDI system average interruption duration index
SAIFI system average interruption frequency index
TWh terawatt hour
TSO transmission system operator
VAT value added tax
WACC weighted average cost on capital
vii
ABSTRACT
Uiga, J. Transitioning to a performance-based electricity network price regulation in
Estonia. A case study. Master’s Thesis, Estonian Business School, Tallinn, 2017,
72 pages, 13 figures, 18 tables, 61 references, 6 appendices, in English.
PERFORMANCE-BASED PRICE REGULATION, STRATEGY MAPS,
ELECTRICITY NETWORK COMPANY, ELECTRIC UTILITY, CASE STUDY,
NON-ZERO SUM GAME, DSO, TSO, ENERGY REGULATION.
The aim of the Master’s Thesis was to identify the possibilities of transitioning to a
performance-based electricity network price regulation in Estonia and its impacts to the
management of the network companies.
To attain the set goals, the author conducted an initial literature review and in
conjunction with the results of semi-structured interviews developed a possible
framework for a performance-based price regulation in Estonia. In total, 12 semi-
structured interviews were conducted with the members of the boards of the largest
Estonian electricity network companies and energy regulators with experience in the
field. The case study research methodology was used to generate ideas and insights
from the data and interviews.
Based on the results of the research, the author proposed two ways of changing the
existing electricity network price regulation: a) amending (upgrading) the existing
framework; b) transitioning to a performance-based price regulation. To describe the
impacts of transitioning to a performance-based price regulation for an electric utility,
a Strategy Map was compiled.
The ideas and insights presented in this thesis can be applied in natural monopolies, that
own or operate an infrastructure (e.g. gas networks). The results can be used by
legislators to design and implement a performance-based price regulation framework
for Estonia.
1
INTRODUCTION
Electricity is a service, that is widely used. The final cost of electricity consumption is
determined by taxes and levies by the government, electricity network tariffs and the
price of electrical energy.
Under the conditions of a competitive market the unit price of a good or a service forms
based on both supply and demand. In the cases of market dominance (i.e. monopoly)
no competition occurs and the task to simulate competition is generally given to a
regulator. Until recent years, for Estonian electricity consumers, both the cost of
electrical energy and network fees, was determined in a regulated market. As electricity
production and supply is an ordinary monopoly instead of a natural monopoly, the
liberalisation of this sector was possible. Estonian electricity market was fully
liberalised (opened to competition) in 01.01.2013 (Majandus- ja
kommunikatsiooniministeerium 2017).
The electricity network companies are natural monopolies (similarly to natural gas and
public water supply). Therefore, the unit price of the network service cannot be formed
based on competition. Economic regulation of monopolies, especially natural
monopolies, is necessary. If the monopolies are left unregulated, the companies might
use their market power to limit third party access to their services or products (Tirole
2015, 1668-1669). The consumers, having no alternatives, would then have to accept
unreasonably high prices. In Estonia, the price regulation of the electricity network
companies is conducted based on the Competition Act (Riigikogu 2015) and Electricity
Market Act (Riigikogu 2017).
The aim of the network price regulation is to ensure that the consumer receives a quality
service with a reasonable price, while maintaining the economic sustainability of the
network company. The general principles of the price regulation of the Estonian energy
sector were first introduced in 1998. The specific price regulation of the Estonian
electricity network companies was set by the entry into force of the Electricity Market
Act in 2003 (Uukkivi et al. 2014, 228). An ex-ante regulation model is used, which
2
allows the regulator (Estonian Competition Authority) to assess, whether the costs made
by the company are reasonable and fair. This is done based on the data received from
the companies and benchmarking. The network company is allowed to earn a
reasonable return, which is calculated on the basis of the company’s assets and the
weighted average cost of capital (WACC).
In a situation, where the majority of the electricity network was constructed during 1955
– 1985 and network operators had to make up for significant underinvestment during
1985 – 1997 (Elering 2010, 31; Vali 2014), linking the allowed return with the value of
the company’s assets was an effective motivator. The service quality of Estonian
electricity distribution has since significantly improved (Konkurentsiamet 2015, 22).
What is more, the average network tariffs have fallen compared to 2005 (in real terms
– i.e. the inflation has been rising faster than the network tariffs) (ibid 2015, 10).
The current regulation system is similar to a negative sum game. In cases where the
consumer wins (reduced electricity bill), the company loses in profit, EBITDA or sales
revenues (economic sustainability) and in cases where, the company gains a higher
profit, the consumers will have to pay more. Negative changes in the network
company’s financials might have significant impacts to the company’s financial health,
as the investments are made using foreign capital. This, in turn may contribute to the
decline of service quality in the long run.
To facilitate the fulfilment of the 2030 climate and energy goals of the EU, on 30th
of
November 2016 the European Commission published several draft legislative proposals
(so-called “Clean Energy Package”). The aim of these legislative proposals is to
increase energy efficiency, facilitate the uptake of renewable energy and increase the
consumer’s participation in the energy market (European Commission 2016). The
electricity network companies have a major role to play in attaining the 2030 goals. The
current price regulation in Estonia fulfils the goal of providing a quality service at a
reasonable price. However, it might not incentivise the companies to take up new and
innovative solutions in order to reduce consumption, increasing the share of renewables
nor facilitating the active participation of the consumers. To incentivise the natural
monopoly to make useful decisions for the consumers, some countries (UK, Germany,
USA, Australia) have started using performance-based price regulation.
3
Considering the implications of price regulation to the consumers and the companies,
creating a non-zero sum game (a win-win solution) in electricity transmission and
distribution price regulation is an important topic yet to be addressed in Estonian
legislative environment. A possible way of creating a non-zero sum game is utilizing
a performance-based price regulation, where the utility’s profits are decoupled from its
costs and are tied to the relative performance to specific benchmarks.
The aim of the Master’s Thesis is to identify the possibilities and challenges of
transitioning to a performance-based electricity network price regulation in
Estonia and its impacts to the management of the network companies.
The aim of the thesis will be achieved by answering the following questions:
1. Whether and how should the current price regulation be improved to foster
an Estonian electricity network company’s economic sustainability?
2. What should a performance-based price regulation framework look like in
Estonia?
3. What would an electricity network company’s Strategy Map look like after
transitioning to a performance-based price regulation?
In order to answer these questions, both literature review and semi-structured interviews
will be used within the framework of case study research. Based on the literature
overview the author will describe the possible framework for a performance-based price
regulation. In parallel, 12 semi-structured interviews are conducted with the senior level
management of the largest Estonian electricity network companies and energy
regulators with experience in the field.
The thesis consists of three chapters. In the first chapter, a literature overview of the
topic and previous research is given. The second chapter focuses on the research
methodology and design. In the third chapter, the results of the research are presented,
followed by a discussion on their implications and relevance.
The author of the thesis would like to thank the supervisors, interviewees and all others,
who have helped during the compilation of the thesis. Special gratitude is given to the
author’s girlfriend for her enormous patience and support.
4
1. LITERATURE REVIEW
1.1. Monopolies and regulation
Competitive markets are the most efficient way of producing and selling goods or
services (Pérez-Arriaga 2013, 152). In the competitive market “above-normal profits
are constantly being eliminated by competition, while new sources of profit are being
created through innovation” (Cowen & Tabarrok 2013, 229).
Under certain circumstances, the conditions required for an acceptable level of
competition are not present, however. In other words, markets can fail as a result of
market concentration, economies of scale, public goods, externalities, incomplete
information or transaction costs. Market failures must be corrected by regulatory
intervention to ensure the optimal outcome for society. (Pérez-Arriaga 2013, 152)
There are two main types of monopolies:
a) natural monopolies – usually networks, can be characterised by one or more of
the following features: economies of scale, capital intensity, non-storability with
fluctuating demand, location-specific delivery generating location rents, direct
connections to customers (Pérez-Arriaga 2013, 152-153);
b) ordinary monopolies – can either be administrative or non-administrative.
Administrative monopolies occur, when competition is prohibited by law, non-
administrative monopolies occur, when the entrance to the market is impossible
or extremely difficult for new competitors. In case of ordinary monopolies, the
monopoly position may disappear, when the administrative restrictions are
removed or other market developments occur (Ots 2016, 10).
An unregulated monopoly would be able to charge consumers a price much higher than
its (justified) production costs or restrictions to third-party access (Schmalensee &
Willig, 1989, 1454). Therefore, in cases of market dominance (i.e. monopoly) where
competition occurs, the task to simulate competition (ensure the optimal outcome for
society) is given to a regulator.
5
Regulators can affect the monopolies in several ways (Tirole 2015, 1667):
1. Regulation of rate of return and monitoring of the conditions under which
monopolies allow third-party access to the bottlenecks (networks) they control.
2. Allowing or invalidating horizontal or vertical mergers or agreements,
monitoring for abuse of dominant position.
3. Patent granting, upholding or rejection.
Each form of regulation described above, faces a trade-off between lowering price for
the consumers and granting a fair return for the firm (Tirole 2015, 1667). Therefore, the
appropriate regulation has two conflicting objectives (Pérez-Arriaga 2013, 153):
1. Ensuring that the allowed revenue is high enough to guarantee the economic and
financial sustainability of the company.
2. Ensuring that the allowed revenue is low enough to facilitate productive
efficiency for providing the service or product at the lowest possible cost.
According to Tirole (2015, 1669-1670), the profits of a monopoly should be regulated
based on the specificities on the regulated sector. The profits should be regulated only
when the market power is not deserved (Table 1).
A public utility should earn reasonable profit from investment, but not benefit from
lucky cost and demand conditions. For example, it should not be able to benefit from a
fall in the market price of a key input, while being able to renegotiate the regulatory
contract if that price shoots up.
Table 1. Deserved and underserved market power
(Tirole 2015, 1670)
Parameter Market power is deserved
Market power is
undeserved
Concession Competitive, well-designed
auction
Unpaid-for legal monopoly
Intellectual property Major innovation Obvious, not novel
innovation
Utility regulation Investment/effort Lucky cost and demand
conditions
In the following chapters, the author focuses on the regulation of electricity networks.
6
1.2. Price regulation of electricity network companies
1.2.1. Traditional regulation and performance-based regulation
The aim of the network price regulation is to ensure that the consumer receives a quality
service with a reasonable price, while maintaining the economic sustainability of the
network company. According to Ots (2016, 127-128), a perfect solution occurs, when:
1. The company has reached the maximum cost efficiency (efficient operational
costs, high technical efficiency).
2. The investments are made in optimal manner to new technology by avoiding
both under and overinvestment.
3. The service has high quality.
4. The company ́s return is justified and in accordance to its effective cost of
capital.
5. The administrative burden is on optimal level.
However, finding a methodology, that ensures the fulfilment of all these objectives, is
rather complicated. It is possible to come up with a regulation close to the perfect one,
but the perfect result can only be obtained in a free market situation where the price
level is determined by competition.
The regulation of electric power grids can be reduced to three main aspects: i)
investment; ii) access and iii) pricing or network cost allocation. According to Pérez-
Arriaga (2013, 270) the aims of the regulation are:
1. Contributing to an efficient network expansion.
2. Ensuring the economic viability of the transmission business through suitable
remuneration.
3. Furthering the economic efficiency for network users both in the short term
(attainment of optimal operation) and the long term (sending correct locational
signals for future network users, whether they be generators or consumers).
4. To contribute to the efficient operation of the network and the appropriate
maintenance of its facilities.
The price regulation of electric utilities can be divided into two main categories (Figure
1) (Comnes & Holl 1995, 1; Aggarwal & Burgess 2014, 50):
7
1. Traditional price regulation (also cost-of-service or rate-of-return
regulation), where the utility’s rates are mainly based on incurred costs (taxes,
investments, operating expenses) plus a reasonable return.
2. Performance-based price regulation (also incentive regulation, output-based
regulation or performance-based ratemaking), where the utility’s profits are
decoupled from its costs and are tied to the relative performance to specific
benchmarks.
The regulatory methods can also be divided into ex-ante and ex-post methods. In ex-
ante regulation, the prices that the company can charge are to be approved by the
regulator. In ex-post regulation, the prices or fees can be applied by the company
without any prior approval by the regulator, but the regulator may control later whether
these prices or fees meet the criteria set by the legislation.
The alleged advantage of incentive-based regulation is that prices and costs can be
lowered in the long term, even if short-term prices rise (Pérez-Arriaga 2013, 125). This
is illustrated in the graph below (Figure 1).
Figure 1. Cost of service regulation and performance (incentive)-based regulation.
Author’s drawing adopted from Pérez-Arriaga (2013, 152-153)
A classical weak point of cost-of-service regulation (Figure 2) as the method for setting
the rate of return is the so-called Averch-Johnson effect (1962, 1068). A company
allowed a rate of return higher than the true cost of capital has an incentive to over-
invest, giving rise to economic inefficiency. Conversely, if the rate of return is lower
Price = Cost
0
0.5
1
1.5
2
2.5
3
3.5
4
4.5
5
5.5
6
0 0.5 1 1.5 2 2.5 3 3.5 4 4.5 5
Cost
Time
Performance-based regulation
Cost of service regulation
Cost
8
than the cost of capital, the utility will invest very little and its operating costs will rise,
likewise generating economic inefficiencies. Therefore, under traditional regulation,
the utility rates rather motivate utilities (network companies) to overinvest fixed
assets than provide adequate incentives for productivity improvements.
Traditional cost-of-service regulation was originally designed in an era of significantly
increasing sales and decreasing marginal costs, where the primary decisions required
by utilities were related to how much and what type of generation and transmission to
build to meet growing customer demand, and where the main goal was to ensure just
and reasonable rates. The conditions currently facing the utility industry have changed
considerably. (Whited et al 2015, 6)
Figure 2. Allowed revenues under cost-of-service regulation.
Author’s drawing adopted from Pérez-Arriaga (2013, 158).
The traditional regulatory framework is similar to a negative sum game. In cases where
the consumer wins (reduced electricity bill), the company loses in profit, EBITDA or
sales revenues (economic sustainability) in cases where, the company gains a higher
profit, the consumers will have to pay more. Negative changes in the network
company’s financials might have significant impacts to the company’s financial health,
as the investments are made using foreign capital. This, in turn would contribute to the
decline of service quality in the long run.
These issues can be tackled with a well-designed performance-based regulation
includes both incentives and penalties for exceeding or missing the expected
performance (Aggarwal & Burgess 2014, 4). Under a performance-based regulation the
tariffs or revenues the company is authorised to charge or receive are kept in place for
Operating costs
Depreciation
Allowed returns
Others
Allowed costs
Approved capital
investment
Regulated assets
Rate of return
+
−
9
longer intervals (typically 4 or 5 years). This provides an incentive for the company to
lower its costs and be more efficient than under cost-of-service regulation. The resulting
efficiency improvements are considered by the regulator in the following price control,
and therefore the consumers also benefit (Figure 3).
Figure 3. Costs and prices under a performance-based regulation.
Author’s drawing adopted from Pérez-Arriaga (2013, 158).
The two most commonly used methods are price caps and revenue caps, where the
revenues that the company may charge are set for the regulatory period with a formula
that includes a yearly adjustment factor (RPI-X or CPI-X) (Pérez-Arriaga 2013, 165-
169).
Under price caps, any increase in sales leads to higher revenues i.e. costs are assumed
to increase proportionally with sales. Under revenue caps, by contrast, receipts do not
rise in direct proportion to sales, but only in keeping with the selected cost drivers and
in the proportion established.
A variation on rate-of-return regulation often used in combination with both price and
revenue caps is the sliding scale (essentially a mechanism for sharing earnings and
losses). This method provides a mechanism for the utility and consumers to share the
risk of very high earnings or losses. (Pérez-Arriaga 2013, 169)
Choosing the right regulative mechanism is not as straightforward as one might think.
Each country has their unique situation, that has to be taken into account when
designing the regulation. In any case, the framework should be transparent and fair
to ensure the interests of investors. In the following chapter, a short overview of the
Benefit to consumer
(lower prices)
Benefit to firm (higher profit)
0
0.5
1
1.5
2
2.5
3
3.5
4
4.5
0 1 2 3 4 5
Priceorcost
Time
Current price or cost
Expected improvement (RPI-X)
Actual improvement
10
existing electricity network price regulation systems is given. From chapter 1.2.3, the
principles for transitioning to a performance-based price regulation, can be found.
1.2.2. Regulation models used for electricity networks
The dominant approach to regulation in electricity in the EU is one that takes the
Regulatory Asset Base (RAB) as its underlying structure (EY 2013, 7). However, the
methods are highly nuanced (Figure 4). The uptake of performance-based (incentive-
based) regulation in Europe is developing at a slow pace. For example, Norway
introduced incentive regulation with efficiency benchmarking in 1997, while Germany
decided to move forward with a performance-based regulation in 2009 (Nepal & Jamasb
2015, 1).
Figure 4. Regulation of selected power and utilities in Europe.
Grey – cost plus; dark green – incentive-based; light green – combination of models;
blue – revenue/price/income cap. Author’s drawing adopted from EY (2013, 7).
A recent analysis by the European Commission (2015) states, that apart from Great
Britain, current incentive-based regulatory schemes in EU Member States place little
emphasis on characterizing the outputs delivered by the distributor, but for quality
of service schemes in some countries. The distribution activity is currently going
through major changes, which may affect the structure of optimal regulatory schemes.
11
“An investment cycle is being spurred by the need to increase the distribution network’s
capacity to host an expanding fleet of renewable generators.”
Jamasb and Pollilt (2007) have also noted, that
In closing, we note the impact of future innovation on network regulation.
Technological progress has in the past and will continue in the future to transform the
nature and economics of networks. It is therefore very important that any regulatory
framework will provide the right incentives for innovation and adoption of new
technologies in the networks. It is also important that the regulatory system is flexible.
/…/ This implies that European electricity regulators should take into account the power
and long-term effects of incentive schemes in influencing the features and behaviour of
regulated firms. /…/ Regulatory models will therefore need to be reviewed and
evolve constantly to meet the needs of future networks. /…/ A partially
implemented reform can indeed be less desirable than a non-reformed sector.
Moving towards a low-carbon future requires development of smart grids, smart
metering, electro-mobility and storage. Innovation in the power system and electricity
markets does not come without risks. For dealing with the risks arising from the ongoing
energy transition, a proper regulatory framework needs to be in place. According to
Nepal and Jamasb (2013, 194) “The future security, stability and resilience of European
electricity networks are linked to flexible and innovative regulatory mechanisms that
incorporate local, regional, continental as well as international considerations.”
1.2.3. Designing a performance-based price regulation
As stated in the previous chapters, each country has their unique situation, that must be
considered when designing the regulation. In case of electricity network companies,
designing a performance-based price regulation should begin with stakeholder
consultations to define the goals for the electricity system (Table 2).
Table 2. Key principles for designing a performance incentive mechanism
(Whited et al 2015, 57)
Area Key principles
Regulatory context Articulate policy goals
Recognize financial incentives in the existing regulatory system
Design incentives to modify, supplement or balance existing
incentives
Address areas of utility performance that have not been satisfactory
or are not adequately addressed by other incentives
Performance metrics Tie metrics to policy goals
Clearly define metrics
Ensure metrics can be readily quantified using reasonably available
data
12
Area Key principles
Adopt metrics that are reasonably objective and largely independent
of factors beyond utility control
Ensure metrics can be easily interpreted and independently verified
Performance targets Tie targets to regulatory policy goals
Balance costs and benefits
Set realistic targets
Incorporate stakeholder input
Use deadbands to mitigate uncertainty and variability
Use time intervals that allow for long-term, sustainable solutions
Allow targets to evolve
Rewards and penalties Consider the value of symmetrical versus asymmetrical incentives
Ensure that any incentive formula is consistent with desired
outcomes
Ensure a reasonable magnitude for incentives
Tie incentive formula to actions within the control of utilities
Allow incentives to evolve
These goals could fall into a range of categories from cost to environmental
performance. It is important to develop clear methodologies for calculating
performance (or for underperformance) before the new framework is put in place. The
utility needs to have sufficient time to reorient its business (Gimon et al 2013). An
example of the relationships between utilities and the regulator after transitioning to a
performance-based price regulation can be seen from Figure 5.
Figure 5. Conceptual illustration of a performance-based price regulation.
Author’s drawing adopted from Aggarwal & Burgess (2014, 51).
It is important to note that, performance metrics and incentives can be applied in
any regulatory context (incl. in a system, where historically cost-of-service regulation
Retail level:
•reliable service
•customer
satisfaction
•innovative third-
party services
Outcomes
Meet goals
Receive rewards
and/or penalties
Utilities
Set performance
goals
Establish reward
& penalty
structure
Monitor results
Regulators
Wholesale level:
•system-wide least
cost
•reliability
•innovation
13
is used) (Whited et al 2015, 15). In case of the latter, performance metrics and incentives
can be designed to complement the existing regulatory incentives. The steps for
implementation of a performance-based regulation can be found in Figure 6.
Figure 6. Implementation of a performance-based regulation.
Author’s drawing adopted from Whited et al (2015, 5) and Aggarwal & Burgess
(2014, 50).
Additional insights on traditional performance areas and associated performance
metrics can be found in Appendix 1.
1.2.4. Risks of using performance incentives
Similarly to all other regulatory mechanisms, the success of performance a specific
performance incentive is dependent upon its design and implementation. Potential risks
to be avoided or mitigated vary from disproportionate rewards to gaming and
manipulation of the results. The key risks are outlined in Table 3, additional
information can be found from Appendix 2.
1.
2.
3.
4.
5.
Articulate goals - identify and articulate the energy policy goals applicable to
utility regulation (present and future)
Assess current incentives – assess and understand the financial incentives in place
(incl. within the company) under the current or expected regulatory environment.
New performance incentives should be designed to modify, balance or supplement
the existing schemes in place.
Identify performance areas
Establish performance metrics – use performance metrics to monitor the areas
defined in step 3. Analyze the results to identify performance areas that may
require targets.
Establish performance targets – establishing targets will provide for a common
understanding of the performance expected by the regulators. Review and analyze
the results to determine possible rewards or penalties for a performance area.
6.
Establish penalties and rewards (as needed) – establish rewards or penalties to
provide concrete financial incentives for maintaining (or improving) performance.
7.
Evaluate, improve, repeat – creating a performance incentive mechanism is an
iterative process. Targets, financial incentives and other components may need to
be adjusted several times before reaching the optimal solution.
14
Table 3. Potential risks of using performance incentives: mitigation and avoidance
(Whited et al 2015, 53-56; Pérez-Arriaga 2013, 172-173)
Risk Measures for mitigation and avoidance
Disproportionate rewards (or penalties)
Rewards or penalties are too high or based
on factors beyond a utility’s control
Incremental approach, shared savings.
Unintended consequences
Utilizing the performance incentive results
in unintended consequences (e.g. lower
service quality)1
Implementing a diverse and balanced
(comprehensive) set of incentives, focusing on
performance areas that have less
interconnections with other areas (e.g. energy
efficiency).
Regulatory burden
Performance incentive is too costly, time-
consuming for the regulator and other
stakeholders, becoming an unnecessary
distraction
Streamlining the existing processes, simplify
when possible, verify, that the reward or penalty
is proportionate to the goal.
Uncertainty
Metrics, targets and financial
consequences are not clearly defined,
significant and frequent changes to
incentives
Specify the definitions of metrics and targets
before implementation, ask for stakeholder
inputs when necessary, provide examples (case
studies) based on historical data, information
availability, gradual adjustment of incentives.
Gaming and manipulation
Utility takes a shortcut for achieving a
target in a way that was no intended or
deliberately alternates or obscures
unfavourable performance data
Provide clear definitions for the metrics,
monitor effectiveness and adjust when
necessary, incremental approach, simplify.
As can be seen from the table above, in most cases, the potential can be managed
through a well-thought and comprehensive design and implementation of performance
metrics and incentives. Ongoing evaluation of and improvements to the incentive
mechanisms can also be used for mitigating the risks.
1
According to Pérez-Arriaga (2013, 172-173) a weak point of a performance-based regulation is that that
is incentivises the companies to lower costs in operation or investment. This may lead them to do so at
the expense of service quality. For this reason, such regulatory mechanisms should not only regulate
revenues, but should also set other objectives to be met by the company (e.g. service quality). When the
company fails to comply with the established standards, it would be financially penalised (reduction of
allowed revenues), thereby reducing the risk of unintended consequences.
15
1.3. Balanced Scorecard and Strategy Maps
1.3.1. Strategy and the Balanced Scorecard
As stated in chapter 1.2.3, when implementing a performance-based price regulation,
the utility needs to time to reorient its business and thereby strategy. “An organisations
strategy describes how it intends to create value for its shareholders, customers and
citizens” (Kaplan & Norton 2004, 4).
One of the goals of this thesis is to describe the impacts of transitioning to a
performance-based price regulation to the Estonian electricity network companies. For
describing the impacts, the author could choose from a myriad of management tools
available for describing an organisation’s strategy and provide for its successful
implementation.
As stated in chapter 1.2.4, the performance-based price regulation should be well-
designed and comprehensive (i.e. targeting several aspects of the business). Therefore,
a comprehensive approach to changing the company’s strategy is also needed. The
author of this thesis decided to use the Balanced Scorecard (BSC), more specifically the
Strategy Maps framework developed by Kaplan and Norton (2004).
This was done because, the BSC is not only a tool for recording and illustrating a small
number of key performance indicators (Mackay 2005, 4), it also offers a framework for
describing strategies for creating value by focusing on four perspectives (Figure 7).
“These four perspectives link together in a chain of cause-and-effect relationships.
Enhancing and aligning tangible assets leads to improved process performance, which,
in turn, drives success for customers and shareholders” (Kaplan & Norton 2004, 4).
What is more, BCS is widely used as a management tool. According to Bain &
Company (2015), the Balanced Scorecard was the 5th
most used management tool in
2015. The Scorecard also facilitates many principles within ISO 90001 (Rusjan & Alic
2010) and is suitable for both the public sector and private sector entities (Kaplan &
Norton 2004, 7). The Balanced Scorecard approach has also been successfully used by
several electric utilities (Niven 1999; Neely et al. 2006; PowerStream 2014; Nampower
2014; Precorp 2017), including National Grid plc (AMEC 2012), which has been
subject to an incentive regulation since the beginning of 1990s (Weyman-Jones 1990).
16
Figure 7. The Balanced Scorecard Framework.
Author’s drawing adopted from Mackay (2005, 11).
In essence, a Balanced Scorecard defines what management means by "performance"
and measures whether the desired results are being achieved. Using the Balanced
Scorecard, the company’s Mission and Vision Statements are translated into a
comprehensive set of objectives and performance measures that can be quantified and
appraised.
1.3.2. Limitations and critique
Not all experts show their support towards the Balanced Scorecard. For example, Jensen
(2002), contends, that the approach does not give managers a single-valued measure of
how they have performed. According to him, the organisation (and its divisions) should
“define a true score for measuring performance”. This will enhance their contribution
to the firm.
According to Norreklit (2000, 82), there is not a causal but rather a logical relationship
among the areas four perspectives of the BCS.
Customer satisfaction does not necessarily yield good financial results. Assessing the
financial consequences of increased customer satisfaction or quality improvements
requires a financial calculus. Chains of action which yield a high level of customer
value at low costs lead to good financial results. /…/ Therefore, the balanced scorecard
makes invalid assumptions, which may lead to the anticipation of performance
Internal View
External View
Developmentfocus
Activitiesfocus
Learning & Growth
Objectives and performance
measures associated with the
development of enabling
culture and competences
Financial
Objectives and performance
measures associated with the
shareholders’ perception and
expectation of the organisation
Internal Business Processes
Objectives and performance
measures associated with the
organization's internal
productive processes
Customer
Objectives and performance
measures associated with the
customers’ perception od an
interaction with the
organisation
17
indicators which are faulty, resulting in sub-optimal performance. /…/ We therefore
conclude that the balanced scorecard needs to be adjusted and developed.
Casey and Peck (2004, 5) went even further to state that in companies with many
different divisions, the individual divisions can often develop tunnel vision. They may
achieve their own success at the expense of others or the organization unintentionally.
In practice, many companies end up in a cycle, where they think the measures are the
big and vital part of the BSC. In real business processes, too many measures will
confuse people, and it won’t even be used as part of day-to-day business management.
Palmer and Parker (2001, 993) suggest that a key factor in developing a successful
Balanced Scorecard is the identification of aggregate level measures. Rather than
having accurate product costing as the focus, organisations can make large gains by
identifying and focusing on one or two critical input drivers.
Nevertheless, these obstacles can be overcome and have been overcome by many
companies.
1.3.3. Strategy Maps
As can be seen from chapter 1.3.2, the Balanced Scorecard by itself may not be
sufficient, as it does not describe the cause-and-effect linkages among the four BSC
perspectives. For this reason, Kaplan & Norton (2004) developed the Strategy Map
(Figure 8). “…a strategy map provides a uniform and consistent way to describe a
strategy, so that objectives and measures can be established and managed”.
In essence, a Strategy Map is a communication tool, that is used to tell a story, how
value is created (Kaplan & Norton 2004, 9). The Strategy Map is based on several
principles (ibid, 10):
1. Strategy balances contradictory forces – short term results (cost cutting) may
not translate into profitable revenue growth in the long-term.
2. Strategy is based on differentiated customer value proposition – the source of
sustainable value creation is satisfying customers.
3. Value is created through internal business processes – internal processes
determine how the organisation will implement its strategy and sustain value
creation.
18
4. The value of intangible assets is determined by strategic alignment – the value
of intangible assets (human, information and organisation capital) is derived
from their ability to help the organisation implement its strategy.
Figure 8. An example Strategy Map and its connections to the Balanced Scorecard
Author’s drawing adopted from Kaplan & Norton (2004).
In essence, a Strategy Map shows a logical step-by-step connection between the
organisation’s strategic objectives, its internal processes and tangible and
intangible assets. The Map is built upon the BSC framework, linking together all of
the four perspectives (learning and growth, internal, customer, financial). For instance,
improving performance in the Learning and Growth perspective, enables the
organisation to improve its Internal Processes. This, in turn, enables the company to
create desirable results in the Customer and Financial perspectives.
Customer Value Proposition
Productivity Strategy
Operations Management
Processes
Supply
Production
Distribution
Risk Management
Customer Management
Processes
Selection
Acquisition
Retention
Growth
Innovative Processes
Opportunity Identification
R&D Portfolio
Design / Develop
Launch
Regulatory and Social
Processes
Environment
Safety and Health
Employment
Community
Human Capital
Information Capital
Organisational Capital
Product / Service Attributes
Long-Term
Shareholder Value
Improve Cost
Structure
Increase Asset
Utilisation
Expand Revenue
Opportunities
Enhance Customer
Value
Growth Strategy
Relationship Image
Price Function Service Partnership BrandQuality Availability Selection
Culture Leadership Alignment Teamwork
Financial
Perspective
Customer
Perspective
Internal
Perspective
Learning &
Growth
Perspective
19
2. RESEARCH METHODOLOGY
2.1. Research design
The selection of research design is based on research strategies, research choices and
time horizons (Saunders et al. 2009, 136). It is important to apply a strategy, that enables
the author to answer the research questions and achieve the aim of the research.
The aim of the thesis will be achieved by answering the following questions:
1. Whether and how should the current price regulation be improved to foster
an Estonian electricity network company’s economic sustainability?
2. What should a performance-based price regulation framework look like in
Estonia?
3. What would an electricity network company’s Strategy Map look like after
transitioning to a performance-based price regulation?
Case study research methodology was chosen to answer the research questions defined
above. According to Yin (2014, 4) using case study method is relevant, when the
research when answering the research questions requires an extensive and in-depth
description of some social phenomenon. Saunders et al. (2009, 146) further elaborate,
that case study strategy helps to generate answers to questions “why?”, “how?” and
“what?”.
Yin (1993, 13) defines the case study method as “an empirical inquiry that investigates
a contemporary phenomenon within its real-life context, especially when the boundaries
between phenomenon and context are not clearly evident”. A case study can be based
on real or hypothetical cases (Gerring 2006, 153; 160).
Working examples of using a performance-based (incentivising) price regulation are
available, but not widely spread as the area is still evolving. This means, that for
answering the research questions described above, both primary and secondary data are
20
needed. Conducting a case study research involves using multiple sources of evidence
(Robson 2002, 178).
The aim of a case study research can be describing, understanding, predicting and
controlling (Woodside 2010, 1). In this thesis, the:
1) the possibilities of transitioning from the current price regulation framework to
a performance-based price regulation are described;
2) the impacts of the transition to the network companies are understood and
predicted.
Performance-based price regulation has so far not been used in Estonia, traditional, fully
tested and working regulation model (cost of service regulation) is used instead.
Transitioning to a completely new regulation framework will need a thorough analysis
and assessment of impacts. Therefore, this research will need to provide the basis of
further research and analyses needed to be done before implementing a
performance-based price regulation. Therefore, an exploratory single-case case study
method is used. The purpose of an exploratory case study research is “to identify the
research questions of procedures to be used in a subsequent research study, which might
or might not be a case study” (Yin 2014, 238).
The object of the research is the price regulation of Estonian electricity network
companies. The case analysed was hypothetical. The research was structured into three
stages:
1. Compilation of a performance-based price regulation framework for Estonia
based on literature review and semi-structured interviews.
2. Conducting semi-structured interviews with senior-level managers of Estonian
electricity network companies to:
a. get feedback on the proposed framework;
b. get insights on how the company is currently managed and what would
need to change under the new framework.
3. Compilation of a strategy maps.
During the first stage the author used secondary resources, including both research
papers and non-scientific material available in the internet to get insights on the
performance-based price regulation frameworks currently in use. The information
21
gathered was summarised and presented to the interviewees for discussion (second
stage). In the final phase of the research, the author analysed the data and identified the
most important themes to find answers to the research questions. The goal of the case
study research was to gain a rich understanding of the context of the research and not
to report facts.
The interviews (excluding the interview with the employees of United Kingdom’s
energy regulator - OFGEM) were conducted in Estonian to minimise the risk of the
interviewees altering their expression due to language limitations. As this paper was
compiled in English, the direct quotes presented have been translated into English by
the author. While translating, the author made sure not to change the style of the
interviewees.
2.2. Background of the analysed case
2.2.1. Electricity market in Estonia
According to Elering AS (2017) the electricity production in Estonia in 2016 amounted
to 10,4 TWh (á 15% vs 2015). The imports were 3,40 TWh (â 35% vs 2015) and
exports 5,32 TWh (â 12% vs 2015). Electricity consumption in Estonia (incl.
transmission and distribution losses) was 8,38 TWh (á 3% vs 2015). In total, there are
0,73 million consumption points (Konkurentsiamet 2016a) in Estonia.
Figure 9. A conceptual illustration of electricity sector price regulation in Estonia
Author’s drawing adopted from Pérez-Arriaga (2013, 137).
Generation
(competitive)
Transmission
(regulated)
Distribution
(regulated)
Retailing
(competitive)
G1 G2 Gi
C1 C2 Cz
Transmission
D1 DjD2
...
...
...
22
Until recent years, for Estonian electricity consumers, both the cost of electrical energy
and network fees, was determined in a regulated market. As electricity production and
supply is an ordinary monopoly instead of a natural monopoly, the liberalisation of this
sector was possible. Estonian electricity market was fully liberalised (opened to
competition) in 01.01.2013 (Majandus- ja kommunikatsiooniministeerium 2017)
(Figure 9).
There is one transmission service operator (TSO) in Estonia – Elering AS. The number
of Distribution service operators (DSOs) amounts to 34. The largest of them -
Elektrilevi OÜ has a market share of 86% (Konkurentsiamet 2016b) (Table 1).
Table 4. Electricity network operators in Estonia in 2015
(Elering AS 2016; Elektrilevi OÜ 2016; VKG Elektrivõrgud OÜ 2016; Imatra Elekter
AS 2016; Konkurentsiamet 2016a). Author’s calculations.
Parameter
Elering
AS
Elektrilevi
OÜ
VKG
Elektrivõrgud
OÜ
Imatra
Elekter
AS
Number of consumption points, 1000 pcs 0.233 660.6 36.6 25.1
Length of electric lines, 1000 km 5.50 60.50 - 3.03
Distribution or transmission service sales,
TWh
7.47 6.52 0.20 0.21
Property, plant and equipment and
intangible assets, million €
768.6 897.0 28.4 22.7
Sales revenue, million € 127 248.4 12.1 15.2
incl. sales revenue from distribution or
transmission services), million €
85.8 237.4 7.74 9.48
EBITDA, million € 78.6 106.8 3.4 3.1
Net profit, million € 25.1 49.5 1.4 1.57
Investments, million € 93.1 93.3 0.63 2.1
Dividends, million € 20 22.4 1.2 0.6
Average price of network service
(without VAT), €/MWh
11.5 36.4 38.0 46.2
Interruptions caused by faults (2011-
2015), 1000 pcs
0.04 967.9 24.4 11.7
Interruptions caused by faults due to force
majeure (2011-2015), 1000 pcs
0.00 175.0 0.4 2.6
Average outage duration for each
customer served (SAIDI) (2011-2015), h
0.8 2.5 0.4 0.9
According to the Estonian Competition Authority (Konkurentsiamet 2016b) the average
transmission tariff in 2015 remained unchanged compared to 2014 at 11,8 €/MWh
(without VAT). The same applies to the average distribution tariff that amounted to
51,3 €/MWh (without VAT). The average price of electrical energy in 2015 was 31,08
€/MWh (â21% vs 2014). Thereby, the average price of electricity consumption (incl
23
taxes and levies by the government, electricity network tariffs and the price of electrical
energy) was 117,3 €/MWh.
The quality requirements for network services are established by the regulation
“Võrguteenuste kvaliteedinõuded ja võrgutasude vähendamise tingimused
kvaliteedinõuete rikkumise korral” (Majandus- ja kommunikatsiooniminister 2016).
This regulation obliges the network service operator to keep statistics on every network
service interruption occurred. Under extreme weather conditions, the maximum service
interruption can be 72 hours, under normal conditions, the service has to be resumed
during 12…16 hours.
2.2.2. Electricity network price regulation in Estonia
The principles of monopoly regulation in general have been set in the Competition Act
(Riigikogu 2015). The specific provisions for the electricity sector are described in the
Electricity Market Act. According to the Electricity Market Act, the electricity supply
is to be provided at a reasonable price, while meeting environmental requirements, the
needs of consumers, and the utilisation of energy sources in a balanced manner. This
has to be done in an environmentally clean way and ensuring a long-term perspective.
What is more, the electricity undertakings (including electricity network operators)
shall facilitate activities performed by consumers for the purpose of conserving
electricity.
According to the Electricity Market Act (§71 – 73) (Riigikogu 2017), the DSO has the
right to establish different distribution tariffs (e.g. based on voltage level). The cost
level of the tariffs is validated by the DSO-s proposal for network charges to the
regulator (Estonian Competition Authority). So, rather than approving the different
tariffs, the regulator approves the network charges to be collected in the DSO-s network.
The components included in the total network charge calculation are (Konkurentsiamet
2014, 6):
1. Capital expenditure (depreciation of the Regulated Asset Base (RAB))2
2
RAB (also Regulatory Asset Base) is a number which represents past investments, comprising what
investors paid when the assets were originally privatised plus subsequent capital expenditure adjusted for
depreciation. Not all of the network operator’s investments are included in the Regulated Asset Base.
Some in (e.g. investments already paid for by the consumer, assets which the undertaking is not actually
using for the provision of network services etc).
24
2. Variable costs
a. Cost of losses
b. Cost of transmission (TSO tariff)
3. Operating Costs
4. Justified return (WACC Ï RAB3
)
A sample of a calculation of the allowed revenue of the DSO and the average price of
distribution service can be found from Table 5.
Table 5. Sample calculation of the allowed revenue of the DSO
(Konkurentsiamet 2014, 7). Author’s calculations.
Component Unit Value
Variable costs (VC) million € 100
Operating costs (OC) million € 45
Capital expenditure (C) million € 45
Justified return (JR = WACC Ï RAB) million € 55
Allowed revenue (R = VC + OC + C + JR) million € 245
Sales volume (S) TWh 6.5
Average price of distribution service (P = R/S) €/MWh 37.7
The average price of network service has, in nominal terms risen for both the three
largest DSO’s and the TSO (Figure 10). However, in real terms (adjusted for inflation),
the average price of distribution service in Estonia in 2015 was at the same level as in
2006 (Figure 11). This means, that the inflation has risen faster than the network prices.
Meanwhile, the network companies have made significant investments into improving
the reliability of the service.
3
Allowed income for the DSO. WACC = weighted average cost of capital
25
Figure 10. Average prices of network service operators in Estonia 2006 – 2015
(Elering AS 2016; Elektrilevi OÜ 2016; VKG Elektrivõrgud OÜ 2016; Imatra Elekter
AS 2016). Author’s calculations.
Figure 11. Average price of network service in Estonia 2006 – 2015
(Elering AS 2016; Elektrilevi OÜ 2016; VKG Elektrivõrgud OÜ 2016; Imatra Elekter
AS 2016). Author’s calculations.
There is no regulatory period set – both the regulated entities themselves or the
Konkurentsiamet can start the process for reviewing the network charges at any given
time.
Although the preambles of the Electricity Market Act state several objectives to be
followed by the electricity undertakings (incl. network operators), the Act does not
0.0
10.0
20.0
30.0
40.0
50.0
2006 2008 2010 2012 2014
Costofnetworkservice,€/MWh
Elering AS Elektrilevi OÜ
VKG Elektrivõrgud OÜ Imatra Elekter AS
0.0
10.0
20.0
30.0
40.0
50.0
2006 2008 2010 2012 2014
Costofnetworkservice,€/MWh
Average distribution service price (nominal prices)
Average distribution service price (real prices in €2015)
26
state, how these tasks should be taken into account in the price regulation
methodology.
This is reflected in the results of the price regulation assessment compiled by the
Estonian Competition Authority, where it was stated that the price regulation during the
period 2005…2014 has been successful, since the price stability for the consumers has
been ensured and the regulated companies have not earned excessive profits
(Konkurentsiamet 2015, 22).
In addition to the price for the consumers and company’s profits, the analysis also
mentions two indicators that the ECA closely monitors – the losses in the distribution
network and quality of supply. These aspects, however are not included in the price
regulation methodology (Konkurentsiamet 2014). In 2014 a 58% reduction in
distribution service losses (586 GWh) had been achieved compared to 2005. The quality
of electricity supply is stated to have been significantly improved under normal
conditions. The electricity system is still vulnerable to extreme weather conditions.
Konkurensiamet (2015, 22) assesses the potential for improving quality of supply low
as further improvement would under the existing framework result in a significant
increase of the network service costs for the consumer.
2.3. Sampling and the respondent group
The author decided to use purposive sampling. In exploratory research, it is not
necessary to have a representative sample set, because the goal of the research is not to
verify any hypotheses or to make any statistical conclusions.
The size of the sample set depends on the circumstances and research goals (Baker and
Edwards 2012). Data collection can conclude at the point where theoretical saturation
is achieved, meaning that no additional data are being found (Goulding 2003, 69-70).
Previous research suggests that around 12 interviews can provide relevant data (Guest
at al. 2006, 74).
The interviewees (i.e. respondent group) were chose as a non-random sampling of the
members of the boards or senior-level managers of Estonian largest electricity network
operators. The respondents from Elering AS (transmission network operator) and the
27
three largest distribution network operators (Elektrilevi OÜ, Imatra Elekter AS and
VKG Elektrivõrgud OÜ) were contacted directly by the author. The interviewees (12
in total) are listed in Appendix 3.
In the study, no specific response is identified by name. Excerpts from the interviews
have been anonymised by using abbreviations (i.e. I1, I2, …, I12 etc). This was done to
reduce self-censorship during the interview. In some cases, using abbreviations was
omitted in order to reduce the possibilities of identifying the respondents indirectly.
The 12 interviewees have had 3…20+ years (as of Q2 2017) of experience in the
Estonian electricity network companies. None of the interviewed people was younger
than 30. The distribution companies, whose members of the boards were interviewed,
represented >90% of the electricity distribution service sales in Estonia.
2.4. Data collection
The study was based on the primary data collected from the management of the four
largest Estonian electricity network companies (semi-structured interviews) and on
secondary sources on the available on price regulation and on the network companies
themselves. The main sources the author used for secondary data were official
webpages of the electricity network companies and energy regulators. The secondary
data analysis process was done manually and began with identifying the documented
manuscripts on the topic. The information was gathered by scanning for direct quotes,
keywords and related issues associated with identified and stated questions.
Semi-structured interviews were conducted after the initial literature review. For that,
the author prepared 20 questions divided into five categories. This was done based on
the literature review (see chapter 1) and author’s own previous experience in the field.
The questions can be found in Appendix 4. Data analysis started right after the first
interview, which helped to improve the questions for the following interviews. During
the first two interviews, the author realised, that it is reasonable and sufficient to cover
5…8 questions per interviewee and focus on the follow-up questions to uncover
additional information. The gaps in the information were filled using the public records
of the company or the answers of other interviewees from the company.
28
The five categories are presented as follows:
1. The proposed price regulation model and its improvement – the
interviewees were presented with a comparison (see Appendix 4) of the current
and proposed price regulation framework and asked for their insights
2. Financial perspective – What are the current expectations of the shareholders
of their company? What would need to change under the proposed framework?
3. Customer perspective – What are the current expectations of the customers of
the company? What would need to change under the proposed framework?
4. Internal Processes perspective – How would the internal processes need to be
changed under the new framework?
5. Learning & Growth perspective – How would the company’s employees have
to evolve in order to successfully implement the proposed framework.
The use of questionnaires was not considered useful for this thesis, as the goal of the
research was not to come up with statistical conclusions. Interviews are considered to
be one of the most important sources of a case study research and are more commonly
used in case study research than surveys (Yin 2014, 110).
2.5. Data analysis
Goulding (2002, 110) suggests that transcribing is time-consuming and not always
necessary. Hence, the author recorded the interviews to be able to re-listen to them while
coding, but the interviews were not transcribed. The initial codes were picked based on
the themes emerged from the interviews and based on the author’s professional
experience. The next step was to use axial coding, which helped to investigate the
relations in the data and uncover the main themes.
As described in § 2.3, the first part of the interview was a discussion on the current price
regulation and the possible performance-based price regulation framework. The second
part of the interview was focused on getting insights on how the company is currently
managed and what would need to change under the new framework.
The conversations were wide-ranging as different interviewees went into different level
of detail and ambiguousness. The level of detail and focus of the conversations also
29
depended on the most crucial topics that the management was dealing at the time of the
interview.
The data collected during the interviews was coded. The content of the codes varied
from specific suggestions to abstract keywords and concepts. The codes were
categorised into 3 main categories and into 8 sub-categories:
A. Price regulation framework, incl.:
1) Existing price-regulation framework;
2) Potential performance-based price regulation framework.
B. Network company’s management, incl.:
1) Financial aspects;
2) Customer expectations;
3) Internal aspects;
4) Learning and growth.
C. Further observations, incl.:
1) The future of the network companies;
2) Other observations.
Once the data collection and coding was completed, the codes were sorted and reviewed
once again. Memos played an important part in this case study research as they provided
a bank of ideas that could be revisited. Miscellaneous thoughts and observations that
came up during the process, were written down as notes and grouped into categories.
For each memo, it was also added where the idea or observation came from.
After that the author was ready to summarize the results of the research, including
writing answers to the research questions.
2.6. Research limitations
Due to the restrictions placed upon a Master’s Thesis, no claim is presented in relation
to achieving a substantive representation of the subject.
Case study research is argued to be subjective to researcher’s preconceived viewpoints
(bias toward verification) and thereby reliability and validity (Flyvbjerg 2006, 221).
According to Yin (2014, 15) scientific generalisation of case studies is limited due to
30
sample size. Multiple causation (different variables can contribute to the behaviour or
phenomenon that is observed) has also been reported as a disadvantage of utilizing the
case study research method (Ragin 1987, 45). These limitations, however are not
sufficient for not choosing (or choosing) a case study research design. Regardless of the
limitations outlined, case study is a necessary and sufficient method for research tasks
in the social sciences (Flyvbjerg 2006, 241).
As the interviewees were mostly recruited by chain sampling, the research is subject to
biased respondents. However, as the respondents were representative of the target group
(senior-level management of Estonian electricity networks), this fact is not of
substantial significance to the results of the research. The aim of the research was to
chart their views and not to attain universality.
One of the key limitations is the large part the interviewer plays in the dialogue. There
is a significant risk in limiting the interviewee to answering questions without reflecting
or developing the ideas. It was sought to minimise this shortcoming by structuring the
interview into blocks using the perspectives of Balanced Scorecard developed by
Kaplan & Norton (2004) (see § 2.4 for additional information). Another constraint was
time, as the interview was usually scheduled to last not more than one hour.
This exploratory research is also limited by time. The thesis focuses on describing the
impacts of transitioning to a performance-based price regulation to the electricity
network companies through the Strategy Maps framework. Whether it would be
reasonable to transition from a cost-of-service regulation to a performance-based
regulation, was not thoroughly analysed in this thesis. Performing a more in-depth
investigation is outside the scope of this thesis, but it can be done in further research,
based on the findings in this thesis.
The research was focused on management challenges and opportunities of the
electricity network companies related to transitioning to a performance-based price
regulation. Technology-related challenges and challenges within the operational level
of the regulator were not thoroughly analysed. The level of likelihood of the proposed
changes and its socio-economic impacts were also not analysed.
31
3. RESULTS AND DISCUSSION
3.1. Price regulation framework in Estonia
3.1.1. Existing price-regulation framework
Several interviewees (I3 and I6) pointed out, that the current regulatory framework has
a low administrative burden and is simple to follow. However, several issues with the
implementation of the framework were pointed out.
I3 went even further to state, the current regulation system only has a few issues that
need to be solved. These issues are income tax component of the WACC and the
calculation of RAB and depreciation of the existing assets of the company (esp.
intangible assets). The negative impacts of the decision made in mid-2000’s by
Konkurentsiamet regarding the Regulatory Asset Base of the network companies were
also noted by I6 and I8. According to the decision, a portion of the assets owned by the
network companies will be taken out of RAB during 2017-2019. This is done to reduce
the risk of overcompensation by the consumers. A solution was offered by I3, who
stated that changes similar to the changes made to the Natural Gas Act (Riigikogu 2012)
could be made to resolve the issue.
The current calculation methodology of WACC does not factor in the 20% income tax
rate (Konkurentsiamet 2013, 13). This justified by the peculiarities of the Estonian tax
system4
(Sander 2014, 3). I4 noted, that this approach has been disputed by a study
commissioned by the market participants (EY 2014, 22-23). The latter study also
pointed out other aspects in the WACC calculations that could have a different
approach.
The regulator should not be granted both the right for establishing a price regulation
methodology and the right to supervise and control the implementation of the
methodology. In essence, the regulator should not be able to subjectively say whether
4
In Estonia a unique system for corporate earnings taxation is used, which shifts the moment of taxation
from the moment of earning the profits to the moment of their distribution (Estonian Tax and Customs
Board 2016).
32
a company has been good or bad. /…/ Their decisions must be based on objective
estimations. (I4)
A similar statement was made by I9. The current legislative environment (Riigikogu
2017) does not specifically describe the price regulation methodology. The task of
development of the methodology has fallen to the regulator (Konkurentsiamet), who
also has to conduct supervision over the compliance with the Electricity Market Act
(incl. price regulation). According to I9, this allows a rather creative approach to the
price regulation by the Konkurentsiamet.
Regarding the specific components of the calculation of WACC I8, I7 and I4 noted, that
the network companies in Estonia are different in size, but nevertheless, similar
components (incl. cost of debt) is used. This causes problems for smaller distribution
networks, whose size and revenues do not allow to get the best market rates.
I1 noted, that under the current system, keeping the current level of expenses is the
easiest solution, rising the expenses is difficult and the negotiations with
Konkurentsiamet are time-consuming. According to I2 and I12, the introduction of new
expenses (e.g. R&D) is difficult and that the current system incentivises investment
into assets rather than innovation. I2 and I12 also noted, that the innovation activities
currently in progress, are conducted in conjunction with the company’s vision and
mission statements rather than an incentivising regulation. However, I3 pointed out that
it is reasonable for Konkurentsiamet to expect the company to start making the expenses
before they are included in the allowed revenues.
Making investments is more profitable to the company than saving on operating
expenses (CAPEX vs OPEX trade-off). As the regulation is set currently, the regulator
can, at any time start the process to renegotiate the network charges. Thereby reducing
operating expenses is not incentivised. /…/ The current regulatory system’s main focus
is on the consumer. More precisely keeping their costs down in the short term. As
investment euros are cheap, the owners’ focus is on investing into assets rather than
looking at the future and finding innovative solutions that will reduce the costs for the
consumers in the future is not incentivised. (I12)
The price regulation currently in use for the electricity network companies was adopted
in 2003 (Uukkivi et al. 2014, 228). By now, the range tasks of network companies have
widened, while the regulation framework has remained widely the same.
When the methodology was established, the network operators had less obligations. For
example, the electricity excise tax and renewable energy fee had not been imposed yet.
Now, the network company has an additional function – “tax collector”. This means
33
additional risks and obligations for the company as the state taxes have to be paid first.
However, currently the amount of the taxes and fees collected is not a part of the
allowed revenues calculation. (I8)
“The current system allows for a low administrative burden from the perspective
of the state, but does not take into consideration the possible social costs and
benefits” (I9).
I12 noted, that in a business, you get what you measure. And the current regulation is
set up in a way that, in substance, the electric utility is measured and rewarded by the
amount of assets owned. In order to tackle the future challenges ahead (e.g. more
renewables in the system, declining electricity consumption), a more incentivising
regulation is needed.
3.1.2. Potential performance-based price regulation framework
The possible introduction of performance incentives for specific performance areas
sparked interest in many of the interviewees. The discussion on specific performance
areas was conducted based on the interviewees interest. I1, I6, I7 and I9 pointed out,
that service quality should be a specific performance indicator.
Several of the respondents adopted a cautious attitude towards the potential rewards or
penalties. As can be seen from § 3.2.1, the upper management would rather see the
issues with the existing regulation solved rather than adopting a completely new and
unknown type of regulation.
The performance-based regulation seems to use reverse logic. The higher your quality
of service is, the more profits the company gets. When the profits are higher, the
company can invest more. Meanwhile, the company with low service quality for
historical reasons will not have the money to invest. So the strong will become stronger
and the weak will become even weaker. (I3)
A somewhat similar statement was also made by I9, who stated, that under the current
system, the investors find underperforming companies most valuable, as these
companies offer possibilities for high returns for invested capital. For companies
nearing the efficiency limits, a new system would be better as it creates new revenue
streams.
I1, I4 and I8 noted that the customer satisfaction is difficult to measure would need a
specific methodology for each company. According to one of the respondents, their
34
company has successfully measured customer satisfaction for years and the results
are used to actively measure the effectiveness of the company’s internal
procedures.
According to I1, the customer’s main concerns with connecting to the grid lie with the
duration and the cost of the process. I3, I4 and I5 noted that there is not much that can
be done to lower the cost of connecting the customer to the grid due to the limitations
arising from the Public Procurement Act and the Electricity Market Act (connection
costs are not socialised). I1 said: “Everything can be done faster, but this means that
additional resources will have to be spent. Under the current system the operating
expenses are too inflexible to facilitate faster connection times.”
I2 was positive towards having an incentive for facilitating active consumers (e.g.
demand-response) and increasing system efficiency (e.g. increasing the load factor). I3
noted, that not all network companies can “activate” their consumers. I7 stated that
having a smoother load curve would benefit the company.
I12 and I2 also noted the need for an incentive for grid innovation. According to I12
both the electric utility and society as a whole (e.g. lower prices in the long-run) would
benefit from having a specific price component for innovation activities. This would
enable the company to learn and anticipate changes rather than only react to changes
that are already happening.
Many of the interviewees pointed that performance-based price regulation would
require a specific methodology for each of the performance areas agreed upon
beforehand would be needed. This coincides with the suggestions in the literature (see
§ 1.2.3 and 1.2.4 for further details).
While making comparisons and while benchmarking, we should look at countries with
similar economies and development levels to us (e.g. Bulgaria, Romania, Latvia,
Lithuania) rather than the Nordics. This is especially true in the case of electricity
networks. (I4)
According to I3, transitioning to a performance-based regulation makes sense only
when the benefits outweigh the costs. This is especially relevant to smaller network
companies.
For a smaller network company there should be base levels set for basic expenses (e.g.
based on €/km of power line or €/consumer (I8) /…/ For a smaller network company, it
35
might be useful to allow using so called “reference tariff”. If the company’s tariffs are
lower than the set fixed tariff, the company would not have to though the time-consuming
approval process. (I6)
A system similar to this is proposed for the new price regulation framework of district
heating (Riigikogu 2016). I4 also stated, that a new system would need to bring more
flexibility to the company and leave less room for interpretations for the
Konkurentsiamet. I9 pointed out the necessity for increasing Konkurentsiamet’s
funding if such a performance-based price regulation is to be implemented. A
similar comment was made by I1, who stated that under a new regulation, there would
be significantly more communication and cooperation with the regulation. This aspect
was also mentioned by I12. This means that there would have to be capacity building
within the regulator as well. This is supported by OFGEM’s experience, where over
450 employees deal with regulatory issues, experience. The UK’s energy regulator is
funded by the licencing fees collected from the regulated entities.
I12 stated, that the price regulation should coincide with the long-term vision of the
energy system. For example, if we wanted foreign investors to invest into Estonian
electric utilities, the regulation should be made similar to existing widely-used and
known price regulations. Estonia’s market is too small for outside investors to start
learning our specificities.
3.2. Network company’s management
3.2.1. Financial aspects
The interviewees explained that the main expectation of the owners (or shareholders)
of the company is for the company to make a profit. More specifically, for the
company to pay dividends. In addition, for one company, the owners expected the
company’s activities to contribute to the competitiveness of the economy. I6 and I4
noted, that with existing price regulation, the expectations of the owner are difficult to
fulfil.
Several performance indicators were also mentioned: ROE (I3); net profits (I4; I6);
EBITDA; ROIC; net cash flow (I8) and economic value added (EVA) (I12; I3).
According to I3, the expectations of the shareholders would not significantly change if
a new regulation framework would be implemented. However, I12 stated, that when
36
transitioning to a performance-based price regulation, EVA would start to play a more
important role for the owners.
3.2.2. Customer expectations
As the interviewees were from both distribution companies and the transmission
company, the definition of customer varied. In general, the network company serves the
following customer types:
a) household consumer;
b) business consumer;
c) distribution service operator;
d) generator.
“The customer’s three main expectations (in order of importance) are: 1) security
of supply; 2) quality of supply; 3) price of the network service” (I6). I9 noted that
the customers want the communications between the network company and them to be
efficient and fast.
Customer satisfaction is actively measured in only one of the companies. Three
different customer segments are covered: household consumers, business consumers
and industrial consumers. Feedback is asked for the following aspects:
a) fault repair times and procedure;
b) quality of electricity supply;
c) user comfort in using the company’s web services;
d) competence of the company’s employees;
e) workflow of new contracts.
3.2.3. Internal aspects
All of the companies have different internal processes management systems in place.
One company uses Workplan (Tööplaan in Estonian), with three levels of tasks:
I. Tasks from the Supervisory Board to the Management.
II. Tasks from the Management to middle-management.
III. Tasks set within the departments.
37
In the beginning of each year, yearly goals will be set for each of the levels. The progress
will then be monitored using the Workplan.
I3 was sceptical about the possibilities of using a Balanced Scorecard approach to
manage an electric utility. “Under the existing framework, the profit of the company
depends more on the amount of RAB rather than the performance of a single employee.”
However, one interviewee brought out that in their company, BCS has been
successfully used for years. In addition to a comprehensive system for rewarding
performance, there are spill over effects to the partners (outsourcers) of the utility, who
also get rewarded for performance (e.g. customer relations). “With our outsourcers
leaving a good impression to our customers, our reputation will improve as well”.
Only when profits, customer and employee satisfaction are ensured, one has
created a sustainable business. The success of a company is dependent on the leader’s
ability to set an example. /…/ Employees must be given freedom to think and act. They
must be trusted and guided by setting goals. If the goals are not met, the first thing to
do is to check whether they need help or empowerment. (I9)
The importance for employee empowerment was also emphasised by I4, who described
the process of solving a difficult problem for the company. When at first, the existing
team failed to solve the problem, the management empowered the existing team with
new workforce, external consulting and financial rewards.
In general, the interviewees did not see the need for major changes in their management
systems. If a performance-based price regulation would be implemented, the new
performance areas would be able to be integrated to the existing systems. I12 noted,
that transitioning to a performance-based price regulation would stimulate the
electricity network companies to work more like a traditional business, where the
profits are tightly connected with the activities of every department. This would
contribute to the introduction of new key performance indicators (KPI’s) (e.g.
maintenance cost / km of electricity network; maintenance cost / transformer)5
. What is
with relevant incentives, overall effectiveness of the company should increase as well
as increasing effectiveness would be rewarded rather than penalized as with the current
system.
5
These KPI’s were also mentioned by I8.
38
3.2.4. Learning and growth
Under learning and growth it was brought out that the average age of employees in the
network companies is relatively high. Some of the positions even require up to a year’s
worth of training (I7).
All of the companies have a separate budget for training the employees. “We have
always found funds for training our staff, even during more difficult times” (I4).
However, it was noted that can be difficult to find the right training. This obstacle is
being tried to overcome via cooperation with universities and speciality
organisations (I5, I7, I9).
I2 and I3 also noted the growing need for IT-related competences. Even if the employee
him or herself does not engage in programming activities, it is important that they have
the relevant basic knowledge. Only when the future user and programmer work
together, will the end result be effective. The growing need for effective communication
with customers was also brought out.
No specific metrics for learning and growth were identified during the interviews.
3.3. Further observations
3.3.1. The future of network companies
I2, I7, I9 and I12 noted that the current system, where electricity consumers mostly pay
for the energy consumed will change in the future. As the consumers become more
active in the market (e.g. start producing electricity locally), the consumption is
lowered. Meanwhile, the costs to manage the grid remain largely the same. This in turn
means a higher tariff for the non-active consumers (a snake eating its own tail). One
possible solution is utilizing fixed or capacity components when charging for network
services.
Making long-term investments into expensive infrastructure should be reduced as much
as possible. Especially into areas with low population density. The pace of
technological development has become so rapid, that we cannot imagine the solutions
available in 10 years. Traditional investments into the grid have a 40…60 year lifespan.
/…/ In the future, electricity distribution might not be a monopoly anymore. (I9)
A similar statement also emerged from the interview with I2, who noted that contrarily
to the common view, electricity, gas and heat are in fact competitors. For the consumer
39
it does not matter, where the energy comes from as long as it is comfortable and
reasonably priced.
I4 noted that in their electricity grid, the potential for growth in consumption is low.
According to I12, in the current environment of constant change, keeping investments
into new grid and devices in the next years as low as possible would be more feasible
in the long-run. Therefore, keeping the existing investments running as long as possible,
should be the main focus. “We don’t know what the electricity network will look like
in 2057, it is almost impossible to make predictions for even 2030. We will be much
smarter in 2020, than we are now.”
Data management will be a key aspect in the future for electricity network companies.
In the future, it is possible, that there will be more data flows in the energy system
than energy. (I2; I12)
3.3.2. Other observations
According to I2, when implementing a performance-based regulation, a wider approach
would be more beneficial. Similar sectors to be covered are district heating, water
and gas distribution.
I12 noted, that in the future, it might be feasible to have a single energy regulator
for the Nordics and Estonia. This would lower the regulatory overhead. What is more,
having one energy regulator for several countries would level the playing field and
enable to make the regulation more transparent and more easily understandable for
foreign investors. The same approach could be applied to other similar sectors as well
(e.g. the Financial Supervision Authority).
According to (I10 and I11), the utilizing a performance-based regulation enabled the
regulator to get better information on the regulated entities, as the companies were more
willing to provide data on their economic activities.
40
3.4. Discussion
3.4.1. Implications and propositions
Based on the information collected during the case study research a common theme
emerged – the managements of Estonian electricity network companies see a need for
changing the existing price regulation. There are, however, several views and ways how
to solve this. The author proposes two ways of changing the existing electricity
network price regulation:
a) amending (upgrading) the existing framework;
b) transitioning to a performance-based price regulation.
Updating the existing regulatory framework
Some of the interviewees proposed amending (upgrading) the existing regulation
instead (§ 3.1.1) of implementing a completely new regulation.
Several of the interviewees pointed out, that regulation methodology should be clearly
described in the Electricity Market Act. Currently, the task of development of the
methodology has fallen to the regulator (Konkurentsiamet), who also conducts
supervision over the network companies. According to I3, while updating the Electricity
Market Act, it would be reasonable to utilize the approach used for the natural gas sector
in 2012, which would solve many issues with the regulatory asset base calculation.
The need to change calculation methodology of WACC was also mentioned several
times. Under the existing framework, the network companies’ profit is determined by
their RAB and the level of WACC. It was suggested, that the calculation methodology
of WACC should also take into account income tax component and the size of the
network company.
Under allowed revenues, the calculation of current capital should take into account
the taxes and levies collected by the network operators (excise tax, renewable energy
fee).
Finally, the smaller DSO’s could benefit from a reference revenue. “If the company’s
revenues are lower than the set fixed revenues, the company would not have to though
the time-consuming approval process” (I6). A similar system is currently being
proposed for the regulation of district heating sector.
41
Transitioning to a performance-based price regulation
The initial high-level framework for a possible performance-based regulation in
Estonia was constructed based on literature review. This was done to provide structure
to the interviews. The results of the interviews gave significant inputs for proposing
changes to the price regulation. Transitioning to a performance-based price
regulation will only make sense, if benefits outweigh the costs and the new system
is fit for purpose. The type of price regulation that should be used depends on which
future is envisioned for the electricity network companies and for the energy sector.
Companies with more capabilities and resources can identify future trends and change
their internal and learning and growth processes accordingly. A new price regulation
could also allow network companies to reduce costs for the end-consumers by utilizing
new business models.
Performance categories are the heart of any incentive regulation. Based on the findings
in § 3.1.2, key performance categories for a performance-based electricity network price
regulation were identified. The potential performance categories6
identified from the
interviews are listed as follows:
a) service quality;
b) customer satisfaction
c) innovation and R&D;
d) duration and cost of connecting to the grid;
e) customer empowerment.
When transitioning to an incentive regulation, there would also have to be capacity
building (e.g. more funding and employees) within the regulator as well. For eliciting
foreign investments, the new regulatory framework should be made similar to existing
widely-used and known price regulations.
More details on the proposed changes and a comparison between the existing and
proposed price regulation frameworks can be found in Appendix 5.
6
See Appendix 1 for a more detailed explanation of the categories and an overview of the performance
metrics typically used.
42
3.4.2. Strategy Map
After the potential performance-based price regulation framework had been formed on
the basis of interviews, a Strategy Map for an electric utility subject to a
performance-based price regulation was composed. The Strategy Map (a
communication tool used to tell a story, how value is created) was composed based on
the inputs from the interviews and literature review. As can be seen from the figure
below, the Strategy Map incorporates all of the four BCS elements (Figure 12).
Figure 12. A potential Strategy Map of an electric utility under a performance-based
price regulation.
Author’s drawing.
The figure above describes the situation where an optimal performance-based price
regulation is implemented. Moving from macro to the micro, as first step the vision,
mission and strategy statements were described. Benchmarking is an important tool
Customer
Perspective
Internal
Perspective
Learning &
Growth
Perspective
Financial
Perspective
L1 - Human Capital
Qualified workforce (esp. IT &
consumer relations)
Sustainable recruitment
Voluntary employee turnover
L3 - Information Capital
IT systems & Databases
Communication & Contacts
Investigate and adopt innovative
technologies
L2 - Organisational Capital
Right resources and tools are
available for employees
High corporate image
Attractive place to work
+
Our strategy: By 2025, OUR investment and innovation activities have enabled to reduce the price of network
services for OUR customers
Our mission: To ensure a reliable and quality electricity supply to OUR customers with a sustainable price and ROI
Our vision: To be among the TOP X comparable electricity network companies in Y region
Customer Focus Operational
Excellence
Growth &
Sustainability
F1 – Dividends, EVA
F2 – Ensure financial
sustainability
F3 – Pursue core
business growth
F4 – Develop new
revenue streams
C1 – Deliver Out-
standing Customer
Experience
C2 - Cost Effective
& Competitive Rates
C3 – Ensure Security
of Supply
C4 – Ensure Quality
of Supply
C5 – Promote
customer efficiency
I2 - Continuous
Improvement of Key
Processes
I5 – Transparency &
Stakeholder
involvement
I4 – Ensure
sustainability of the
company
I1 – Foster internal
communication &
cooperation
+
I3 – Prolong asset
lifetime
43
used in the performance-based price regulation. Therefore, the vision for an electric
utility could be in the TOP 5 or TOP 10 comparable (same size, sales etc.) network
companies in the region. The mission of a performance-regulated company is to ensure
a reliable and quality supply of electricity for their customers, while ensuring the
economic sustainability of the company. Under the performance-based regulation
framework the strategic goal would be to create a win-win solution through smart
investment and innovation activities – reducing the price of network services for
the customer, while ensuring sustainable returns.
As can be seen from Figure 12, in addition to the four horizontal BCS categories,
vertical categories (Customer Focus, Operational Excellence; Growth and
Sustainability) emerged while grouping the key performance areas (KPA). In total 17
KPA’s were defined.
The foundation of the strategy is the learning and growth perspective is to ensure that
the company has adequate human, informational and organisational capital. The
activities under the human capital KPA include training the existing employees and
developing their skills. The interviewees brought out, that IT and customer relations
skills are specifically important. Voluntary employee turnover and the availability of
new employees must be guaranteed as well. This is supported by developing the
organisational capital creating a high corporate image (attractive place to work) and
providing the right tools and resources for the existing and new employees. This in turn
is supported by developing the informational capital. In addition to ensuring the
information availability, an electric utility should also focus on innovation and foresight
to anticipate and benefit from future developments.
The internal perspective focuses on the business processes. Continuous improvement
of key processes (planning the network; designing and building the network; operating
and maintenance of the network; billing and collection) is a key activity under the
performance-based price regulation. At a time, where the only thing constant is change,
the focus of the company should be to prolong the lifetime of existing assets, espescially
in rural areas.
The security of supply and quality of supply need to be ensured at all times. This as
well as ensuring outstanding customer care and cost-effective and competitive rates is
Transitioning to a performance-based price regulation in Estonia. A Case Study. J. Uiga

More Related Content

What's hot

Consultants estimating manual
Consultants estimating manualConsultants estimating manual
Consultants estimating manualDaniel Libe
 
Jeffrey_Whyte_BE_Thesis
Jeffrey_Whyte_BE_ThesisJeffrey_Whyte_BE_Thesis
Jeffrey_Whyte_BE_ThesisJeff Whyte
 
Second Revision Syria Regional Response Plan
Second Revision Syria Regional Response PlanSecond Revision Syria Regional Response Plan
Second Revision Syria Regional Response PlanJesse Budlong
 
The WalkUP Wake-Up Call: Atlanta The Poster Child of Sprawl Builds a Walkable...
The WalkUP Wake-Up Call: Atlanta The Poster Child of Sprawl Builds a Walkable...The WalkUP Wake-Up Call: Atlanta The Poster Child of Sprawl Builds a Walkable...
The WalkUP Wake-Up Call: Atlanta The Poster Child of Sprawl Builds a Walkable...Jesse Budlong
 
A Bidding System In Football "Football Fantasy"
A Bidding System In Football "Football Fantasy" A Bidding System In Football "Football Fantasy"
A Bidding System In Football "Football Fantasy" Anit Thapaliya
 
211466929-E-book-Impact-of-organization-justice-to-reduce-conflict-between-em...
211466929-E-book-Impact-of-organization-justice-to-reduce-conflict-between-em...211466929-E-book-Impact-of-organization-justice-to-reduce-conflict-between-em...
211466929-E-book-Impact-of-organization-justice-to-reduce-conflict-between-em...Wasiq Rauf
 
Strategic Planning in the Arts: A Practical Guide, Michael M. Kaiser
Strategic Planning in the Arts: A Practical Guide, Michael M. KaiserStrategic Planning in the Arts: A Practical Guide, Michael M. Kaiser
Strategic Planning in the Arts: A Practical Guide, Michael M. KaiserGhenadie Sontu
 
Virtual Classroom System for Women`s University in Africa
Virtual Classroom System for Women`s University in AfricaVirtual Classroom System for Women`s University in Africa
Virtual Classroom System for Women`s University in Africatarrie chagwiza
 
Factors affect taking charge at Vingroup Corporation
Factors affect taking charge at Vingroup CorporationFactors affect taking charge at Vingroup Corporation
Factors affect taking charge at Vingroup CorporationNguyễn Hà
 
Applications Of Dynamic Pricing (5.05.05)
Applications Of Dynamic Pricing (5.05.05)Applications Of Dynamic Pricing (5.05.05)
Applications Of Dynamic Pricing (5.05.05)lmaurer
 
Self optimizing networks-benefits of son in lte-july 2011
Self optimizing networks-benefits of son in lte-july 2011Self optimizing networks-benefits of son in lte-july 2011
Self optimizing networks-benefits of son in lte-july 2011navaidkhan
 
The Honohan Report
The Honohan ReportThe Honohan Report
The Honohan ReportExSite
 
Martishang fgdc arc_catalog_metadata_template
Martishang fgdc arc_catalog_metadata_templateMartishang fgdc arc_catalog_metadata_template
Martishang fgdc arc_catalog_metadata_templateMohammed Alhessi
 
PA DEP: 2015 Climate Change Action Plan Update
PA DEP: 2015 Climate Change Action Plan UpdatePA DEP: 2015 Climate Change Action Plan Update
PA DEP: 2015 Climate Change Action Plan UpdateMarcellus Drilling News
 

What's hot (20)

Consultants estimating manual
Consultants estimating manualConsultants estimating manual
Consultants estimating manual
 
Jeffrey_Whyte_BE_Thesis
Jeffrey_Whyte_BE_ThesisJeffrey_Whyte_BE_Thesis
Jeffrey_Whyte_BE_Thesis
 
Gate brouchre
Gate brouchreGate brouchre
Gate brouchre
 
Second Revision Syria Regional Response Plan
Second Revision Syria Regional Response PlanSecond Revision Syria Regional Response Plan
Second Revision Syria Regional Response Plan
 
Final_Report_12th
Final_Report_12thFinal_Report_12th
Final_Report_12th
 
The WalkUP Wake-Up Call: Atlanta The Poster Child of Sprawl Builds a Walkable...
The WalkUP Wake-Up Call: Atlanta The Poster Child of Sprawl Builds a Walkable...The WalkUP Wake-Up Call: Atlanta The Poster Child of Sprawl Builds a Walkable...
The WalkUP Wake-Up Call: Atlanta The Poster Child of Sprawl Builds a Walkable...
 
Thesis 03.07
Thesis 03.07 Thesis 03.07
Thesis 03.07
 
innovation multinível
innovation multinívelinnovation multinível
innovation multinível
 
A Bidding System In Football "Football Fantasy"
A Bidding System In Football "Football Fantasy" A Bidding System In Football "Football Fantasy"
A Bidding System In Football "Football Fantasy"
 
211466929-E-book-Impact-of-organization-justice-to-reduce-conflict-between-em...
211466929-E-book-Impact-of-organization-justice-to-reduce-conflict-between-em...211466929-E-book-Impact-of-organization-justice-to-reduce-conflict-between-em...
211466929-E-book-Impact-of-organization-justice-to-reduce-conflict-between-em...
 
Strategic Planning in the Arts: A Practical Guide, Michael M. Kaiser
Strategic Planning in the Arts: A Practical Guide, Michael M. KaiserStrategic Planning in the Arts: A Practical Guide, Michael M. Kaiser
Strategic Planning in the Arts: A Practical Guide, Michael M. Kaiser
 
Metaschool Module 3.16
Metaschool Module 3.16Metaschool Module 3.16
Metaschool Module 3.16
 
Virtual Classroom System for Women`s University in Africa
Virtual Classroom System for Women`s University in AfricaVirtual Classroom System for Women`s University in Africa
Virtual Classroom System for Women`s University in Africa
 
Factors affect taking charge at Vingroup Corporation
Factors affect taking charge at Vingroup CorporationFactors affect taking charge at Vingroup Corporation
Factors affect taking charge at Vingroup Corporation
 
Applications Of Dynamic Pricing (5.05.05)
Applications Of Dynamic Pricing (5.05.05)Applications Of Dynamic Pricing (5.05.05)
Applications Of Dynamic Pricing (5.05.05)
 
Self optimizing networks-benefits of son in lte-july 2011
Self optimizing networks-benefits of son in lte-july 2011Self optimizing networks-benefits of son in lte-july 2011
Self optimizing networks-benefits of son in lte-july 2011
 
The Honohan Report
The Honohan ReportThe Honohan Report
The Honohan Report
 
Martishang fgdc arc_catalog_metadata_template
Martishang fgdc arc_catalog_metadata_templateMartishang fgdc arc_catalog_metadata_template
Martishang fgdc arc_catalog_metadata_template
 
e-Skills Match Handbook
e-Skills Match Handbooke-Skills Match Handbook
e-Skills Match Handbook
 
PA DEP: 2015 Climate Change Action Plan Update
PA DEP: 2015 Climate Change Action Plan UpdatePA DEP: 2015 Climate Change Action Plan Update
PA DEP: 2015 Climate Change Action Plan Update
 

Similar to Transitioning to a performance-based price regulation in Estonia. A Case Study. J. Uiga

Dissertation_katia_2015_ultima
Dissertation_katia_2015_ultimaDissertation_katia_2015_ultima
Dissertation_katia_2015_ultimaKatia Cuellar
 
2013 adapt libra_report_wlb eu
2013 adapt libra_report_wlb eu2013 adapt libra_report_wlb eu
2013 adapt libra_report_wlb euExperience for You
 
WHAT CONSTITUTES AN AGILE ORGANIZATION? ? DESCRIPTIVE RESULTS OF AN EMPIRICAL...
WHAT CONSTITUTES AN AGILE ORGANIZATION? ? DESCRIPTIVE RESULTS OF AN EMPIRICAL...WHAT CONSTITUTES AN AGILE ORGANIZATION? ? DESCRIPTIVE RESULTS OF AN EMPIRICAL...
WHAT CONSTITUTES AN AGILE ORGANIZATION? ? DESCRIPTIVE RESULTS OF AN EMPIRICAL...iasaglobal
 
Energy Systems Optimization Of A Shopping Mall
Energy Systems Optimization Of A Shopping MallEnergy Systems Optimization Of A Shopping Mall
Energy Systems Optimization Of A Shopping MallAristotelisGiannopoulos
 
Design for public services- The fourth way
Design for public services- The fourth wayDesign for public services- The fourth way
Design for public services- The fourth wayforumvirium
 
Optimization of an Energy-Generating Turnstile
Optimization of an Energy-Generating TurnstileOptimization of an Energy-Generating Turnstile
Optimization of an Energy-Generating TurnstileWayne Smith
 
Sample econsultancy-real-time-bidding-buyers-guide-2012.pdf
Sample econsultancy-real-time-bidding-buyers-guide-2012.pdfSample econsultancy-real-time-bidding-buyers-guide-2012.pdf
Sample econsultancy-real-time-bidding-buyers-guide-2012.pdfAndrey Zhukov
 
100302 going mobile
100302 going mobile100302 going mobile
100302 going mobileErin Mote
 
From sound to grammar: theory, representations and a computational model
From sound to grammar: theory, representations and a computational modelFrom sound to grammar: theory, representations and a computational model
From sound to grammar: theory, representations and a computational modelMarco Piccolino
 
SSTRM - StrategicReviewGroup.ca - Workshop 2: Power/Energy and Sustainability...
SSTRM - StrategicReviewGroup.ca - Workshop 2: Power/Energy and Sustainability...SSTRM - StrategicReviewGroup.ca - Workshop 2: Power/Energy and Sustainability...
SSTRM - StrategicReviewGroup.ca - Workshop 2: Power/Energy and Sustainability...Phil Carr
 
THE IMPACT OF SOCIALMEDIA ON ENTREPRENEURIAL NETWORKS
THE IMPACT OF SOCIALMEDIA ON ENTREPRENEURIAL NETWORKSTHE IMPACT OF SOCIALMEDIA ON ENTREPRENEURIAL NETWORKS
THE IMPACT OF SOCIALMEDIA ON ENTREPRENEURIAL NETWORKSDebashish Mandal
 
Minigrid policy toolkit 2014 REN21
Minigrid policy toolkit 2014 REN21Minigrid policy toolkit 2014 REN21
Minigrid policy toolkit 2014 REN21PatrickTanz
 
Global-Photovoltaic-Power-Potential-by-Country.pdf
Global-Photovoltaic-Power-Potential-by-Country.pdfGlobal-Photovoltaic-Power-Potential-by-Country.pdf
Global-Photovoltaic-Power-Potential-by-Country.pdfSimonBAmadisT
 

Similar to Transitioning to a performance-based price regulation in Estonia. A Case Study. J. Uiga (20)

Dissertation_katia_2015_ultima
Dissertation_katia_2015_ultimaDissertation_katia_2015_ultima
Dissertation_katia_2015_ultima
 
2013 adapt libra_report_wlb eu
2013 adapt libra_report_wlb eu2013 adapt libra_report_wlb eu
2013 adapt libra_report_wlb eu
 
WHAT CONSTITUTES AN AGILE ORGANIZATION? ? DESCRIPTIVE RESULTS OF AN EMPIRICAL...
WHAT CONSTITUTES AN AGILE ORGANIZATION? ? DESCRIPTIVE RESULTS OF AN EMPIRICAL...WHAT CONSTITUTES AN AGILE ORGANIZATION? ? DESCRIPTIVE RESULTS OF AN EMPIRICAL...
WHAT CONSTITUTES AN AGILE ORGANIZATION? ? DESCRIPTIVE RESULTS OF AN EMPIRICAL...
 
Fp7 evrules en
Fp7 evrules enFp7 evrules en
Fp7 evrules en
 
Energy Systems Optimization Of A Shopping Mall
Energy Systems Optimization Of A Shopping MallEnergy Systems Optimization Of A Shopping Mall
Energy Systems Optimization Of A Shopping Mall
 
Design for public services- The fourth way
Design for public services- The fourth wayDesign for public services- The fourth way
Design for public services- The fourth way
 
Suyash Thesis
Suyash ThesisSuyash Thesis
Suyash Thesis
 
Optimization of an Energy-Generating Turnstile
Optimization of an Energy-Generating TurnstileOptimization of an Energy-Generating Turnstile
Optimization of an Energy-Generating Turnstile
 
thesis
thesisthesis
thesis
 
Tesi_Gasparetto_Walter
Tesi_Gasparetto_WalterTesi_Gasparetto_Walter
Tesi_Gasparetto_Walter
 
Airah Discussion Paper Energy Modelling Protocol Alignment 300911
Airah Discussion Paper   Energy Modelling Protocol Alignment 300911Airah Discussion Paper   Energy Modelling Protocol Alignment 300911
Airah Discussion Paper Energy Modelling Protocol Alignment 300911
 
Sample econsultancy-real-time-bidding-buyers-guide-2012.pdf
Sample econsultancy-real-time-bidding-buyers-guide-2012.pdfSample econsultancy-real-time-bidding-buyers-guide-2012.pdf
Sample econsultancy-real-time-bidding-buyers-guide-2012.pdf
 
100302 going mobile
100302 going mobile100302 going mobile
100302 going mobile
 
From sound to grammar: theory, representations and a computational model
From sound to grammar: theory, representations and a computational modelFrom sound to grammar: theory, representations and a computational model
From sound to grammar: theory, representations and a computational model
 
SSTRM - StrategicReviewGroup.ca - Workshop 2: Power/Energy and Sustainability...
SSTRM - StrategicReviewGroup.ca - Workshop 2: Power/Energy and Sustainability...SSTRM - StrategicReviewGroup.ca - Workshop 2: Power/Energy and Sustainability...
SSTRM - StrategicReviewGroup.ca - Workshop 2: Power/Energy and Sustainability...
 
THE IMPACT OF SOCIALMEDIA ON ENTREPRENEURIAL NETWORKS
THE IMPACT OF SOCIALMEDIA ON ENTREPRENEURIAL NETWORKSTHE IMPACT OF SOCIALMEDIA ON ENTREPRENEURIAL NETWORKS
THE IMPACT OF SOCIALMEDIA ON ENTREPRENEURIAL NETWORKS
 
Knustthesis
KnustthesisKnustthesis
Knustthesis
 
Minigrid policy toolkit 2014 REN21
Minigrid policy toolkit 2014 REN21Minigrid policy toolkit 2014 REN21
Minigrid policy toolkit 2014 REN21
 
Global-Photovoltaic-Power-Potential-by-Country.pdf
Global-Photovoltaic-Power-Potential-by-Country.pdfGlobal-Photovoltaic-Power-Potential-by-Country.pdf
Global-Photovoltaic-Power-Potential-by-Country.pdf
 
CASE Network Report 66 - Prospects for EU-Ukraine Economic Relations
CASE Network Report 66 - Prospects for EU-Ukraine Economic RelationsCASE Network Report 66 - Prospects for EU-Ukraine Economic Relations
CASE Network Report 66 - Prospects for EU-Ukraine Economic Relations
 

Recently uploaded

fca-bsps-decision-letter-redacted (1).pdf
fca-bsps-decision-letter-redacted (1).pdffca-bsps-decision-letter-redacted (1).pdf
fca-bsps-decision-letter-redacted (1).pdfHenry Tapper
 
Quarter 4- Module 3 Principles of Marketing
Quarter 4- Module 3 Principles of MarketingQuarter 4- Module 3 Principles of Marketing
Quarter 4- Module 3 Principles of MarketingMaristelaRamos12
 
Dividend Policy and Dividend Decision Theories.pptx
Dividend Policy and Dividend Decision Theories.pptxDividend Policy and Dividend Decision Theories.pptx
Dividend Policy and Dividend Decision Theories.pptxanshikagoel52
 
Call Girls Service Nagpur Maya Call 7001035870 Meet With Nagpur Escorts
Call Girls Service Nagpur Maya Call 7001035870 Meet With Nagpur EscortsCall Girls Service Nagpur Maya Call 7001035870 Meet With Nagpur Escorts
Call Girls Service Nagpur Maya Call 7001035870 Meet With Nagpur Escortsranjana rawat
 
20240417-Calibre-April-2024-Investor-Presentation.pdf
20240417-Calibre-April-2024-Investor-Presentation.pdf20240417-Calibre-April-2024-Investor-Presentation.pdf
20240417-Calibre-April-2024-Investor-Presentation.pdfAdnet Communications
 
VIP Call Girls Thane Sia 8617697112 Independent Escort Service Thane
VIP Call Girls Thane Sia 8617697112 Independent Escort Service ThaneVIP Call Girls Thane Sia 8617697112 Independent Escort Service Thane
VIP Call Girls Thane Sia 8617697112 Independent Escort Service ThaneCall girls in Ahmedabad High profile
 
Quantitative Analysis of Retail Sector Companies
Quantitative Analysis of Retail Sector CompaniesQuantitative Analysis of Retail Sector Companies
Quantitative Analysis of Retail Sector Companiesprashantbhati354
 
Andheri Call Girls In 9825968104 Mumbai Hot Models
Andheri Call Girls In 9825968104 Mumbai Hot ModelsAndheri Call Girls In 9825968104 Mumbai Hot Models
Andheri Call Girls In 9825968104 Mumbai Hot Modelshematsharma006
 
Stock Market Brief Deck for 4/24/24 .pdf
Stock Market Brief Deck for 4/24/24 .pdfStock Market Brief Deck for 4/24/24 .pdf
Stock Market Brief Deck for 4/24/24 .pdfMichael Silva
 
(ANIKA) Budhwar Peth Call Girls Just Call 7001035870 [ Cash on Delivery ] Pun...
(ANIKA) Budhwar Peth Call Girls Just Call 7001035870 [ Cash on Delivery ] Pun...(ANIKA) Budhwar Peth Call Girls Just Call 7001035870 [ Cash on Delivery ] Pun...
(ANIKA) Budhwar Peth Call Girls Just Call 7001035870 [ Cash on Delivery ] Pun...ranjana rawat
 
The Economic History of the U.S. Lecture 17.pdf
The Economic History of the U.S. Lecture 17.pdfThe Economic History of the U.S. Lecture 17.pdf
The Economic History of the U.S. Lecture 17.pdfGale Pooley
 
VIP Call Girls in Saharanpur Aarohi 8250192130 Independent Escort Service Sah...
VIP Call Girls in Saharanpur Aarohi 8250192130 Independent Escort Service Sah...VIP Call Girls in Saharanpur Aarohi 8250192130 Independent Escort Service Sah...
VIP Call Girls in Saharanpur Aarohi 8250192130 Independent Escort Service Sah...Suhani Kapoor
 
Lundin Gold April 2024 Corporate Presentation v4.pdf
Lundin Gold April 2024 Corporate Presentation v4.pdfLundin Gold April 2024 Corporate Presentation v4.pdf
Lundin Gold April 2024 Corporate Presentation v4.pdfAdnet Communications
 
Independent Call Girl Number in Kurla Mumbai📲 Pooja Nehwal 9892124323 💞 Full ...
Independent Call Girl Number in Kurla Mumbai📲 Pooja Nehwal 9892124323 💞 Full ...Independent Call Girl Number in Kurla Mumbai📲 Pooja Nehwal 9892124323 💞 Full ...
Independent Call Girl Number in Kurla Mumbai📲 Pooja Nehwal 9892124323 💞 Full ...Pooja Nehwal
 
Best VIP Call Girls Noida Sector 18 Call Me: 8448380779
Best VIP Call Girls Noida Sector 18 Call Me: 8448380779Best VIP Call Girls Noida Sector 18 Call Me: 8448380779
Best VIP Call Girls Noida Sector 18 Call Me: 8448380779Delhi Call girls
 
Instant Issue Debit Cards - School Designs
Instant Issue Debit Cards - School DesignsInstant Issue Debit Cards - School Designs
Instant Issue Debit Cards - School Designsegoetzinger
 
VIP High Class Call Girls Saharanpur Anushka 8250192130 Independent Escort Se...
VIP High Class Call Girls Saharanpur Anushka 8250192130 Independent Escort Se...VIP High Class Call Girls Saharanpur Anushka 8250192130 Independent Escort Se...
VIP High Class Call Girls Saharanpur Anushka 8250192130 Independent Escort Se...Suhani Kapoor
 
(DIYA) Bhumkar Chowk Call Girls Just Call 7001035870 [ Cash on Delivery ] Pun...
(DIYA) Bhumkar Chowk Call Girls Just Call 7001035870 [ Cash on Delivery ] Pun...(DIYA) Bhumkar Chowk Call Girls Just Call 7001035870 [ Cash on Delivery ] Pun...
(DIYA) Bhumkar Chowk Call Girls Just Call 7001035870 [ Cash on Delivery ] Pun...ranjana rawat
 
VIP Call Girls Service Dilsukhnagar Hyderabad Call +91-8250192130
VIP Call Girls Service Dilsukhnagar Hyderabad Call +91-8250192130VIP Call Girls Service Dilsukhnagar Hyderabad Call +91-8250192130
VIP Call Girls Service Dilsukhnagar Hyderabad Call +91-8250192130Suhani Kapoor
 

Recently uploaded (20)

fca-bsps-decision-letter-redacted (1).pdf
fca-bsps-decision-letter-redacted (1).pdffca-bsps-decision-letter-redacted (1).pdf
fca-bsps-decision-letter-redacted (1).pdf
 
Quarter 4- Module 3 Principles of Marketing
Quarter 4- Module 3 Principles of MarketingQuarter 4- Module 3 Principles of Marketing
Quarter 4- Module 3 Principles of Marketing
 
Dividend Policy and Dividend Decision Theories.pptx
Dividend Policy and Dividend Decision Theories.pptxDividend Policy and Dividend Decision Theories.pptx
Dividend Policy and Dividend Decision Theories.pptx
 
Call Girls Service Nagpur Maya Call 7001035870 Meet With Nagpur Escorts
Call Girls Service Nagpur Maya Call 7001035870 Meet With Nagpur EscortsCall Girls Service Nagpur Maya Call 7001035870 Meet With Nagpur Escorts
Call Girls Service Nagpur Maya Call 7001035870 Meet With Nagpur Escorts
 
20240417-Calibre-April-2024-Investor-Presentation.pdf
20240417-Calibre-April-2024-Investor-Presentation.pdf20240417-Calibre-April-2024-Investor-Presentation.pdf
20240417-Calibre-April-2024-Investor-Presentation.pdf
 
VIP Call Girls Thane Sia 8617697112 Independent Escort Service Thane
VIP Call Girls Thane Sia 8617697112 Independent Escort Service ThaneVIP Call Girls Thane Sia 8617697112 Independent Escort Service Thane
VIP Call Girls Thane Sia 8617697112 Independent Escort Service Thane
 
Quantitative Analysis of Retail Sector Companies
Quantitative Analysis of Retail Sector CompaniesQuantitative Analysis of Retail Sector Companies
Quantitative Analysis of Retail Sector Companies
 
Andheri Call Girls In 9825968104 Mumbai Hot Models
Andheri Call Girls In 9825968104 Mumbai Hot ModelsAndheri Call Girls In 9825968104 Mumbai Hot Models
Andheri Call Girls In 9825968104 Mumbai Hot Models
 
Veritas Interim Report 1 January–31 March 2024
Veritas Interim Report 1 January–31 March 2024Veritas Interim Report 1 January–31 March 2024
Veritas Interim Report 1 January–31 March 2024
 
Stock Market Brief Deck for 4/24/24 .pdf
Stock Market Brief Deck for 4/24/24 .pdfStock Market Brief Deck for 4/24/24 .pdf
Stock Market Brief Deck for 4/24/24 .pdf
 
(ANIKA) Budhwar Peth Call Girls Just Call 7001035870 [ Cash on Delivery ] Pun...
(ANIKA) Budhwar Peth Call Girls Just Call 7001035870 [ Cash on Delivery ] Pun...(ANIKA) Budhwar Peth Call Girls Just Call 7001035870 [ Cash on Delivery ] Pun...
(ANIKA) Budhwar Peth Call Girls Just Call 7001035870 [ Cash on Delivery ] Pun...
 
The Economic History of the U.S. Lecture 17.pdf
The Economic History of the U.S. Lecture 17.pdfThe Economic History of the U.S. Lecture 17.pdf
The Economic History of the U.S. Lecture 17.pdf
 
VIP Call Girls in Saharanpur Aarohi 8250192130 Independent Escort Service Sah...
VIP Call Girls in Saharanpur Aarohi 8250192130 Independent Escort Service Sah...VIP Call Girls in Saharanpur Aarohi 8250192130 Independent Escort Service Sah...
VIP Call Girls in Saharanpur Aarohi 8250192130 Independent Escort Service Sah...
 
Lundin Gold April 2024 Corporate Presentation v4.pdf
Lundin Gold April 2024 Corporate Presentation v4.pdfLundin Gold April 2024 Corporate Presentation v4.pdf
Lundin Gold April 2024 Corporate Presentation v4.pdf
 
Independent Call Girl Number in Kurla Mumbai📲 Pooja Nehwal 9892124323 💞 Full ...
Independent Call Girl Number in Kurla Mumbai📲 Pooja Nehwal 9892124323 💞 Full ...Independent Call Girl Number in Kurla Mumbai📲 Pooja Nehwal 9892124323 💞 Full ...
Independent Call Girl Number in Kurla Mumbai📲 Pooja Nehwal 9892124323 💞 Full ...
 
Best VIP Call Girls Noida Sector 18 Call Me: 8448380779
Best VIP Call Girls Noida Sector 18 Call Me: 8448380779Best VIP Call Girls Noida Sector 18 Call Me: 8448380779
Best VIP Call Girls Noida Sector 18 Call Me: 8448380779
 
Instant Issue Debit Cards - School Designs
Instant Issue Debit Cards - School DesignsInstant Issue Debit Cards - School Designs
Instant Issue Debit Cards - School Designs
 
VIP High Class Call Girls Saharanpur Anushka 8250192130 Independent Escort Se...
VIP High Class Call Girls Saharanpur Anushka 8250192130 Independent Escort Se...VIP High Class Call Girls Saharanpur Anushka 8250192130 Independent Escort Se...
VIP High Class Call Girls Saharanpur Anushka 8250192130 Independent Escort Se...
 
(DIYA) Bhumkar Chowk Call Girls Just Call 7001035870 [ Cash on Delivery ] Pun...
(DIYA) Bhumkar Chowk Call Girls Just Call 7001035870 [ Cash on Delivery ] Pun...(DIYA) Bhumkar Chowk Call Girls Just Call 7001035870 [ Cash on Delivery ] Pun...
(DIYA) Bhumkar Chowk Call Girls Just Call 7001035870 [ Cash on Delivery ] Pun...
 
VIP Call Girls Service Dilsukhnagar Hyderabad Call +91-8250192130
VIP Call Girls Service Dilsukhnagar Hyderabad Call +91-8250192130VIP Call Girls Service Dilsukhnagar Hyderabad Call +91-8250192130
VIP Call Girls Service Dilsukhnagar Hyderabad Call +91-8250192130
 

Transitioning to a performance-based price regulation in Estonia. A Case Study. J. Uiga

  • 1. 1 Estonian Business School Chair of Management TRANSITIONING TO A PERFORMANCE-BASED ELECTRICITY NETWORK PRICE REGULATION IN ESTONIA A CASE STUDY Master’s thesis by Jaanus Uiga Supervisor: Anto Liivat Adviser: Märt Ots, PhD Tallinn 2017
  • 2. 2 I herewith declare that I have written the Master’s Thesis independently. References have been indicated for the publications, claims, options and different sources by other authors. 25th May 2017 ............................/J. Uiga/
  • 3. ii TABLE OF CONTENTS LIST OF TABLES......................................................................................................iv LIST OF FIGURES..................................................................................................... v ABBREVIATIONS.....................................................................................................vi ABSTRACT................................................................................................................vii INTRODUCTION ....................................................................................................... 1 1. LITERATURE REVIEW.................................................................................. 4 1.1. Monopolies and regulation ............................................................................ 4 1.2. Price regulation of electricity network companies......................................... 6 1.2.1. Traditional regulation and performance-based regulation..................... 6 1.2.2. Regulation models used for electricity networks................................. 10 1.2.3. Designing a performance-based price regulation ................................ 11 1.2.4. Risks of using performance incentives ................................................ 13 1.3. Balanced Scorecard and Strategy Maps....................................................... 15 1.3.1. Strategy and the Balanced Scorecard................................................... 15 1.3.2. Limitations and critique....................................................................... 16 1.3.3. Strategy Maps ...................................................................................... 17 2. RESEARCH METHODOLOGY.................................................................... 19 2.1. Research design ........................................................................................... 19 2.2. Background of the analysed case................................................................. 21 2.2.1. Electricity market in Estonia................................................................ 21 2.2.2. Electricity network price regulation in Estonia ................................... 23 2.3. Sampling and the respondent group............................................................. 26 2.4. Data collection ............................................................................................. 27 2.5. Data analysis................................................................................................ 28 2.6. Research limitations..................................................................................... 29 3. RESULTS AND DISCUSSION....................................................................... 31 3.1. Price regulation framework in Estonia ........................................................ 31 3.1.1. Existing price-regulation framework................................................... 31 3.1.2. Potential performance-based price regulation framework................... 33 3.2. Network company’s management................................................................ 35
  • 4. iii 3.2.1. Financial aspects.................................................................................. 35 3.2.2. Customer expectations......................................................................... 36 3.2.3. Internal aspects..................................................................................... 36 3.2.4. Learning and growth............................................................................ 38 3.3. Further observations..................................................................................... 38 3.3.1. The future of network companies ........................................................ 38 3.3.2. Other observations ............................................................................... 39 3.4. Discussion.................................................................................................... 40 3.4.1. Implications and propositions.............................................................. 40 3.4.2. Strategy Map........................................................................................ 42 3.4.3. Further research ................................................................................... 44 CONCLUSIONS ........................................................................................................ 47 REFERENCES........................................................................................................... 50 APPENDICES............................................................................................................ 55 Appendix 1. A selection of performance areas and metrics .................................... 56 Appendix 2. Risks of using performance incentives ............................................... 62 Appendix 3. Interviewed People.............................................................................. 63 Appendix 4. Introduction to the interview and questions........................................ 64 Appendix 5. Possible price regulation frameworks for Estonia .............................. 66 Appendix 6. Strategy Map and its KPIs................................................................... 67 RESÜMEE.................................................................................................................. 68
  • 5. iv LIST OF TABLES Table 1. Deserved and underserved market power........................................................ 5 Table 2. Key principles for designing a performance incentive mechanism............... 11 Table 3. Potential risks of using performance incentives: mitigation and avoidance.. 14 Table 4. Electricity network operators in Estonia in 2015........................................... 22 Table 5. Sample calculation of the allowed revenue of the DSO................................ 24 Table 6. Traditional and emerging performance areas ................................................ 56 Table 7. Reliability Performance Metrics.................................................................... 56 Table 8. Employee Safety Performance Metrics ......................................................... 57 Table 9. Public Safety Performance Metrics ............................................................... 57 Table 10. Customer Satisfaction Performance Metrics ............................................... 58 Table 11. Plant Performance Metrics........................................................................... 58 Table 12. Cost Performance Metrics ........................................................................... 59 Table 13. System efficiency Performance Metrics...................................................... 59 Table 14. Customer Engagement Performance Metrics .............................................. 60 Table 15. Network Support Services Performance Metrics......................................... 61 Table 16. Environmental Goals Performance Metrics................................................. 61 Table 17. Potential risks of using performance incentives: mitigation and avoidance 62 Table 18. Possible frameworks for electricity network price regulation in Estonia.... 66
  • 6. v LIST OF FIGURES Figure 1. Cost of service regulation and performance (incentive)-based regulation..... 7 Figure 2. Allowed revenues under cost-of-service regulation....................................... 8 Figure 3. Costs and prices under a performance-based regulation................................ 9 Figure 4. Regulation of selected power and utilities in Europe................................... 10 Figure 5. Conceptual illustration of a performance-based price regulation................. 12 Figure 6. Implementation of a performance-based regulation..................................... 13 Figure 7. The Balanced Scorecard Framework............................................................ 16 Figure 8. An example Strategy Map and its connections to the Balanced Scorecard . 18 Figure 9. A conceptual illustration of electricity sector price regulation in Estonia ... 21 Figure 10. Average prices of network service operators in Estonia 2006 – 2015 ....... 25 Figure 11. Average price of network service in Estonia 2006 – 2015......................... 25 Figure 12. A potential Strategy Map of an electric utility under a performance-based price regulation............................................................................................ 42 Figure 13. A potential Strategy Map and its KPI’s for an electric utility under a performance-based price regulation............................................................ 67
  • 7. vi ABBREVIATIONS BSC balanced scorecard CAIDI customer average interruption duration index CAPEX capital expenditure CPI consumer price index DSO distribution system operator EBITDA earnings before interest taxes depreciation and amortisation EVA economic value added GWh gigawatt hour KPA key performance area KPI key performance indicator MW megawatt MWh megawatt hour OFGEM office of gas and electricity markets of the United Kingdom OPEX operational expenses PBR performance-based regulation RAB regulatory asset base R&D research and development RoR rate on return RPI retail price index RPI-x retail price index minus x SAIDI system average interruption duration index SAIFI system average interruption frequency index TWh terawatt hour TSO transmission system operator VAT value added tax WACC weighted average cost on capital
  • 8. vii ABSTRACT Uiga, J. Transitioning to a performance-based electricity network price regulation in Estonia. A case study. Master’s Thesis, Estonian Business School, Tallinn, 2017, 72 pages, 13 figures, 18 tables, 61 references, 6 appendices, in English. PERFORMANCE-BASED PRICE REGULATION, STRATEGY MAPS, ELECTRICITY NETWORK COMPANY, ELECTRIC UTILITY, CASE STUDY, NON-ZERO SUM GAME, DSO, TSO, ENERGY REGULATION. The aim of the Master’s Thesis was to identify the possibilities of transitioning to a performance-based electricity network price regulation in Estonia and its impacts to the management of the network companies. To attain the set goals, the author conducted an initial literature review and in conjunction with the results of semi-structured interviews developed a possible framework for a performance-based price regulation in Estonia. In total, 12 semi- structured interviews were conducted with the members of the boards of the largest Estonian electricity network companies and energy regulators with experience in the field. The case study research methodology was used to generate ideas and insights from the data and interviews. Based on the results of the research, the author proposed two ways of changing the existing electricity network price regulation: a) amending (upgrading) the existing framework; b) transitioning to a performance-based price regulation. To describe the impacts of transitioning to a performance-based price regulation for an electric utility, a Strategy Map was compiled. The ideas and insights presented in this thesis can be applied in natural monopolies, that own or operate an infrastructure (e.g. gas networks). The results can be used by legislators to design and implement a performance-based price regulation framework for Estonia.
  • 9. 1 INTRODUCTION Electricity is a service, that is widely used. The final cost of electricity consumption is determined by taxes and levies by the government, electricity network tariffs and the price of electrical energy. Under the conditions of a competitive market the unit price of a good or a service forms based on both supply and demand. In the cases of market dominance (i.e. monopoly) no competition occurs and the task to simulate competition is generally given to a regulator. Until recent years, for Estonian electricity consumers, both the cost of electrical energy and network fees, was determined in a regulated market. As electricity production and supply is an ordinary monopoly instead of a natural monopoly, the liberalisation of this sector was possible. Estonian electricity market was fully liberalised (opened to competition) in 01.01.2013 (Majandus- ja kommunikatsiooniministeerium 2017). The electricity network companies are natural monopolies (similarly to natural gas and public water supply). Therefore, the unit price of the network service cannot be formed based on competition. Economic regulation of monopolies, especially natural monopolies, is necessary. If the monopolies are left unregulated, the companies might use their market power to limit third party access to their services or products (Tirole 2015, 1668-1669). The consumers, having no alternatives, would then have to accept unreasonably high prices. In Estonia, the price regulation of the electricity network companies is conducted based on the Competition Act (Riigikogu 2015) and Electricity Market Act (Riigikogu 2017). The aim of the network price regulation is to ensure that the consumer receives a quality service with a reasonable price, while maintaining the economic sustainability of the network company. The general principles of the price regulation of the Estonian energy sector were first introduced in 1998. The specific price regulation of the Estonian electricity network companies was set by the entry into force of the Electricity Market Act in 2003 (Uukkivi et al. 2014, 228). An ex-ante regulation model is used, which
  • 10. 2 allows the regulator (Estonian Competition Authority) to assess, whether the costs made by the company are reasonable and fair. This is done based on the data received from the companies and benchmarking. The network company is allowed to earn a reasonable return, which is calculated on the basis of the company’s assets and the weighted average cost of capital (WACC). In a situation, where the majority of the electricity network was constructed during 1955 – 1985 and network operators had to make up for significant underinvestment during 1985 – 1997 (Elering 2010, 31; Vali 2014), linking the allowed return with the value of the company’s assets was an effective motivator. The service quality of Estonian electricity distribution has since significantly improved (Konkurentsiamet 2015, 22). What is more, the average network tariffs have fallen compared to 2005 (in real terms – i.e. the inflation has been rising faster than the network tariffs) (ibid 2015, 10). The current regulation system is similar to a negative sum game. In cases where the consumer wins (reduced electricity bill), the company loses in profit, EBITDA or sales revenues (economic sustainability) and in cases where, the company gains a higher profit, the consumers will have to pay more. Negative changes in the network company’s financials might have significant impacts to the company’s financial health, as the investments are made using foreign capital. This, in turn may contribute to the decline of service quality in the long run. To facilitate the fulfilment of the 2030 climate and energy goals of the EU, on 30th of November 2016 the European Commission published several draft legislative proposals (so-called “Clean Energy Package”). The aim of these legislative proposals is to increase energy efficiency, facilitate the uptake of renewable energy and increase the consumer’s participation in the energy market (European Commission 2016). The electricity network companies have a major role to play in attaining the 2030 goals. The current price regulation in Estonia fulfils the goal of providing a quality service at a reasonable price. However, it might not incentivise the companies to take up new and innovative solutions in order to reduce consumption, increasing the share of renewables nor facilitating the active participation of the consumers. To incentivise the natural monopoly to make useful decisions for the consumers, some countries (UK, Germany, USA, Australia) have started using performance-based price regulation.
  • 11. 3 Considering the implications of price regulation to the consumers and the companies, creating a non-zero sum game (a win-win solution) in electricity transmission and distribution price regulation is an important topic yet to be addressed in Estonian legislative environment. A possible way of creating a non-zero sum game is utilizing a performance-based price regulation, where the utility’s profits are decoupled from its costs and are tied to the relative performance to specific benchmarks. The aim of the Master’s Thesis is to identify the possibilities and challenges of transitioning to a performance-based electricity network price regulation in Estonia and its impacts to the management of the network companies. The aim of the thesis will be achieved by answering the following questions: 1. Whether and how should the current price regulation be improved to foster an Estonian electricity network company’s economic sustainability? 2. What should a performance-based price regulation framework look like in Estonia? 3. What would an electricity network company’s Strategy Map look like after transitioning to a performance-based price regulation? In order to answer these questions, both literature review and semi-structured interviews will be used within the framework of case study research. Based on the literature overview the author will describe the possible framework for a performance-based price regulation. In parallel, 12 semi-structured interviews are conducted with the senior level management of the largest Estonian electricity network companies and energy regulators with experience in the field. The thesis consists of three chapters. In the first chapter, a literature overview of the topic and previous research is given. The second chapter focuses on the research methodology and design. In the third chapter, the results of the research are presented, followed by a discussion on their implications and relevance. The author of the thesis would like to thank the supervisors, interviewees and all others, who have helped during the compilation of the thesis. Special gratitude is given to the author’s girlfriend for her enormous patience and support.
  • 12. 4 1. LITERATURE REVIEW 1.1. Monopolies and regulation Competitive markets are the most efficient way of producing and selling goods or services (Pérez-Arriaga 2013, 152). In the competitive market “above-normal profits are constantly being eliminated by competition, while new sources of profit are being created through innovation” (Cowen & Tabarrok 2013, 229). Under certain circumstances, the conditions required for an acceptable level of competition are not present, however. In other words, markets can fail as a result of market concentration, economies of scale, public goods, externalities, incomplete information or transaction costs. Market failures must be corrected by regulatory intervention to ensure the optimal outcome for society. (Pérez-Arriaga 2013, 152) There are two main types of monopolies: a) natural monopolies – usually networks, can be characterised by one or more of the following features: economies of scale, capital intensity, non-storability with fluctuating demand, location-specific delivery generating location rents, direct connections to customers (Pérez-Arriaga 2013, 152-153); b) ordinary monopolies – can either be administrative or non-administrative. Administrative monopolies occur, when competition is prohibited by law, non- administrative monopolies occur, when the entrance to the market is impossible or extremely difficult for new competitors. In case of ordinary monopolies, the monopoly position may disappear, when the administrative restrictions are removed or other market developments occur (Ots 2016, 10). An unregulated monopoly would be able to charge consumers a price much higher than its (justified) production costs or restrictions to third-party access (Schmalensee & Willig, 1989, 1454). Therefore, in cases of market dominance (i.e. monopoly) where competition occurs, the task to simulate competition (ensure the optimal outcome for society) is given to a regulator.
  • 13. 5 Regulators can affect the monopolies in several ways (Tirole 2015, 1667): 1. Regulation of rate of return and monitoring of the conditions under which monopolies allow third-party access to the bottlenecks (networks) they control. 2. Allowing or invalidating horizontal or vertical mergers or agreements, monitoring for abuse of dominant position. 3. Patent granting, upholding or rejection. Each form of regulation described above, faces a trade-off between lowering price for the consumers and granting a fair return for the firm (Tirole 2015, 1667). Therefore, the appropriate regulation has two conflicting objectives (Pérez-Arriaga 2013, 153): 1. Ensuring that the allowed revenue is high enough to guarantee the economic and financial sustainability of the company. 2. Ensuring that the allowed revenue is low enough to facilitate productive efficiency for providing the service or product at the lowest possible cost. According to Tirole (2015, 1669-1670), the profits of a monopoly should be regulated based on the specificities on the regulated sector. The profits should be regulated only when the market power is not deserved (Table 1). A public utility should earn reasonable profit from investment, but not benefit from lucky cost and demand conditions. For example, it should not be able to benefit from a fall in the market price of a key input, while being able to renegotiate the regulatory contract if that price shoots up. Table 1. Deserved and underserved market power (Tirole 2015, 1670) Parameter Market power is deserved Market power is undeserved Concession Competitive, well-designed auction Unpaid-for legal monopoly Intellectual property Major innovation Obvious, not novel innovation Utility regulation Investment/effort Lucky cost and demand conditions In the following chapters, the author focuses on the regulation of electricity networks.
  • 14. 6 1.2. Price regulation of electricity network companies 1.2.1. Traditional regulation and performance-based regulation The aim of the network price regulation is to ensure that the consumer receives a quality service with a reasonable price, while maintaining the economic sustainability of the network company. According to Ots (2016, 127-128), a perfect solution occurs, when: 1. The company has reached the maximum cost efficiency (efficient operational costs, high technical efficiency). 2. The investments are made in optimal manner to new technology by avoiding both under and overinvestment. 3. The service has high quality. 4. The company ́s return is justified and in accordance to its effective cost of capital. 5. The administrative burden is on optimal level. However, finding a methodology, that ensures the fulfilment of all these objectives, is rather complicated. It is possible to come up with a regulation close to the perfect one, but the perfect result can only be obtained in a free market situation where the price level is determined by competition. The regulation of electric power grids can be reduced to three main aspects: i) investment; ii) access and iii) pricing or network cost allocation. According to Pérez- Arriaga (2013, 270) the aims of the regulation are: 1. Contributing to an efficient network expansion. 2. Ensuring the economic viability of the transmission business through suitable remuneration. 3. Furthering the economic efficiency for network users both in the short term (attainment of optimal operation) and the long term (sending correct locational signals for future network users, whether they be generators or consumers). 4. To contribute to the efficient operation of the network and the appropriate maintenance of its facilities. The price regulation of electric utilities can be divided into two main categories (Figure 1) (Comnes & Holl 1995, 1; Aggarwal & Burgess 2014, 50):
  • 15. 7 1. Traditional price regulation (also cost-of-service or rate-of-return regulation), where the utility’s rates are mainly based on incurred costs (taxes, investments, operating expenses) plus a reasonable return. 2. Performance-based price regulation (also incentive regulation, output-based regulation or performance-based ratemaking), where the utility’s profits are decoupled from its costs and are tied to the relative performance to specific benchmarks. The regulatory methods can also be divided into ex-ante and ex-post methods. In ex- ante regulation, the prices that the company can charge are to be approved by the regulator. In ex-post regulation, the prices or fees can be applied by the company without any prior approval by the regulator, but the regulator may control later whether these prices or fees meet the criteria set by the legislation. The alleged advantage of incentive-based regulation is that prices and costs can be lowered in the long term, even if short-term prices rise (Pérez-Arriaga 2013, 125). This is illustrated in the graph below (Figure 1). Figure 1. Cost of service regulation and performance (incentive)-based regulation. Author’s drawing adopted from Pérez-Arriaga (2013, 152-153) A classical weak point of cost-of-service regulation (Figure 2) as the method for setting the rate of return is the so-called Averch-Johnson effect (1962, 1068). A company allowed a rate of return higher than the true cost of capital has an incentive to over- invest, giving rise to economic inefficiency. Conversely, if the rate of return is lower Price = Cost 0 0.5 1 1.5 2 2.5 3 3.5 4 4.5 5 5.5 6 0 0.5 1 1.5 2 2.5 3 3.5 4 4.5 5 Cost Time Performance-based regulation Cost of service regulation Cost
  • 16. 8 than the cost of capital, the utility will invest very little and its operating costs will rise, likewise generating economic inefficiencies. Therefore, under traditional regulation, the utility rates rather motivate utilities (network companies) to overinvest fixed assets than provide adequate incentives for productivity improvements. Traditional cost-of-service regulation was originally designed in an era of significantly increasing sales and decreasing marginal costs, where the primary decisions required by utilities were related to how much and what type of generation and transmission to build to meet growing customer demand, and where the main goal was to ensure just and reasonable rates. The conditions currently facing the utility industry have changed considerably. (Whited et al 2015, 6) Figure 2. Allowed revenues under cost-of-service regulation. Author’s drawing adopted from Pérez-Arriaga (2013, 158). The traditional regulatory framework is similar to a negative sum game. In cases where the consumer wins (reduced electricity bill), the company loses in profit, EBITDA or sales revenues (economic sustainability) in cases where, the company gains a higher profit, the consumers will have to pay more. Negative changes in the network company’s financials might have significant impacts to the company’s financial health, as the investments are made using foreign capital. This, in turn would contribute to the decline of service quality in the long run. These issues can be tackled with a well-designed performance-based regulation includes both incentives and penalties for exceeding or missing the expected performance (Aggarwal & Burgess 2014, 4). Under a performance-based regulation the tariffs or revenues the company is authorised to charge or receive are kept in place for Operating costs Depreciation Allowed returns Others Allowed costs Approved capital investment Regulated assets Rate of return + −
  • 17. 9 longer intervals (typically 4 or 5 years). This provides an incentive for the company to lower its costs and be more efficient than under cost-of-service regulation. The resulting efficiency improvements are considered by the regulator in the following price control, and therefore the consumers also benefit (Figure 3). Figure 3. Costs and prices under a performance-based regulation. Author’s drawing adopted from Pérez-Arriaga (2013, 158). The two most commonly used methods are price caps and revenue caps, where the revenues that the company may charge are set for the regulatory period with a formula that includes a yearly adjustment factor (RPI-X or CPI-X) (Pérez-Arriaga 2013, 165- 169). Under price caps, any increase in sales leads to higher revenues i.e. costs are assumed to increase proportionally with sales. Under revenue caps, by contrast, receipts do not rise in direct proportion to sales, but only in keeping with the selected cost drivers and in the proportion established. A variation on rate-of-return regulation often used in combination with both price and revenue caps is the sliding scale (essentially a mechanism for sharing earnings and losses). This method provides a mechanism for the utility and consumers to share the risk of very high earnings or losses. (Pérez-Arriaga 2013, 169) Choosing the right regulative mechanism is not as straightforward as one might think. Each country has their unique situation, that has to be taken into account when designing the regulation. In any case, the framework should be transparent and fair to ensure the interests of investors. In the following chapter, a short overview of the Benefit to consumer (lower prices) Benefit to firm (higher profit) 0 0.5 1 1.5 2 2.5 3 3.5 4 4.5 0 1 2 3 4 5 Priceorcost Time Current price or cost Expected improvement (RPI-X) Actual improvement
  • 18. 10 existing electricity network price regulation systems is given. From chapter 1.2.3, the principles for transitioning to a performance-based price regulation, can be found. 1.2.2. Regulation models used for electricity networks The dominant approach to regulation in electricity in the EU is one that takes the Regulatory Asset Base (RAB) as its underlying structure (EY 2013, 7). However, the methods are highly nuanced (Figure 4). The uptake of performance-based (incentive- based) regulation in Europe is developing at a slow pace. For example, Norway introduced incentive regulation with efficiency benchmarking in 1997, while Germany decided to move forward with a performance-based regulation in 2009 (Nepal & Jamasb 2015, 1). Figure 4. Regulation of selected power and utilities in Europe. Grey – cost plus; dark green – incentive-based; light green – combination of models; blue – revenue/price/income cap. Author’s drawing adopted from EY (2013, 7). A recent analysis by the European Commission (2015) states, that apart from Great Britain, current incentive-based regulatory schemes in EU Member States place little emphasis on characterizing the outputs delivered by the distributor, but for quality of service schemes in some countries. The distribution activity is currently going through major changes, which may affect the structure of optimal regulatory schemes.
  • 19. 11 “An investment cycle is being spurred by the need to increase the distribution network’s capacity to host an expanding fleet of renewable generators.” Jamasb and Pollilt (2007) have also noted, that In closing, we note the impact of future innovation on network regulation. Technological progress has in the past and will continue in the future to transform the nature and economics of networks. It is therefore very important that any regulatory framework will provide the right incentives for innovation and adoption of new technologies in the networks. It is also important that the regulatory system is flexible. /…/ This implies that European electricity regulators should take into account the power and long-term effects of incentive schemes in influencing the features and behaviour of regulated firms. /…/ Regulatory models will therefore need to be reviewed and evolve constantly to meet the needs of future networks. /…/ A partially implemented reform can indeed be less desirable than a non-reformed sector. Moving towards a low-carbon future requires development of smart grids, smart metering, electro-mobility and storage. Innovation in the power system and electricity markets does not come without risks. For dealing with the risks arising from the ongoing energy transition, a proper regulatory framework needs to be in place. According to Nepal and Jamasb (2013, 194) “The future security, stability and resilience of European electricity networks are linked to flexible and innovative regulatory mechanisms that incorporate local, regional, continental as well as international considerations.” 1.2.3. Designing a performance-based price regulation As stated in the previous chapters, each country has their unique situation, that must be considered when designing the regulation. In case of electricity network companies, designing a performance-based price regulation should begin with stakeholder consultations to define the goals for the electricity system (Table 2). Table 2. Key principles for designing a performance incentive mechanism (Whited et al 2015, 57) Area Key principles Regulatory context Articulate policy goals Recognize financial incentives in the existing regulatory system Design incentives to modify, supplement or balance existing incentives Address areas of utility performance that have not been satisfactory or are not adequately addressed by other incentives Performance metrics Tie metrics to policy goals Clearly define metrics Ensure metrics can be readily quantified using reasonably available data
  • 20. 12 Area Key principles Adopt metrics that are reasonably objective and largely independent of factors beyond utility control Ensure metrics can be easily interpreted and independently verified Performance targets Tie targets to regulatory policy goals Balance costs and benefits Set realistic targets Incorporate stakeholder input Use deadbands to mitigate uncertainty and variability Use time intervals that allow for long-term, sustainable solutions Allow targets to evolve Rewards and penalties Consider the value of symmetrical versus asymmetrical incentives Ensure that any incentive formula is consistent with desired outcomes Ensure a reasonable magnitude for incentives Tie incentive formula to actions within the control of utilities Allow incentives to evolve These goals could fall into a range of categories from cost to environmental performance. It is important to develop clear methodologies for calculating performance (or for underperformance) before the new framework is put in place. The utility needs to have sufficient time to reorient its business (Gimon et al 2013). An example of the relationships between utilities and the regulator after transitioning to a performance-based price regulation can be seen from Figure 5. Figure 5. Conceptual illustration of a performance-based price regulation. Author’s drawing adopted from Aggarwal & Burgess (2014, 51). It is important to note that, performance metrics and incentives can be applied in any regulatory context (incl. in a system, where historically cost-of-service regulation Retail level: •reliable service •customer satisfaction •innovative third- party services Outcomes Meet goals Receive rewards and/or penalties Utilities Set performance goals Establish reward & penalty structure Monitor results Regulators Wholesale level: •system-wide least cost •reliability •innovation
  • 21. 13 is used) (Whited et al 2015, 15). In case of the latter, performance metrics and incentives can be designed to complement the existing regulatory incentives. The steps for implementation of a performance-based regulation can be found in Figure 6. Figure 6. Implementation of a performance-based regulation. Author’s drawing adopted from Whited et al (2015, 5) and Aggarwal & Burgess (2014, 50). Additional insights on traditional performance areas and associated performance metrics can be found in Appendix 1. 1.2.4. Risks of using performance incentives Similarly to all other regulatory mechanisms, the success of performance a specific performance incentive is dependent upon its design and implementation. Potential risks to be avoided or mitigated vary from disproportionate rewards to gaming and manipulation of the results. The key risks are outlined in Table 3, additional information can be found from Appendix 2. 1. 2. 3. 4. 5. Articulate goals - identify and articulate the energy policy goals applicable to utility regulation (present and future) Assess current incentives – assess and understand the financial incentives in place (incl. within the company) under the current or expected regulatory environment. New performance incentives should be designed to modify, balance or supplement the existing schemes in place. Identify performance areas Establish performance metrics – use performance metrics to monitor the areas defined in step 3. Analyze the results to identify performance areas that may require targets. Establish performance targets – establishing targets will provide for a common understanding of the performance expected by the regulators. Review and analyze the results to determine possible rewards or penalties for a performance area. 6. Establish penalties and rewards (as needed) – establish rewards or penalties to provide concrete financial incentives for maintaining (or improving) performance. 7. Evaluate, improve, repeat – creating a performance incentive mechanism is an iterative process. Targets, financial incentives and other components may need to be adjusted several times before reaching the optimal solution.
  • 22. 14 Table 3. Potential risks of using performance incentives: mitigation and avoidance (Whited et al 2015, 53-56; Pérez-Arriaga 2013, 172-173) Risk Measures for mitigation and avoidance Disproportionate rewards (or penalties) Rewards or penalties are too high or based on factors beyond a utility’s control Incremental approach, shared savings. Unintended consequences Utilizing the performance incentive results in unintended consequences (e.g. lower service quality)1 Implementing a diverse and balanced (comprehensive) set of incentives, focusing on performance areas that have less interconnections with other areas (e.g. energy efficiency). Regulatory burden Performance incentive is too costly, time- consuming for the regulator and other stakeholders, becoming an unnecessary distraction Streamlining the existing processes, simplify when possible, verify, that the reward or penalty is proportionate to the goal. Uncertainty Metrics, targets and financial consequences are not clearly defined, significant and frequent changes to incentives Specify the definitions of metrics and targets before implementation, ask for stakeholder inputs when necessary, provide examples (case studies) based on historical data, information availability, gradual adjustment of incentives. Gaming and manipulation Utility takes a shortcut for achieving a target in a way that was no intended or deliberately alternates or obscures unfavourable performance data Provide clear definitions for the metrics, monitor effectiveness and adjust when necessary, incremental approach, simplify. As can be seen from the table above, in most cases, the potential can be managed through a well-thought and comprehensive design and implementation of performance metrics and incentives. Ongoing evaluation of and improvements to the incentive mechanisms can also be used for mitigating the risks. 1 According to Pérez-Arriaga (2013, 172-173) a weak point of a performance-based regulation is that that is incentivises the companies to lower costs in operation or investment. This may lead them to do so at the expense of service quality. For this reason, such regulatory mechanisms should not only regulate revenues, but should also set other objectives to be met by the company (e.g. service quality). When the company fails to comply with the established standards, it would be financially penalised (reduction of allowed revenues), thereby reducing the risk of unintended consequences.
  • 23. 15 1.3. Balanced Scorecard and Strategy Maps 1.3.1. Strategy and the Balanced Scorecard As stated in chapter 1.2.3, when implementing a performance-based price regulation, the utility needs to time to reorient its business and thereby strategy. “An organisations strategy describes how it intends to create value for its shareholders, customers and citizens” (Kaplan & Norton 2004, 4). One of the goals of this thesis is to describe the impacts of transitioning to a performance-based price regulation to the Estonian electricity network companies. For describing the impacts, the author could choose from a myriad of management tools available for describing an organisation’s strategy and provide for its successful implementation. As stated in chapter 1.2.4, the performance-based price regulation should be well- designed and comprehensive (i.e. targeting several aspects of the business). Therefore, a comprehensive approach to changing the company’s strategy is also needed. The author of this thesis decided to use the Balanced Scorecard (BSC), more specifically the Strategy Maps framework developed by Kaplan and Norton (2004). This was done because, the BSC is not only a tool for recording and illustrating a small number of key performance indicators (Mackay 2005, 4), it also offers a framework for describing strategies for creating value by focusing on four perspectives (Figure 7). “These four perspectives link together in a chain of cause-and-effect relationships. Enhancing and aligning tangible assets leads to improved process performance, which, in turn, drives success for customers and shareholders” (Kaplan & Norton 2004, 4). What is more, BCS is widely used as a management tool. According to Bain & Company (2015), the Balanced Scorecard was the 5th most used management tool in 2015. The Scorecard also facilitates many principles within ISO 90001 (Rusjan & Alic 2010) and is suitable for both the public sector and private sector entities (Kaplan & Norton 2004, 7). The Balanced Scorecard approach has also been successfully used by several electric utilities (Niven 1999; Neely et al. 2006; PowerStream 2014; Nampower 2014; Precorp 2017), including National Grid plc (AMEC 2012), which has been subject to an incentive regulation since the beginning of 1990s (Weyman-Jones 1990).
  • 24. 16 Figure 7. The Balanced Scorecard Framework. Author’s drawing adopted from Mackay (2005, 11). In essence, a Balanced Scorecard defines what management means by "performance" and measures whether the desired results are being achieved. Using the Balanced Scorecard, the company’s Mission and Vision Statements are translated into a comprehensive set of objectives and performance measures that can be quantified and appraised. 1.3.2. Limitations and critique Not all experts show their support towards the Balanced Scorecard. For example, Jensen (2002), contends, that the approach does not give managers a single-valued measure of how they have performed. According to him, the organisation (and its divisions) should “define a true score for measuring performance”. This will enhance their contribution to the firm. According to Norreklit (2000, 82), there is not a causal but rather a logical relationship among the areas four perspectives of the BCS. Customer satisfaction does not necessarily yield good financial results. Assessing the financial consequences of increased customer satisfaction or quality improvements requires a financial calculus. Chains of action which yield a high level of customer value at low costs lead to good financial results. /…/ Therefore, the balanced scorecard makes invalid assumptions, which may lead to the anticipation of performance Internal View External View Developmentfocus Activitiesfocus Learning & Growth Objectives and performance measures associated with the development of enabling culture and competences Financial Objectives and performance measures associated with the shareholders’ perception and expectation of the organisation Internal Business Processes Objectives and performance measures associated with the organization's internal productive processes Customer Objectives and performance measures associated with the customers’ perception od an interaction with the organisation
  • 25. 17 indicators which are faulty, resulting in sub-optimal performance. /…/ We therefore conclude that the balanced scorecard needs to be adjusted and developed. Casey and Peck (2004, 5) went even further to state that in companies with many different divisions, the individual divisions can often develop tunnel vision. They may achieve their own success at the expense of others or the organization unintentionally. In practice, many companies end up in a cycle, where they think the measures are the big and vital part of the BSC. In real business processes, too many measures will confuse people, and it won’t even be used as part of day-to-day business management. Palmer and Parker (2001, 993) suggest that a key factor in developing a successful Balanced Scorecard is the identification of aggregate level measures. Rather than having accurate product costing as the focus, organisations can make large gains by identifying and focusing on one or two critical input drivers. Nevertheless, these obstacles can be overcome and have been overcome by many companies. 1.3.3. Strategy Maps As can be seen from chapter 1.3.2, the Balanced Scorecard by itself may not be sufficient, as it does not describe the cause-and-effect linkages among the four BSC perspectives. For this reason, Kaplan & Norton (2004) developed the Strategy Map (Figure 8). “…a strategy map provides a uniform and consistent way to describe a strategy, so that objectives and measures can be established and managed”. In essence, a Strategy Map is a communication tool, that is used to tell a story, how value is created (Kaplan & Norton 2004, 9). The Strategy Map is based on several principles (ibid, 10): 1. Strategy balances contradictory forces – short term results (cost cutting) may not translate into profitable revenue growth in the long-term. 2. Strategy is based on differentiated customer value proposition – the source of sustainable value creation is satisfying customers. 3. Value is created through internal business processes – internal processes determine how the organisation will implement its strategy and sustain value creation.
  • 26. 18 4. The value of intangible assets is determined by strategic alignment – the value of intangible assets (human, information and organisation capital) is derived from their ability to help the organisation implement its strategy. Figure 8. An example Strategy Map and its connections to the Balanced Scorecard Author’s drawing adopted from Kaplan & Norton (2004). In essence, a Strategy Map shows a logical step-by-step connection between the organisation’s strategic objectives, its internal processes and tangible and intangible assets. The Map is built upon the BSC framework, linking together all of the four perspectives (learning and growth, internal, customer, financial). For instance, improving performance in the Learning and Growth perspective, enables the organisation to improve its Internal Processes. This, in turn, enables the company to create desirable results in the Customer and Financial perspectives. Customer Value Proposition Productivity Strategy Operations Management Processes Supply Production Distribution Risk Management Customer Management Processes Selection Acquisition Retention Growth Innovative Processes Opportunity Identification R&D Portfolio Design / Develop Launch Regulatory and Social Processes Environment Safety and Health Employment Community Human Capital Information Capital Organisational Capital Product / Service Attributes Long-Term Shareholder Value Improve Cost Structure Increase Asset Utilisation Expand Revenue Opportunities Enhance Customer Value Growth Strategy Relationship Image Price Function Service Partnership BrandQuality Availability Selection Culture Leadership Alignment Teamwork Financial Perspective Customer Perspective Internal Perspective Learning & Growth Perspective
  • 27. 19 2. RESEARCH METHODOLOGY 2.1. Research design The selection of research design is based on research strategies, research choices and time horizons (Saunders et al. 2009, 136). It is important to apply a strategy, that enables the author to answer the research questions and achieve the aim of the research. The aim of the thesis will be achieved by answering the following questions: 1. Whether and how should the current price regulation be improved to foster an Estonian electricity network company’s economic sustainability? 2. What should a performance-based price regulation framework look like in Estonia? 3. What would an electricity network company’s Strategy Map look like after transitioning to a performance-based price regulation? Case study research methodology was chosen to answer the research questions defined above. According to Yin (2014, 4) using case study method is relevant, when the research when answering the research questions requires an extensive and in-depth description of some social phenomenon. Saunders et al. (2009, 146) further elaborate, that case study strategy helps to generate answers to questions “why?”, “how?” and “what?”. Yin (1993, 13) defines the case study method as “an empirical inquiry that investigates a contemporary phenomenon within its real-life context, especially when the boundaries between phenomenon and context are not clearly evident”. A case study can be based on real or hypothetical cases (Gerring 2006, 153; 160). Working examples of using a performance-based (incentivising) price regulation are available, but not widely spread as the area is still evolving. This means, that for answering the research questions described above, both primary and secondary data are
  • 28. 20 needed. Conducting a case study research involves using multiple sources of evidence (Robson 2002, 178). The aim of a case study research can be describing, understanding, predicting and controlling (Woodside 2010, 1). In this thesis, the: 1) the possibilities of transitioning from the current price regulation framework to a performance-based price regulation are described; 2) the impacts of the transition to the network companies are understood and predicted. Performance-based price regulation has so far not been used in Estonia, traditional, fully tested and working regulation model (cost of service regulation) is used instead. Transitioning to a completely new regulation framework will need a thorough analysis and assessment of impacts. Therefore, this research will need to provide the basis of further research and analyses needed to be done before implementing a performance-based price regulation. Therefore, an exploratory single-case case study method is used. The purpose of an exploratory case study research is “to identify the research questions of procedures to be used in a subsequent research study, which might or might not be a case study” (Yin 2014, 238). The object of the research is the price regulation of Estonian electricity network companies. The case analysed was hypothetical. The research was structured into three stages: 1. Compilation of a performance-based price regulation framework for Estonia based on literature review and semi-structured interviews. 2. Conducting semi-structured interviews with senior-level managers of Estonian electricity network companies to: a. get feedback on the proposed framework; b. get insights on how the company is currently managed and what would need to change under the new framework. 3. Compilation of a strategy maps. During the first stage the author used secondary resources, including both research papers and non-scientific material available in the internet to get insights on the performance-based price regulation frameworks currently in use. The information
  • 29. 21 gathered was summarised and presented to the interviewees for discussion (second stage). In the final phase of the research, the author analysed the data and identified the most important themes to find answers to the research questions. The goal of the case study research was to gain a rich understanding of the context of the research and not to report facts. The interviews (excluding the interview with the employees of United Kingdom’s energy regulator - OFGEM) were conducted in Estonian to minimise the risk of the interviewees altering their expression due to language limitations. As this paper was compiled in English, the direct quotes presented have been translated into English by the author. While translating, the author made sure not to change the style of the interviewees. 2.2. Background of the analysed case 2.2.1. Electricity market in Estonia According to Elering AS (2017) the electricity production in Estonia in 2016 amounted to 10,4 TWh (á 15% vs 2015). The imports were 3,40 TWh (â 35% vs 2015) and exports 5,32 TWh (â 12% vs 2015). Electricity consumption in Estonia (incl. transmission and distribution losses) was 8,38 TWh (á 3% vs 2015). In total, there are 0,73 million consumption points (Konkurentsiamet 2016a) in Estonia. Figure 9. A conceptual illustration of electricity sector price regulation in Estonia Author’s drawing adopted from Pérez-Arriaga (2013, 137). Generation (competitive) Transmission (regulated) Distribution (regulated) Retailing (competitive) G1 G2 Gi C1 C2 Cz Transmission D1 DjD2 ... ... ...
  • 30. 22 Until recent years, for Estonian electricity consumers, both the cost of electrical energy and network fees, was determined in a regulated market. As electricity production and supply is an ordinary monopoly instead of a natural monopoly, the liberalisation of this sector was possible. Estonian electricity market was fully liberalised (opened to competition) in 01.01.2013 (Majandus- ja kommunikatsiooniministeerium 2017) (Figure 9). There is one transmission service operator (TSO) in Estonia – Elering AS. The number of Distribution service operators (DSOs) amounts to 34. The largest of them - Elektrilevi OÜ has a market share of 86% (Konkurentsiamet 2016b) (Table 1). Table 4. Electricity network operators in Estonia in 2015 (Elering AS 2016; Elektrilevi OÜ 2016; VKG Elektrivõrgud OÜ 2016; Imatra Elekter AS 2016; Konkurentsiamet 2016a). Author’s calculations. Parameter Elering AS Elektrilevi OÜ VKG Elektrivõrgud OÜ Imatra Elekter AS Number of consumption points, 1000 pcs 0.233 660.6 36.6 25.1 Length of electric lines, 1000 km 5.50 60.50 - 3.03 Distribution or transmission service sales, TWh 7.47 6.52 0.20 0.21 Property, plant and equipment and intangible assets, million € 768.6 897.0 28.4 22.7 Sales revenue, million € 127 248.4 12.1 15.2 incl. sales revenue from distribution or transmission services), million € 85.8 237.4 7.74 9.48 EBITDA, million € 78.6 106.8 3.4 3.1 Net profit, million € 25.1 49.5 1.4 1.57 Investments, million € 93.1 93.3 0.63 2.1 Dividends, million € 20 22.4 1.2 0.6 Average price of network service (without VAT), €/MWh 11.5 36.4 38.0 46.2 Interruptions caused by faults (2011- 2015), 1000 pcs 0.04 967.9 24.4 11.7 Interruptions caused by faults due to force majeure (2011-2015), 1000 pcs 0.00 175.0 0.4 2.6 Average outage duration for each customer served (SAIDI) (2011-2015), h 0.8 2.5 0.4 0.9 According to the Estonian Competition Authority (Konkurentsiamet 2016b) the average transmission tariff in 2015 remained unchanged compared to 2014 at 11,8 €/MWh (without VAT). The same applies to the average distribution tariff that amounted to 51,3 €/MWh (without VAT). The average price of electrical energy in 2015 was 31,08 €/MWh (â21% vs 2014). Thereby, the average price of electricity consumption (incl
  • 31. 23 taxes and levies by the government, electricity network tariffs and the price of electrical energy) was 117,3 €/MWh. The quality requirements for network services are established by the regulation “Võrguteenuste kvaliteedinõuded ja võrgutasude vähendamise tingimused kvaliteedinõuete rikkumise korral” (Majandus- ja kommunikatsiooniminister 2016). This regulation obliges the network service operator to keep statistics on every network service interruption occurred. Under extreme weather conditions, the maximum service interruption can be 72 hours, under normal conditions, the service has to be resumed during 12…16 hours. 2.2.2. Electricity network price regulation in Estonia The principles of monopoly regulation in general have been set in the Competition Act (Riigikogu 2015). The specific provisions for the electricity sector are described in the Electricity Market Act. According to the Electricity Market Act, the electricity supply is to be provided at a reasonable price, while meeting environmental requirements, the needs of consumers, and the utilisation of energy sources in a balanced manner. This has to be done in an environmentally clean way and ensuring a long-term perspective. What is more, the electricity undertakings (including electricity network operators) shall facilitate activities performed by consumers for the purpose of conserving electricity. According to the Electricity Market Act (§71 – 73) (Riigikogu 2017), the DSO has the right to establish different distribution tariffs (e.g. based on voltage level). The cost level of the tariffs is validated by the DSO-s proposal for network charges to the regulator (Estonian Competition Authority). So, rather than approving the different tariffs, the regulator approves the network charges to be collected in the DSO-s network. The components included in the total network charge calculation are (Konkurentsiamet 2014, 6): 1. Capital expenditure (depreciation of the Regulated Asset Base (RAB))2 2 RAB (also Regulatory Asset Base) is a number which represents past investments, comprising what investors paid when the assets were originally privatised plus subsequent capital expenditure adjusted for depreciation. Not all of the network operator’s investments are included in the Regulated Asset Base. Some in (e.g. investments already paid for by the consumer, assets which the undertaking is not actually using for the provision of network services etc).
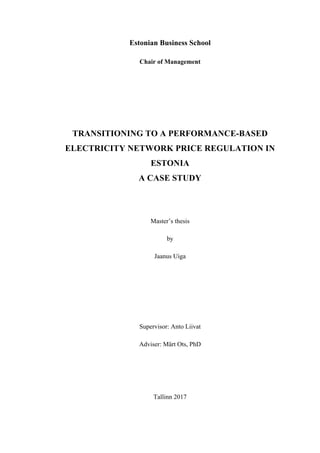
  • 32. 24 2. Variable costs a. Cost of losses b. Cost of transmission (TSO tariff) 3. Operating Costs 4. Justified return (WACC Ï RAB3 ) A sample of a calculation of the allowed revenue of the DSO and the average price of distribution service can be found from Table 5. Table 5. Sample calculation of the allowed revenue of the DSO (Konkurentsiamet 2014, 7). Author’s calculations. Component Unit Value Variable costs (VC) million € 100 Operating costs (OC) million € 45 Capital expenditure (C) million € 45 Justified return (JR = WACC Ï RAB) million € 55 Allowed revenue (R = VC + OC + C + JR) million € 245 Sales volume (S) TWh 6.5 Average price of distribution service (P = R/S) €/MWh 37.7 The average price of network service has, in nominal terms risen for both the three largest DSO’s and the TSO (Figure 10). However, in real terms (adjusted for inflation), the average price of distribution service in Estonia in 2015 was at the same level as in 2006 (Figure 11). This means, that the inflation has risen faster than the network prices. Meanwhile, the network companies have made significant investments into improving the reliability of the service. 3 Allowed income for the DSO. WACC = weighted average cost of capital
  • 33. 25 Figure 10. Average prices of network service operators in Estonia 2006 – 2015 (Elering AS 2016; Elektrilevi OÜ 2016; VKG Elektrivõrgud OÜ 2016; Imatra Elekter AS 2016). Author’s calculations. Figure 11. Average price of network service in Estonia 2006 – 2015 (Elering AS 2016; Elektrilevi OÜ 2016; VKG Elektrivõrgud OÜ 2016; Imatra Elekter AS 2016). Author’s calculations. There is no regulatory period set – both the regulated entities themselves or the Konkurentsiamet can start the process for reviewing the network charges at any given time. Although the preambles of the Electricity Market Act state several objectives to be followed by the electricity undertakings (incl. network operators), the Act does not 0.0 10.0 20.0 30.0 40.0 50.0 2006 2008 2010 2012 2014 Costofnetworkservice,€/MWh Elering AS Elektrilevi OÜ VKG Elektrivõrgud OÜ Imatra Elekter AS 0.0 10.0 20.0 30.0 40.0 50.0 2006 2008 2010 2012 2014 Costofnetworkservice,€/MWh Average distribution service price (nominal prices) Average distribution service price (real prices in €2015)
  • 34. 26 state, how these tasks should be taken into account in the price regulation methodology. This is reflected in the results of the price regulation assessment compiled by the Estonian Competition Authority, where it was stated that the price regulation during the period 2005…2014 has been successful, since the price stability for the consumers has been ensured and the regulated companies have not earned excessive profits (Konkurentsiamet 2015, 22). In addition to the price for the consumers and company’s profits, the analysis also mentions two indicators that the ECA closely monitors – the losses in the distribution network and quality of supply. These aspects, however are not included in the price regulation methodology (Konkurentsiamet 2014). In 2014 a 58% reduction in distribution service losses (586 GWh) had been achieved compared to 2005. The quality of electricity supply is stated to have been significantly improved under normal conditions. The electricity system is still vulnerable to extreme weather conditions. Konkurensiamet (2015, 22) assesses the potential for improving quality of supply low as further improvement would under the existing framework result in a significant increase of the network service costs for the consumer. 2.3. Sampling and the respondent group The author decided to use purposive sampling. In exploratory research, it is not necessary to have a representative sample set, because the goal of the research is not to verify any hypotheses or to make any statistical conclusions. The size of the sample set depends on the circumstances and research goals (Baker and Edwards 2012). Data collection can conclude at the point where theoretical saturation is achieved, meaning that no additional data are being found (Goulding 2003, 69-70). Previous research suggests that around 12 interviews can provide relevant data (Guest at al. 2006, 74). The interviewees (i.e. respondent group) were chose as a non-random sampling of the members of the boards or senior-level managers of Estonian largest electricity network operators. The respondents from Elering AS (transmission network operator) and the
  • 35. 27 three largest distribution network operators (Elektrilevi OÜ, Imatra Elekter AS and VKG Elektrivõrgud OÜ) were contacted directly by the author. The interviewees (12 in total) are listed in Appendix 3. In the study, no specific response is identified by name. Excerpts from the interviews have been anonymised by using abbreviations (i.e. I1, I2, …, I12 etc). This was done to reduce self-censorship during the interview. In some cases, using abbreviations was omitted in order to reduce the possibilities of identifying the respondents indirectly. The 12 interviewees have had 3…20+ years (as of Q2 2017) of experience in the Estonian electricity network companies. None of the interviewed people was younger than 30. The distribution companies, whose members of the boards were interviewed, represented >90% of the electricity distribution service sales in Estonia. 2.4. Data collection The study was based on the primary data collected from the management of the four largest Estonian electricity network companies (semi-structured interviews) and on secondary sources on the available on price regulation and on the network companies themselves. The main sources the author used for secondary data were official webpages of the electricity network companies and energy regulators. The secondary data analysis process was done manually and began with identifying the documented manuscripts on the topic. The information was gathered by scanning for direct quotes, keywords and related issues associated with identified and stated questions. Semi-structured interviews were conducted after the initial literature review. For that, the author prepared 20 questions divided into five categories. This was done based on the literature review (see chapter 1) and author’s own previous experience in the field. The questions can be found in Appendix 4. Data analysis started right after the first interview, which helped to improve the questions for the following interviews. During the first two interviews, the author realised, that it is reasonable and sufficient to cover 5…8 questions per interviewee and focus on the follow-up questions to uncover additional information. The gaps in the information were filled using the public records of the company or the answers of other interviewees from the company.
  • 36. 28 The five categories are presented as follows: 1. The proposed price regulation model and its improvement – the interviewees were presented with a comparison (see Appendix 4) of the current and proposed price regulation framework and asked for their insights 2. Financial perspective – What are the current expectations of the shareholders of their company? What would need to change under the proposed framework? 3. Customer perspective – What are the current expectations of the customers of the company? What would need to change under the proposed framework? 4. Internal Processes perspective – How would the internal processes need to be changed under the new framework? 5. Learning & Growth perspective – How would the company’s employees have to evolve in order to successfully implement the proposed framework. The use of questionnaires was not considered useful for this thesis, as the goal of the research was not to come up with statistical conclusions. Interviews are considered to be one of the most important sources of a case study research and are more commonly used in case study research than surveys (Yin 2014, 110). 2.5. Data analysis Goulding (2002, 110) suggests that transcribing is time-consuming and not always necessary. Hence, the author recorded the interviews to be able to re-listen to them while coding, but the interviews were not transcribed. The initial codes were picked based on the themes emerged from the interviews and based on the author’s professional experience. The next step was to use axial coding, which helped to investigate the relations in the data and uncover the main themes. As described in § 2.3, the first part of the interview was a discussion on the current price regulation and the possible performance-based price regulation framework. The second part of the interview was focused on getting insights on how the company is currently managed and what would need to change under the new framework. The conversations were wide-ranging as different interviewees went into different level of detail and ambiguousness. The level of detail and focus of the conversations also
  • 37. 29 depended on the most crucial topics that the management was dealing at the time of the interview. The data collected during the interviews was coded. The content of the codes varied from specific suggestions to abstract keywords and concepts. The codes were categorised into 3 main categories and into 8 sub-categories: A. Price regulation framework, incl.: 1) Existing price-regulation framework; 2) Potential performance-based price regulation framework. B. Network company’s management, incl.: 1) Financial aspects; 2) Customer expectations; 3) Internal aspects; 4) Learning and growth. C. Further observations, incl.: 1) The future of the network companies; 2) Other observations. Once the data collection and coding was completed, the codes were sorted and reviewed once again. Memos played an important part in this case study research as they provided a bank of ideas that could be revisited. Miscellaneous thoughts and observations that came up during the process, were written down as notes and grouped into categories. For each memo, it was also added where the idea or observation came from. After that the author was ready to summarize the results of the research, including writing answers to the research questions. 2.6. Research limitations Due to the restrictions placed upon a Master’s Thesis, no claim is presented in relation to achieving a substantive representation of the subject. Case study research is argued to be subjective to researcher’s preconceived viewpoints (bias toward verification) and thereby reliability and validity (Flyvbjerg 2006, 221). According to Yin (2014, 15) scientific generalisation of case studies is limited due to
  • 38. 30 sample size. Multiple causation (different variables can contribute to the behaviour or phenomenon that is observed) has also been reported as a disadvantage of utilizing the case study research method (Ragin 1987, 45). These limitations, however are not sufficient for not choosing (or choosing) a case study research design. Regardless of the limitations outlined, case study is a necessary and sufficient method for research tasks in the social sciences (Flyvbjerg 2006, 241). As the interviewees were mostly recruited by chain sampling, the research is subject to biased respondents. However, as the respondents were representative of the target group (senior-level management of Estonian electricity networks), this fact is not of substantial significance to the results of the research. The aim of the research was to chart their views and not to attain universality. One of the key limitations is the large part the interviewer plays in the dialogue. There is a significant risk in limiting the interviewee to answering questions without reflecting or developing the ideas. It was sought to minimise this shortcoming by structuring the interview into blocks using the perspectives of Balanced Scorecard developed by Kaplan & Norton (2004) (see § 2.4 for additional information). Another constraint was time, as the interview was usually scheduled to last not more than one hour. This exploratory research is also limited by time. The thesis focuses on describing the impacts of transitioning to a performance-based price regulation to the electricity network companies through the Strategy Maps framework. Whether it would be reasonable to transition from a cost-of-service regulation to a performance-based regulation, was not thoroughly analysed in this thesis. Performing a more in-depth investigation is outside the scope of this thesis, but it can be done in further research, based on the findings in this thesis. The research was focused on management challenges and opportunities of the electricity network companies related to transitioning to a performance-based price regulation. Technology-related challenges and challenges within the operational level of the regulator were not thoroughly analysed. The level of likelihood of the proposed changes and its socio-economic impacts were also not analysed.
  • 39. 31 3. RESULTS AND DISCUSSION 3.1. Price regulation framework in Estonia 3.1.1. Existing price-regulation framework Several interviewees (I3 and I6) pointed out, that the current regulatory framework has a low administrative burden and is simple to follow. However, several issues with the implementation of the framework were pointed out. I3 went even further to state, the current regulation system only has a few issues that need to be solved. These issues are income tax component of the WACC and the calculation of RAB and depreciation of the existing assets of the company (esp. intangible assets). The negative impacts of the decision made in mid-2000’s by Konkurentsiamet regarding the Regulatory Asset Base of the network companies were also noted by I6 and I8. According to the decision, a portion of the assets owned by the network companies will be taken out of RAB during 2017-2019. This is done to reduce the risk of overcompensation by the consumers. A solution was offered by I3, who stated that changes similar to the changes made to the Natural Gas Act (Riigikogu 2012) could be made to resolve the issue. The current calculation methodology of WACC does not factor in the 20% income tax rate (Konkurentsiamet 2013, 13). This justified by the peculiarities of the Estonian tax system4 (Sander 2014, 3). I4 noted, that this approach has been disputed by a study commissioned by the market participants (EY 2014, 22-23). The latter study also pointed out other aspects in the WACC calculations that could have a different approach. The regulator should not be granted both the right for establishing a price regulation methodology and the right to supervise and control the implementation of the methodology. In essence, the regulator should not be able to subjectively say whether 4 In Estonia a unique system for corporate earnings taxation is used, which shifts the moment of taxation from the moment of earning the profits to the moment of their distribution (Estonian Tax and Customs Board 2016).
  • 40. 32 a company has been good or bad. /…/ Their decisions must be based on objective estimations. (I4) A similar statement was made by I9. The current legislative environment (Riigikogu 2017) does not specifically describe the price regulation methodology. The task of development of the methodology has fallen to the regulator (Konkurentsiamet), who also has to conduct supervision over the compliance with the Electricity Market Act (incl. price regulation). According to I9, this allows a rather creative approach to the price regulation by the Konkurentsiamet. Regarding the specific components of the calculation of WACC I8, I7 and I4 noted, that the network companies in Estonia are different in size, but nevertheless, similar components (incl. cost of debt) is used. This causes problems for smaller distribution networks, whose size and revenues do not allow to get the best market rates. I1 noted, that under the current system, keeping the current level of expenses is the easiest solution, rising the expenses is difficult and the negotiations with Konkurentsiamet are time-consuming. According to I2 and I12, the introduction of new expenses (e.g. R&D) is difficult and that the current system incentivises investment into assets rather than innovation. I2 and I12 also noted, that the innovation activities currently in progress, are conducted in conjunction with the company’s vision and mission statements rather than an incentivising regulation. However, I3 pointed out that it is reasonable for Konkurentsiamet to expect the company to start making the expenses before they are included in the allowed revenues. Making investments is more profitable to the company than saving on operating expenses (CAPEX vs OPEX trade-off). As the regulation is set currently, the regulator can, at any time start the process to renegotiate the network charges. Thereby reducing operating expenses is not incentivised. /…/ The current regulatory system’s main focus is on the consumer. More precisely keeping their costs down in the short term. As investment euros are cheap, the owners’ focus is on investing into assets rather than looking at the future and finding innovative solutions that will reduce the costs for the consumers in the future is not incentivised. (I12) The price regulation currently in use for the electricity network companies was adopted in 2003 (Uukkivi et al. 2014, 228). By now, the range tasks of network companies have widened, while the regulation framework has remained widely the same. When the methodology was established, the network operators had less obligations. For example, the electricity excise tax and renewable energy fee had not been imposed yet. Now, the network company has an additional function – “tax collector”. This means
  • 41. 33 additional risks and obligations for the company as the state taxes have to be paid first. However, currently the amount of the taxes and fees collected is not a part of the allowed revenues calculation. (I8) “The current system allows for a low administrative burden from the perspective of the state, but does not take into consideration the possible social costs and benefits” (I9). I12 noted, that in a business, you get what you measure. And the current regulation is set up in a way that, in substance, the electric utility is measured and rewarded by the amount of assets owned. In order to tackle the future challenges ahead (e.g. more renewables in the system, declining electricity consumption), a more incentivising regulation is needed. 3.1.2. Potential performance-based price regulation framework The possible introduction of performance incentives for specific performance areas sparked interest in many of the interviewees. The discussion on specific performance areas was conducted based on the interviewees interest. I1, I6, I7 and I9 pointed out, that service quality should be a specific performance indicator. Several of the respondents adopted a cautious attitude towards the potential rewards or penalties. As can be seen from § 3.2.1, the upper management would rather see the issues with the existing regulation solved rather than adopting a completely new and unknown type of regulation. The performance-based regulation seems to use reverse logic. The higher your quality of service is, the more profits the company gets. When the profits are higher, the company can invest more. Meanwhile, the company with low service quality for historical reasons will not have the money to invest. So the strong will become stronger and the weak will become even weaker. (I3) A somewhat similar statement was also made by I9, who stated, that under the current system, the investors find underperforming companies most valuable, as these companies offer possibilities for high returns for invested capital. For companies nearing the efficiency limits, a new system would be better as it creates new revenue streams. I1, I4 and I8 noted that the customer satisfaction is difficult to measure would need a specific methodology for each company. According to one of the respondents, their
  • 42. 34 company has successfully measured customer satisfaction for years and the results are used to actively measure the effectiveness of the company’s internal procedures. According to I1, the customer’s main concerns with connecting to the grid lie with the duration and the cost of the process. I3, I4 and I5 noted that there is not much that can be done to lower the cost of connecting the customer to the grid due to the limitations arising from the Public Procurement Act and the Electricity Market Act (connection costs are not socialised). I1 said: “Everything can be done faster, but this means that additional resources will have to be spent. Under the current system the operating expenses are too inflexible to facilitate faster connection times.” I2 was positive towards having an incentive for facilitating active consumers (e.g. demand-response) and increasing system efficiency (e.g. increasing the load factor). I3 noted, that not all network companies can “activate” their consumers. I7 stated that having a smoother load curve would benefit the company. I12 and I2 also noted the need for an incentive for grid innovation. According to I12 both the electric utility and society as a whole (e.g. lower prices in the long-run) would benefit from having a specific price component for innovation activities. This would enable the company to learn and anticipate changes rather than only react to changes that are already happening. Many of the interviewees pointed that performance-based price regulation would require a specific methodology for each of the performance areas agreed upon beforehand would be needed. This coincides with the suggestions in the literature (see § 1.2.3 and 1.2.4 for further details). While making comparisons and while benchmarking, we should look at countries with similar economies and development levels to us (e.g. Bulgaria, Romania, Latvia, Lithuania) rather than the Nordics. This is especially true in the case of electricity networks. (I4) According to I3, transitioning to a performance-based regulation makes sense only when the benefits outweigh the costs. This is especially relevant to smaller network companies. For a smaller network company there should be base levels set for basic expenses (e.g. based on €/km of power line or €/consumer (I8) /…/ For a smaller network company, it
  • 43. 35 might be useful to allow using so called “reference tariff”. If the company’s tariffs are lower than the set fixed tariff, the company would not have to though the time-consuming approval process. (I6) A system similar to this is proposed for the new price regulation framework of district heating (Riigikogu 2016). I4 also stated, that a new system would need to bring more flexibility to the company and leave less room for interpretations for the Konkurentsiamet. I9 pointed out the necessity for increasing Konkurentsiamet’s funding if such a performance-based price regulation is to be implemented. A similar comment was made by I1, who stated that under a new regulation, there would be significantly more communication and cooperation with the regulation. This aspect was also mentioned by I12. This means that there would have to be capacity building within the regulator as well. This is supported by OFGEM’s experience, where over 450 employees deal with regulatory issues, experience. The UK’s energy regulator is funded by the licencing fees collected from the regulated entities. I12 stated, that the price regulation should coincide with the long-term vision of the energy system. For example, if we wanted foreign investors to invest into Estonian electric utilities, the regulation should be made similar to existing widely-used and known price regulations. Estonia’s market is too small for outside investors to start learning our specificities. 3.2. Network company’s management 3.2.1. Financial aspects The interviewees explained that the main expectation of the owners (or shareholders) of the company is for the company to make a profit. More specifically, for the company to pay dividends. In addition, for one company, the owners expected the company’s activities to contribute to the competitiveness of the economy. I6 and I4 noted, that with existing price regulation, the expectations of the owner are difficult to fulfil. Several performance indicators were also mentioned: ROE (I3); net profits (I4; I6); EBITDA; ROIC; net cash flow (I8) and economic value added (EVA) (I12; I3). According to I3, the expectations of the shareholders would not significantly change if a new regulation framework would be implemented. However, I12 stated, that when
  • 44. 36 transitioning to a performance-based price regulation, EVA would start to play a more important role for the owners. 3.2.2. Customer expectations As the interviewees were from both distribution companies and the transmission company, the definition of customer varied. In general, the network company serves the following customer types: a) household consumer; b) business consumer; c) distribution service operator; d) generator. “The customer’s three main expectations (in order of importance) are: 1) security of supply; 2) quality of supply; 3) price of the network service” (I6). I9 noted that the customers want the communications between the network company and them to be efficient and fast. Customer satisfaction is actively measured in only one of the companies. Three different customer segments are covered: household consumers, business consumers and industrial consumers. Feedback is asked for the following aspects: a) fault repair times and procedure; b) quality of electricity supply; c) user comfort in using the company’s web services; d) competence of the company’s employees; e) workflow of new contracts. 3.2.3. Internal aspects All of the companies have different internal processes management systems in place. One company uses Workplan (Tööplaan in Estonian), with three levels of tasks: I. Tasks from the Supervisory Board to the Management. II. Tasks from the Management to middle-management. III. Tasks set within the departments.
  • 45. 37 In the beginning of each year, yearly goals will be set for each of the levels. The progress will then be monitored using the Workplan. I3 was sceptical about the possibilities of using a Balanced Scorecard approach to manage an electric utility. “Under the existing framework, the profit of the company depends more on the amount of RAB rather than the performance of a single employee.” However, one interviewee brought out that in their company, BCS has been successfully used for years. In addition to a comprehensive system for rewarding performance, there are spill over effects to the partners (outsourcers) of the utility, who also get rewarded for performance (e.g. customer relations). “With our outsourcers leaving a good impression to our customers, our reputation will improve as well”. Only when profits, customer and employee satisfaction are ensured, one has created a sustainable business. The success of a company is dependent on the leader’s ability to set an example. /…/ Employees must be given freedom to think and act. They must be trusted and guided by setting goals. If the goals are not met, the first thing to do is to check whether they need help or empowerment. (I9) The importance for employee empowerment was also emphasised by I4, who described the process of solving a difficult problem for the company. When at first, the existing team failed to solve the problem, the management empowered the existing team with new workforce, external consulting and financial rewards. In general, the interviewees did not see the need for major changes in their management systems. If a performance-based price regulation would be implemented, the new performance areas would be able to be integrated to the existing systems. I12 noted, that transitioning to a performance-based price regulation would stimulate the electricity network companies to work more like a traditional business, where the profits are tightly connected with the activities of every department. This would contribute to the introduction of new key performance indicators (KPI’s) (e.g. maintenance cost / km of electricity network; maintenance cost / transformer)5 . What is with relevant incentives, overall effectiveness of the company should increase as well as increasing effectiveness would be rewarded rather than penalized as with the current system. 5 These KPI’s were also mentioned by I8.
  • 46. 38 3.2.4. Learning and growth Under learning and growth it was brought out that the average age of employees in the network companies is relatively high. Some of the positions even require up to a year’s worth of training (I7). All of the companies have a separate budget for training the employees. “We have always found funds for training our staff, even during more difficult times” (I4). However, it was noted that can be difficult to find the right training. This obstacle is being tried to overcome via cooperation with universities and speciality organisations (I5, I7, I9). I2 and I3 also noted the growing need for IT-related competences. Even if the employee him or herself does not engage in programming activities, it is important that they have the relevant basic knowledge. Only when the future user and programmer work together, will the end result be effective. The growing need for effective communication with customers was also brought out. No specific metrics for learning and growth were identified during the interviews. 3.3. Further observations 3.3.1. The future of network companies I2, I7, I9 and I12 noted that the current system, where electricity consumers mostly pay for the energy consumed will change in the future. As the consumers become more active in the market (e.g. start producing electricity locally), the consumption is lowered. Meanwhile, the costs to manage the grid remain largely the same. This in turn means a higher tariff for the non-active consumers (a snake eating its own tail). One possible solution is utilizing fixed or capacity components when charging for network services. Making long-term investments into expensive infrastructure should be reduced as much as possible. Especially into areas with low population density. The pace of technological development has become so rapid, that we cannot imagine the solutions available in 10 years. Traditional investments into the grid have a 40…60 year lifespan. /…/ In the future, electricity distribution might not be a monopoly anymore. (I9) A similar statement also emerged from the interview with I2, who noted that contrarily to the common view, electricity, gas and heat are in fact competitors. For the consumer
  • 47. 39 it does not matter, where the energy comes from as long as it is comfortable and reasonably priced. I4 noted that in their electricity grid, the potential for growth in consumption is low. According to I12, in the current environment of constant change, keeping investments into new grid and devices in the next years as low as possible would be more feasible in the long-run. Therefore, keeping the existing investments running as long as possible, should be the main focus. “We don’t know what the electricity network will look like in 2057, it is almost impossible to make predictions for even 2030. We will be much smarter in 2020, than we are now.” Data management will be a key aspect in the future for electricity network companies. In the future, it is possible, that there will be more data flows in the energy system than energy. (I2; I12) 3.3.2. Other observations According to I2, when implementing a performance-based regulation, a wider approach would be more beneficial. Similar sectors to be covered are district heating, water and gas distribution. I12 noted, that in the future, it might be feasible to have a single energy regulator for the Nordics and Estonia. This would lower the regulatory overhead. What is more, having one energy regulator for several countries would level the playing field and enable to make the regulation more transparent and more easily understandable for foreign investors. The same approach could be applied to other similar sectors as well (e.g. the Financial Supervision Authority). According to (I10 and I11), the utilizing a performance-based regulation enabled the regulator to get better information on the regulated entities, as the companies were more willing to provide data on their economic activities.
  • 48. 40 3.4. Discussion 3.4.1. Implications and propositions Based on the information collected during the case study research a common theme emerged – the managements of Estonian electricity network companies see a need for changing the existing price regulation. There are, however, several views and ways how to solve this. The author proposes two ways of changing the existing electricity network price regulation: a) amending (upgrading) the existing framework; b) transitioning to a performance-based price regulation. Updating the existing regulatory framework Some of the interviewees proposed amending (upgrading) the existing regulation instead (§ 3.1.1) of implementing a completely new regulation. Several of the interviewees pointed out, that regulation methodology should be clearly described in the Electricity Market Act. Currently, the task of development of the methodology has fallen to the regulator (Konkurentsiamet), who also conducts supervision over the network companies. According to I3, while updating the Electricity Market Act, it would be reasonable to utilize the approach used for the natural gas sector in 2012, which would solve many issues with the regulatory asset base calculation. The need to change calculation methodology of WACC was also mentioned several times. Under the existing framework, the network companies’ profit is determined by their RAB and the level of WACC. It was suggested, that the calculation methodology of WACC should also take into account income tax component and the size of the network company. Under allowed revenues, the calculation of current capital should take into account the taxes and levies collected by the network operators (excise tax, renewable energy fee). Finally, the smaller DSO’s could benefit from a reference revenue. “If the company’s revenues are lower than the set fixed revenues, the company would not have to though the time-consuming approval process” (I6). A similar system is currently being proposed for the regulation of district heating sector.
  • 49. 41 Transitioning to a performance-based price regulation The initial high-level framework for a possible performance-based regulation in Estonia was constructed based on literature review. This was done to provide structure to the interviews. The results of the interviews gave significant inputs for proposing changes to the price regulation. Transitioning to a performance-based price regulation will only make sense, if benefits outweigh the costs and the new system is fit for purpose. The type of price regulation that should be used depends on which future is envisioned for the electricity network companies and for the energy sector. Companies with more capabilities and resources can identify future trends and change their internal and learning and growth processes accordingly. A new price regulation could also allow network companies to reduce costs for the end-consumers by utilizing new business models. Performance categories are the heart of any incentive regulation. Based on the findings in § 3.1.2, key performance categories for a performance-based electricity network price regulation were identified. The potential performance categories6 identified from the interviews are listed as follows: a) service quality; b) customer satisfaction c) innovation and R&D; d) duration and cost of connecting to the grid; e) customer empowerment. When transitioning to an incentive regulation, there would also have to be capacity building (e.g. more funding and employees) within the regulator as well. For eliciting foreign investments, the new regulatory framework should be made similar to existing widely-used and known price regulations. More details on the proposed changes and a comparison between the existing and proposed price regulation frameworks can be found in Appendix 5. 6 See Appendix 1 for a more detailed explanation of the categories and an overview of the performance metrics typically used.
  • 50. 42 3.4.2. Strategy Map After the potential performance-based price regulation framework had been formed on the basis of interviews, a Strategy Map for an electric utility subject to a performance-based price regulation was composed. The Strategy Map (a communication tool used to tell a story, how value is created) was composed based on the inputs from the interviews and literature review. As can be seen from the figure below, the Strategy Map incorporates all of the four BCS elements (Figure 12). Figure 12. A potential Strategy Map of an electric utility under a performance-based price regulation. Author’s drawing. The figure above describes the situation where an optimal performance-based price regulation is implemented. Moving from macro to the micro, as first step the vision, mission and strategy statements were described. Benchmarking is an important tool Customer Perspective Internal Perspective Learning & Growth Perspective Financial Perspective L1 - Human Capital Qualified workforce (esp. IT & consumer relations) Sustainable recruitment Voluntary employee turnover L3 - Information Capital IT systems & Databases Communication & Contacts Investigate and adopt innovative technologies L2 - Organisational Capital Right resources and tools are available for employees High corporate image Attractive place to work + Our strategy: By 2025, OUR investment and innovation activities have enabled to reduce the price of network services for OUR customers Our mission: To ensure a reliable and quality electricity supply to OUR customers with a sustainable price and ROI Our vision: To be among the TOP X comparable electricity network companies in Y region Customer Focus Operational Excellence Growth & Sustainability F1 – Dividends, EVA F2 – Ensure financial sustainability F3 – Pursue core business growth F4 – Develop new revenue streams C1 – Deliver Out- standing Customer Experience C2 - Cost Effective & Competitive Rates C3 – Ensure Security of Supply C4 – Ensure Quality of Supply C5 – Promote customer efficiency I2 - Continuous Improvement of Key Processes I5 – Transparency & Stakeholder involvement I4 – Ensure sustainability of the company I1 – Foster internal communication & cooperation + I3 – Prolong asset lifetime
  • 51. 43 used in the performance-based price regulation. Therefore, the vision for an electric utility could be in the TOP 5 or TOP 10 comparable (same size, sales etc.) network companies in the region. The mission of a performance-regulated company is to ensure a reliable and quality supply of electricity for their customers, while ensuring the economic sustainability of the company. Under the performance-based regulation framework the strategic goal would be to create a win-win solution through smart investment and innovation activities – reducing the price of network services for the customer, while ensuring sustainable returns. As can be seen from Figure 12, in addition to the four horizontal BCS categories, vertical categories (Customer Focus, Operational Excellence; Growth and Sustainability) emerged while grouping the key performance areas (KPA). In total 17 KPA’s were defined. The foundation of the strategy is the learning and growth perspective is to ensure that the company has adequate human, informational and organisational capital. The activities under the human capital KPA include training the existing employees and developing their skills. The interviewees brought out, that IT and customer relations skills are specifically important. Voluntary employee turnover and the availability of new employees must be guaranteed as well. This is supported by developing the organisational capital creating a high corporate image (attractive place to work) and providing the right tools and resources for the existing and new employees. This in turn is supported by developing the informational capital. In addition to ensuring the information availability, an electric utility should also focus on innovation and foresight to anticipate and benefit from future developments. The internal perspective focuses on the business processes. Continuous improvement of key processes (planning the network; designing and building the network; operating and maintenance of the network; billing and collection) is a key activity under the performance-based price regulation. At a time, where the only thing constant is change, the focus of the company should be to prolong the lifetime of existing assets, espescially in rural areas. The security of supply and quality of supply need to be ensured at all times. This as well as ensuring outstanding customer care and cost-effective and competitive rates is