SlideShare a Scribd company logo
1 of 9
Download to read offline
International Journal of Business and Management Invention
ISSN (Online): 2319 – 8028, ISSN (Print): 2319 – 801X
www.ijbmi.org || Volume 4 Issue 5|| May. 2015 || PP-81-89
www.ijbmi.org 81 | Page
The Effects of Service Quality Dimensions on Customer
Satisfaction: An Empirical Investigation in Syrian Mobile
Telecommunication Services
Wael Rahhal
Marketing and International Trade Department
Higher Institute of Business Administration Syria –Damascus
ABSTRACT: The effect of the perceived service quality on customer satisfaction is an issue still under debate
in the academic literature. Thus, the primary goal of this article is to analyze the effects of service quality
dimensions on Customer Satisfaction in Syrian mobile phones companies, The present study strives to develop a
valid and reliable instrument to measure customer perceived service quality incorporating both service delivery
as well as technical quality aspects. This study was used to gather data relevant to the proposed hypothesis from
a convenience sample of 600 mobile phone service users, and was distributed among the Damascus and Aleppo,
a total of 460 (76.6%) valid questionnaires were collected and used for analysis. Through a survey of 460
regular users of mobile services, a seven dimensional service quality instrument is revealed, which is
empirically tested for unidimensionality, reliability, and construct validity using confirmatory factor analysis.
The findings of this study shows the direct significant impact of service quality on customer satisfaction, and this
effect had appeared through three dimensions (network quality, responsiveness, reliability) and there are no
direct effect of other dimensions on customer satisfaction. Syrian companies must know how provide superior
network quality which be considered as critical by the respondents in judging the quality of mobile
communication services and satisfaction in the Syrian context.
KEYWORDS: Service Quality Dimensions, Customer Satisfaction, Telecommunication, Syria.
I. INTRODUCTION
Service Quality has been a frequently studied topic in the service marketing literature. It has become an important
means of differentiation and path to achieve business success, and service quality researchers to date have paid attention to
the issue of the dimensions of service quality. Researchers note that relevant service dimensions vary across different
industries, which emphasizes a need for developing multiple scale items that provide adequate measures of service quality in
a particular context (Bolton and Drew, 1994). Also, a model of service quality needs to be developed from the consumers'
perspective, what consumers seek and evaluate in the market (Gronroos, 1984).
The importance of Customer satisfaction as a core concept in marketing has led to numerous studies over past
decades. The literature supports that satisfied customers are willing to buy more services or products, recommend them to
others, and less price sensitive (Homburg et al., 2005). Hence, satisfaction is an essential factor related to company's future
profit by increasing the customer retention rate (Anderson et al., 2004).
II. LITERATURE REVIEW
Service Quality
Quality is defined as "overall excellence or superiority that consumers perceive form a product/service" (Zeithaml,
1988). Previous studies attempted to identify dimensions of service quality. For instance, Gronroos,(1984) proposed two
distinct service dimensions: technical and functional quality. Technical quality is what consumers get as an outcome of an
interaction with a service provider. A concept of technical quality is also studied in the form of core service quality – service
/product- related offerings (McDougall and Levesque 2000). In turn, functional quality has to do with how the service is
delivered. This dimension is not directly related to core service offerings, but include a broad range of service delivery items,
such as perceptions of a firm's customer care and the manner of service personnel (Andelman et al., 1994)
However, the most widely used service quality measurement tools include SERVQUAL (Parasuraman,
Zeithaml and Berry, 1988) and SERVPERF (Cronin and Taylor, 1992). The SERVQUAL scale measures
service quality, based on the difference between expectations and performance perceptions of customers using
twenty-two items and five-dimensional structures. In the SERVPERF scale, service quality is operationalized
through performance only scores based on the same twenty-two items and five-dimensional structure of
SERVQUAL.
The Effects of Service Quality Dimensions on Customer…
www.ijbmi.org 82 | Page
SERVQUAL is appreciated by researchers (Carman, 1990; Dabholkar, 1996; Zhu et al., 2002) for its
robust and well-defined structure. However, many authors (Cronin and Taylor, 1992; Boulding et al., 1993; Jain
and Gupta, 2004) found the SERVPERF scale to outperform the SERVQUAL scale in terms of both reliability
and validity. Also the issue of universal dimensions of the SERVQUAL scale for various service applications is
debatable.
For service quality measurement in telecommunication (including fixed line and cellular mobile
services), researchers have supported both SERVQUAL as well as SERVPERF tools. Some of the key findings
in this area are highlighted in Table 1.
Table I. Service Quality Measurement in Telecommunication
Customer Satisfaction
Customer satisfaction has been considered one of the most important constructs (Morgan et al. , 1996;
McQuitty et al. , 2000), and one of the main goals in marketing (Erevelles and Leavitt, 1992). Satisfaction plays
a central role in marketing because it is a good predictor of purchase behaviour (repurchase, purchase intentions,
brand choice and switching behaviour) (Oliver ,1993; McQuitty et al. , 2000). Oliver(1997) offered definition of
satisfaction ,stating that satisfaction is “the consumer's fulfillment response. It is a judgment that a product or
service feature, or the product or service itself, provided (or is providing) a pleasurable level of consumption-
related fulfillment, including levels of under- or over fulfillment”. And Kotler (1997) defines satisfaction as
follows “satisfaction is a person’s feeling of pleasure or disappointed resulting from comparing a product’s
perceived performance (or outcome) in relation to his or her expectations”.
Consumer satisfaction research began in the marketing field in the 1970s and is currently based on the
“disconfirmation of expectations paradigm” (Cadotte et al., 1987). This paradigm says consumer brand
evaluation involves comparing actual performance with some standard. Three outcomes are likely:
(1) Confirmation, where performance matches standards, leading to neutral feelings.
(2) Positive disconfirmation, where performance is deemed better than standard, resulting in satisfaction.
(3) Negative disconfirmation, where performance is deemed worse than standard, resulting in
dissatisfaction.
Therefore, it is commonly accepted that to determine satisfaction or dissatisfaction, comparisons must be made
between customers’ expectations and the perceived performance of the product or service (Yi ,1990).
Service Quality Dimensions and Satisfaction
This study suggests a direct influence of service quality dimensions on satisfaction. Empirical findings
of previous studies provided insights about the critical dimensions of service quality, which could be
categorized under two groups as follows: Functional quality dimensions: This included five SERVQUAL
(Parasuraman, Zeithaml and Berry, 1988) dimensions, namely, (reliability, responsiveness, assurance, empathy,
and tangibles). Further, few items related to 'convenience' and 'complaint handling'. were also incorporated
(Negi, 2009). Technical quality dimensions: In the context of cellular mobile communication, this dimension is
No Author, Year Field of Study Key Findings
1
Leisen and
Vance, 2001
Fixed line
telephone services
SERVQUAL instrument seems to be the best fitting model of service
quality in the US and Germany. Service quality is important to overall
customer satisfaction with telephone services.
2
Johnson and
Sirikit, 2002
Both fixed line and
cellular mobile
services
Service quality assessment using SERVQUAL performed reliably in the
Thai telecommunication service settings.
3
Van der Wal,
Pampallis and
Bond, 2002
Cellular mobile
services
Focused on the customer’s perception of service quality. SERVQUAL
instrument is reliable for the measurement of service quality in the
telecommunication industry in South Africa.
4
Wang and
Lo, 2002
Cellular mobile
services
Used SERVPERF scale for service quality measurement and found that
network quality and empathy are the most important drivers of overall
service quality in China’s mobile phone market.
5
Ranaweera and
Neely, 2003
Fixed line
telephone services
Used SERVPERF with some modifications for service quality
measurement. Study revealed that price perceptions and indifference
moderated the relationship between service quality and customer retention.
6
Kim, Park and
Jeong, 2004
Cellular mobile
services
Service quality has positive impact on customer satisfaction. Study
revealed that call quality is the most important issue that impacts customer
satisfaction for mobile services.
The Effects of Service Quality Dimensions on Customer…
www.ijbmi.org 83 | Page
related to customer perceived network quality. The measures related to this dimension were derived from
literature and the subsequent feedback gained during the exploratory interviews. These included items relating
to network coverage (on highways, inside buildings, and basement), voice clarity, call drop, and network
congestion. In all, eight dimensions for measuring service quality in cellular mobile telephony were identified,
which are summarized in Table II. Negi (2009) explained that satisfaction is influenced by the dimensions
(Reliability, Empathy, and Assurance).
Table II. Critical Dimensions for Measuring Service Quality in Cellular Mobile Communication
This leads to following hypothesis (based on SERVPERF):
H1: Tangibles is positively associated with Customer Satisfaction.
H2: Reliability is positively associated with Customer Satisfaction.
H3: Responsiveness is positively associated with Customer Satisfaction.
H4: Assurance is positively associated with Customer Satisfaction.
H5: Empathy is positively associated with Customer Satisfaction.
H6: Complaint handling is positively associated with Customer Satisfaction.
H7: Convenience is positively associated with Customer Satisfaction.
H8: Network quality is positively associated with Customer Satisfaction.
III. RESEARCH METHODOLOGY
Model, Sampling design and data collection
Figure 1 provides a graphical summary of the conceptual framework that this study examines:
Figure 1
A Conceptual Framework For The Effect Of Service Quality Dimensions On Customer Satisfaction
Functional Reliability Ability to perform the service accurately and
dependably, as promised.
Parasuraman, Zeithaml and Berry,
1988; Rosen and Karwan, 1994
Responsiveness Willingness of the firm’s staff to help
customers and provide prompt services.
Parasuraman, Zeithaml and Berry,
1988; Rosen and Karwan, 1994
Assurance Knowledge and courtesy of employees and
their abilities to inspire trust and confidence.
Parasuraman, Zeithaml and Berry,
1988; Rosen Karwan,1994
Empathy Ability of the service provider to provide a
caring and personalized attention to each
customer
Parasuraman, Zeithaml and Berry,
1988; Saleh and Ryan, 1991
Tangibles Appearance of physical facilities, equipment,
personnel and communication materials.
Parasuraman, Zeithaml and Berry,
1988; Rosen and Karwan, 1994
Convenience Implies flexible and comfortable facilities to
suit the customers' needs.
Carvalho and Leite 1999;
Gagliano and Hathcote, 1994
Complaint handling Procedures to receive/handle customer
complaints in time effective
Negi 2009
Technical
.
Customer perceived
network quality
It is an indicator of network performance in
terms of voice quality, call drop rate, network
coverage, and network congestion.
Naghshineh and Schwartz,
1996;Markoulidakis et. al., 2000;
Sharma and Ojha 2004.
The Effects of Service Quality Dimensions on Customer…
www.ijbmi.org 84 | Page
Data was collected through a field survey of (MTN and SYRIATEL) customers in Damascus and Aleppo, Syria.
A sample of 600 mobile phone service users, and was distributed among the Damascus and Aleppo, a total of
460 (76.6%) valid questionnaires were collected and used for analysis. Table III shows the community
demographics.
Table III. Community demographics
II. METHOD OF DATA OBTAINMENT
Before conducting the final survey, a preliminary study was conducted with a sample size of 30, to
judge the applicability of instrument items. For this purpose, statementsof the SERVQUAL instrument were
modified (Parasuramanet al., 1991;Sharma and Ojha 2004; Negi, 2009) to best fit in the context of the Syrian
setting, and additional dimensions related to service quality were asked of the respondents by using open-ended
question. The study survey consisted of two sections: service quality dimensions, measured using 40 items;
customer satisfaction, measured using three items. Respondents are asked to indicate their agreement level of
each item of the sections on the five-point Likert scale anchored by ‟strongly agree (=1)” to ‟strongly disagree
(=5)”.
Analysis of results
Measurement model
This study employs a structural equation modeling (SEM) approach, using AMOS 18, to develop a
model that represents the causal relationships among the variables (Chin, 2001). The questionnaire items
(Appendix) employed to collect data were adapted from Parasuraman et al. (1991),Sharma and Ojha (2004)and
Negi, (2009). Each variable was measured using previously developed components of instruments that have
demonstrated good psychometric properties..
Exploratory Factor Analysis was conducted to define possible relationships of observed variables for
service quality dimensions, the results indicated that the two dimensions (responsiveness and complaint
handling) were combined into one dimension as 'Responsiveness'
A confirmatory factor analysis (CFA) was conducted to empirically test the measurement model.
Multiple tests on construct validity and reliability were performed, where items with low loading were
eliminated, one item (service provider maintain the records accurately) from Reliability, two items (physical
facilities at service provider are visually appealing, and service provider has up to date equipments/technology)
from Tangibles, and one item (service provider has sufficient offices in Suburbs to facilitate easily the sales after
sales services) from convenience. Model fit was evaluated using the maximum likelihood (ML) method.
Construct reliability: Construct reliability was assessed using Cronbach’s α, composite reliability (CR)
and average variance extracted (AVE) using CFA. As the α-values (Table IV) for all the constructs are greater
N %
Gender Male 255 55.4
Female 205 44.6
Total 460 100
Income (SP) Less than 10000 101 22.0
10000 -19999 147 32.0
20000 -29999 102 22.0
30000 to above 82 17.8
Total 432 93.9
Age Less than 21 53 11.5
21 -29 213 46.3
30 -39 111 24.1
40 to above 83 18.0
Total 460 100
Education level Under graduate 186 40.4
Post graduate 274 59.6
Total 460 100
SYRIATEL 232 50.4
Service Provider MTN 228 49.6
Total 460 100
The Effects of Service Quality Dimensions on Customer…
www.ijbmi.org 85 | Page
than the guideline of 0.70, it can be concluded that the scales can be applied for the analysis with acceptable
reliability(Saunders et al., 2003). CR and AVE were calculated from model estimates using the CR formula and
AVE formula given by Fornell and Larcker (1981). In the measurement model, all constructs had a CR over the
cut-off of 0.70 and the AVE for all exceeded the recommended level of 0.5 (Bagozzi and Yi, 1988). Based on
these assessments, measures used within this study were within the acceptable levels supporting the reliability of
the constructs (TableIV).
Content and discriminant validity: Content validity was verified by expert judgment and by a careful
literature review, To assess the discriminant validity, Fornell and Larcker’s (1981) criterion, that square root of
the AVE for each construct should be greater than the correlation between constructs, was used. Table Vshows
the values of the square root of the AVE are all greater than the inter-construct correlations. Eight common
model-fit measures were used to assess the model’s overall goodness of fit. As shown in Table VI, all the
model-fit indices exceeded the respective common acceptance levels suggested by previous research (Kim et
al.,2004), demonstrating that the measurement model exhibited a good fit with the data collected.
Structural model
Using AMOS 18, the researcher determine the path coefficients. Figure 2 shows the Results of structural model.
Figure 2. Theoretical model tested
The Effects of Service Quality Dimensions on Customer…
www.ijbmi.org 86 | Page
Table VII. Result of the structural model
Notes: ***p<0.001, **p<0.01
Network quality showed a positive effect on Customer Satisfaction (β=0.360, p <0.001) Therefore, H8
confirmed (Table VII). In addition Responsiveness had a positive effect on Customer Satisfaction (β =0.284, p
<0.001) Therefore, H3 was supported. Also Reliability had positive effect on Customer Satisfaction (β=0.156,
p <0.01) Therefore , H2 was supported.
IV. CONCLUSIONS AND IMPLICATIONS
The research resulted in the development of a reliable and valid instrument for assessing customer
perceived service quality for cellular mobile services. The resulting instrument is devised after a review of the
literature and exploratory investigations followed by a series of acceptable validation procedures. On the basis
of the findings revealed during the exploratory investigations, complaint handling, convenience and customer
perceived network quality dimensions were added in the original SERVQUAL scale. Factor analysis indicates
that “network quality” operates as a stand-alone dimension while “responsiveness and compliant handling” were
merged as one to maintain high internal consistency, this also represents that respondents perceived both the
dimensions as one.
Further, the study highlighted the relative importance of service quality attributes, an attempt was made
to identify the contribution of each service quality dimensions in predicting overall customer satisfaction.
Network quality scored the highest (β=0.360, p<0.001) followed by the dimensions of Responsiveness (β
=0.284, p<0.001) and Reliability (β=0.156, p<0.01).
Findings of this study provide helpful guidelines for mobile service carriers in understanding key
drivers of customer satisfaction. Looking at each individual dimension. Customer perceived network quality
appeared at the first important place in predicting overall customer satisfaction. For this, service providers need
to pay attention on providing adequate network coverage, voice clarity, and focus on reducing the congestion
level in their network, as well as service providers should give social occasions more important, where
customers need to use mobile phones more than usual. Additionally, responsiveness and complaint handling
appeared at the second important place in predicting overall customer satisfaction, it is suggested that the
contact employees should resolve the customer's complaints timely and that the customer's queries are taken
seriously. This implies that cellular mobile service providers should invest in empowering the contact
employees and providing them with adequate resources so that they can take prompt actions to customer
queries. For this, they need to ensure that the employees are able to make important decisions regarding
customers' requirements at their level, thereby providing adequate responsiveness. Additionally, reliability
factor also appeared at the third important place in predicting overall customer satisfaction, thus, the service
providers need to focus on performing the service right the first time, providing the services at the promised
time.
Path
Coefficients
(Beta)
t-values p-value Result
Network quality Customer Satisfaction 0.360 7.971 ***
Supported
Responsiveness Customer Satisfaction 0.284 3.892 ***
Supported
Convenience Customer Satisfaction 0.009 0.212 0.832 Not supported
Tangibles Customer Satisfaction 0.009 0.146 0.884 Not supported
Assurance Customer Satisfaction 0.072 1.266 0.206 Not supported
Empathy Customer Satisfaction 0.072 1.256 0.209 Not supported
Reliability Customer Satisfaction 0.156 2.849 0.004** supported
The Effects of Service Quality Dimensions on Customer…
www.ijbmi.org 87 | Page
V. LIMITATION AND FUTURE RESEARCH
The study has been carried out in the Damascus and Aleppo cities, where the income level and
population density is very high as compare to rest of Syria; hence, the results are not necessarily generalizable
for the whole country or other countries. This research focused on service quality and its effect on customer
satisfaction. However, the research did not study the association between customer satisfaction and retention for
corporate customers. The results coming from the mobile phone service industry might not be applicable to
other service businesses. In other service fields, building a broader understanding of the effect of the factors
related to customer satisfaction should create new possibilities in terms of understanding how to increase
satisfaction .
REFERENCE
[1] Adelman, Mara B., Aaron Ahuvia and Cathy Goodwin (1994), “Beyond Smiling,” in Service Quality: New Directions in Theory
and Practice, Roland T. Rust and Richard L. Oliver, Eds. New York: Sage, pp.71-139.
[2] Anderson, Eugene W., Clases Fornell, Sanal K. Mazvancheryl (2004), “Customer Satisfaction and Shareholder Value”,Journal of
Marketing, Vol.68,No.4, pp.172-185.
[3] Bagozzi, R. and Yi, Y. (1988) . "On the evaluation of structural equation models",Journal of the Academy of Marketing Science,
Vol. 16 No. 1, pp. 74-94.
[4] Bolton, Ruth N. and James H. Drew (1994), "Linking Customer Satisfaction to Service Operations and Outcomes" in Roland T.
Rust and Richard L. Oliver (Eds.), Service Quality: New Directions in Theory and Practice, New York Sage, Publications, Inc.,
pp.173-200.
[5] Boulding, W; Kalra, A; Staelin, R and Zeithaml, V A (1993), "A Dynamic Process Model of Service Quality: From Expectations
to Behavioural Intentions", Journal of Marketing Research, Vol. 30, No.1, pp. 7-27.
[6] Cadotte, E., Woodruff, R. &Jenkins, R. (1987), “Expectations and norms in models of consumer satisfaction”, Journal of
Marketing Research, Vol. 24, No. 3, pp. 305-14.
[7] Carman, JM (1990), "Consumer Perception of Service Quality: An Assessment of the SERVQUAL Dimensions" , Journal of
Retailing, Vol.66, No. 1, pp. 33-55.
[8] Carvalho de, F A and Leite, V A (1999), "Attribute Importance in Service Quality: An Empirical Test of the PBZ Conjecture in
Brazil", International Journal of Service Industry Management, Vol.10, No.5, pp.487-504.
[9] Chin, W. (2001). PLS-graph user’s guide. PLS-Graph User’s Guide Version 3.0, Soft Modeling Inc, Houston, TX.
[10] Cronin J. and Taylor SA. (1992), “Measuring Service Quality: A Reexamination and Extension”,Journal of Marketing, Vol.56,
No.3, pp. 55-68.
[11] Dabholkar, P A (1996), "Consumer Evaluations of New Technology-Based Self-Service Operations: An Investigation of
Alternative Models", International Journal of Research in Marketing, Vol.13, Vol.1, pp. 29-51.
[12] Erevelles, S. &Leavitt, C. (1992) “A comparison of current models of consumer satisfaction/dissatisfaction” Journal of Consumer
Satisfaction, Dissatisfaction and Complaining Behavior, vol.5, pp. 104–114.
[13] Fornell, C. and Larcker, D. (1981)."Evaluating structural equation models with unobservable variables and measurement error" ,
Journal of Marketing Research, Vol. 18 No. 1, pp. 39-50.
[14] Gagliano, K B and Hathcote, J (1994). "Customer Expectations and Perceptions of Service Quality in Apparel Retailing", Journal
of Services Marketing, Vol.8, No.1, pp. 60-69.
[15] Gronroos, C. (1984), ‘‘A service quality model and its marketing implications’’, European Journal of Marketing, Vol. 18 No. 4,
pp. 36-44.
[16] Homburg C., Koschate N., and Hoyer W.D.(2005), “Do Satisfied Customer Really Pay More? A Study of the Relationship
Between Customer Satisfaction and Willingness to Pay”, Journal of Marketing , Vol.69, No.2, pp.84-96.
[17] Jain, S K and Gupta, Garima (2004), "Measuring Service Quality: SERVQUAL vs. SERVPERF Scales", Vikalpa, The Journal for
Decision Makers, Vol.29, No.2, pp. 25-37.
[18] Johnson, W C and Sirikit, A (2002). "Service Quality in the Thai Telecommunication Industry: A Tool for Achieving a
Sustainable Competitive Advantage", Management Decision, Vol.40, No.7, pp. 693-701.
[19] Kim, M; Park, M and Jeong, D (2004). "The Effects of Customer Satisfaction and Switching Barrier on Customer Loyalty in
Korean Mobile Telecommunication Services", Telecommunications Policy, Vol.28, No.2, pp. 145-159.
[20] Kotler ,p.(1997) “Managing service businesses and product support services”, Prentice Hall.
[21] Leisen B., and Vance C.,(2001), “Cross-National Assessment of Service Quality in the Telecommunication Industry: Evidence
from the USA and Germany”, Managing Service Quality, Vol.11,No.5, P.307-317.
[22] Markoulidakis, J G; Dermitzakis, J E; Lyberopoulos, G L and Theologou, M E (2000). "Optimal System Capacity in Handover
Prioritized Schemes in Cellular Mobile Communicatio Telecommunication Systems", Computer Communications, Vol.23, pp.462-
475.
[23] McDougall G., and Levesque T., (2000), "Customer Satisfaction with Services: putting perceived value into the equation", Journal
of Services Marketing, Vol.14, No.4/5, pp.392-410.
[24] McQuitty, S., Finn, A. & Wiley, J.B. (2000) "Systematically varying consumer satisfaction and its implications for product
choice", Academy of Marketing Science Review.
[25] Morgan, M.J., Attaway, J.A. & Griffin, M. (1996) "The role of product/service experience in the satisfaction formation process: a
test of moderation”, Journal of Consumer Satisfaction, Dissatisfaction and Complaining Behavior, vol.9, pp104–114.
[26] Naghshineh, M and Schwartz, M (1996). "Distributed Call Admission Control in Mobile/Wireless Networks", IEEE Journal on
Selected Areas of Communication, Vol.14, No.4, pp. 711-717.
[27] Negi R., (2009)."Determining Customer Satisfaction Through Perceived Service Quality: A Study Of Ethiopian Mobile
Users"International Journal of Mobile Marketing, Vol.4, No.1, P31-38.
[28] Oliver, R.L. (1993) "Cognitive, affective and attribute bases of the satisfaction response", Journal of Consumer Research, Vol. 20,
pp. 418–430.
[29] Oliver, R.L., (1997), “Satisfaction: A Behavioral Perspective on the Consumer”, in McMullan, Rosalind & Gilmore, Audrey.,
(2003), “The Conceptual Development of Customer Loyalty Measurement: A Proposed Scale”, Journal Of Targeting,
Measurement and Analysis for Marketing,Vol.11, No.3, pp. 230-243.
The Effects of Service Quality Dimensions on Customer…
www.ijbmi.org 88 | Page
[30] Parasuraman A., Zeithaml V.A. and Berry L. (1988), “SERVQUAL: a multiple-item scale for measuring consumer perceptions of
service quality,” Journal of Retailing, Vol. 64, No. 1, pp. 12-40.
[31] Parasuraman A., Zeithaml V.A. and Berry L. (1991), “Perceived Service Quality as a Customer-Based Performance Measure: An
Empirical Examination of Organizational Barriers Using an Extended Service Quality Model”,Human Resource Management,
Vol.30, No.3, P. 335-364.
[32] Ranaweera, C and Neely, A (2003). "Some Moderating Effects on the Service Quality-Customer Retention Link", International
Journal of Operations & Production Management, Vol. 23, No.2, pp. 230-248.
[33] Rosen and Karwan (1994). “ Prioritizing the Dimensions of Service Quality”,International Journal of Service Industry
Management , Vol.5,No.4, pp. 39-53.
[34] Saleh, F and Ryan, C (1991). "Analyzing Service Quality in the Hospitality Industry Using the SERVQUAL Model", The Service
Industries Journal, Vol.11, No.3, pp. 324-343.
[35] Saunders, M., Lewis, P. and Thornhill, A. (2003). Research Methods for Business Students, 3rd ed., Financial Times Prentice-
Hall, London.
[36] Sharma N., and Ojha S., (2004). “Measuring Performance in Mobile Communications" , Service Industries Journal , Vol.24,No.6,
pp. 109-128 .
[37] Van der Wal, R W E; Pampallis, A and Bond, C (2002). "Service Quality in a Cellular Telecommunications Company: A South
African Experience", Managing Service Quality, Vol.12, No. 5, pp. 323-335.
[38] Wang Y., and Po Lo H., (2002), “Service Quality, Customer Satisfaction and behavior intentions-Evidence from China’s
Telecommunication Industry”, The Journal of Policy Regulation and Strategy for telecommunication Information and Media,
Vol.4, No.6, pp.50-60.
[39] Yi, Y. (1990), “A critical review of consumer satisfaction”,in Zeithaml, V.A. (Ed.), Review of Marketing 1990, American
Marketing Association, Chicago, IL, pp. 68-123.
[40] Zeithaml V.A., (1988), “Consumer Perceptions of Price, Quality, and Value: A Means-End Model and Synthesis of Evidence”,
Journal of Marketing, Vol.52, No.3, pp. 2-22.
[41] Zhu, F X; Wymer, W J and Chen, I (2002), "IT-based Services and Service Quality in Consumer Banking", International Journal
of Service Industry Management, Vol.13, No.1, pp. 69-90.
APPENDIX. QUESTIONNAIRE, VARIABLE ITEMS
Service Quality Dimensions:
Tangibles
1. Service Provider has up-to-date equipments/technology.
2. Physical facilities at service provider are visually appealing.
3. Employees are well dressed and neat in appearance.
4. Materials associated with the service (such as pamphlets or statement) will be visually appealing in an excellent
company.
5. Company website is visually appealing.
Reliability
6. When promises to do something, service provider does so.
7. Excellent telephone companies provide its services at the time it promises to do so.
8. Service provider shows sincere interest in solving customers’ problems.
9. Excellent telephone companies will perform the service right the first time.
10. Service provider is dependable.
11. Service provider maintains the records accurately.
12. Service provider updates the records accurately.
Responsiveness
13. Service related information is easily obtainable from the provider
14. Employees provide services promptly to the customers.
15. Employees are always willing to help the customers.
16. Despite their busyness, employees respond promptly to customers’ requests.
17. Employees of excellent telephone companies will tell customer exactly when services will be performed.
Assurance
18. Employees behavior instill confidence in customers.
19. Customers feel assure that service requests are duly follow-up by the company.
20. Employees providing service to customers are courteous and friendly.
21. Employees maintain adequate knowledge to handle customer queries.
22. Customer of excellent telephone companies will safe in their transactions.
Empathy
23. Excellent telephone companies will give customers individual attention.
24. Employees interacting customers pay personal attention to them.
25. Service provider has customers’ best interests at heart.
26. Service provider understands the specific needs of the customers.
The Effects of Service Quality Dimensions on Customer…
www.ijbmi.org 89 | Page
Complaint handling
27. Service provider has sufficient procedures to receive/handle customer complaints.
28. Procedures of complaint handling at service provider are time effective.
Convenience
29. Convenient business hours
30. Service provider has sufficient offices in cities to facilitate easily the sales/after-sales services.
31. Service provider has sufficient offices in suburbs to facilitate easily the sales/after-sales services.
Network quality
32. The coverage of this cellular network is strong on all the highways.
33. The signal is strong even inside the buildings including basement.
34. All parts of the city including suburbs are reasonably covered by this network.
35. Service network maintains excellent voice quality and without interruption.
36. You are able to make calls at peak hours.
37. Your call gets connected to the called person during first attempt most of the time.
38. Sending / Receiving SMS is fast.
39. Downloading (ringtones, photos, songs……etc) are fast.
40. Receiving Traffic information are accurate.
Customer satisfaction
1. I am happy with the telephone company.
2. I am satisfied with the telephone company.
3. My choice to deal with this telephone company is a wise one.

More Related Content

What's hot

Factors determining the customer satisfaction & loyalty a study of mobile tel...
Factors determining the customer satisfaction & loyalty a study of mobile tel...Factors determining the customer satisfaction & loyalty a study of mobile tel...
Factors determining the customer satisfaction & loyalty a study of mobile tel...Cuong Dinh
 
Correlate of Service Quality Dimensions and Customer Loyalty in the Nigerian ...
Correlate of Service Quality Dimensions and Customer Loyalty in the Nigerian ...Correlate of Service Quality Dimensions and Customer Loyalty in the Nigerian ...
Correlate of Service Quality Dimensions and Customer Loyalty in the Nigerian ...IOSRJBM
 
11.appraisal relationship between service quality and customer satisfaction i...
11.appraisal relationship between service quality and customer satisfaction i...11.appraisal relationship between service quality and customer satisfaction i...
11.appraisal relationship between service quality and customer satisfaction i...Alexander Decker
 
International Journal of Business and Management Invention (IJBMI)
International Journal of Business and Management Invention (IJBMI)International Journal of Business and Management Invention (IJBMI)
International Journal of Business and Management Invention (IJBMI)inventionjournals
 
Effect Of Quality Services On Customer Satisfaction And Loyalty (Theoritical...
	Effect Of Quality Services On Customer Satisfaction And Loyalty (Theoritical...	Effect Of Quality Services On Customer Satisfaction And Loyalty (Theoritical...
Effect Of Quality Services On Customer Satisfaction And Loyalty (Theoritical...inventionjournals
 
Examining the Differences in Service Quality Dimensions and their Consequence...
Examining the Differences in Service Quality Dimensions and their Consequence...Examining the Differences in Service Quality Dimensions and their Consequence...
Examining the Differences in Service Quality Dimensions and their Consequence...iosrjce
 
Understanding Consumer Perception of Price-Quality- Value Relationship
Understanding Consumer Perception of Price-Quality- Value RelationshipUnderstanding Consumer Perception of Price-Quality- Value Relationship
Understanding Consumer Perception of Price-Quality- Value RelationshipIJARIIT
 
Improving hospital profitability through cost of quality
Improving hospital profitability through cost of qualityImproving hospital profitability through cost of quality
Improving hospital profitability through cost of qualityAlexander Decker
 
546335bc0cf2837efdb02f2f
546335bc0cf2837efdb02f2f546335bc0cf2837efdb02f2f
546335bc0cf2837efdb02f2ffinbar F.Martin
 
Tugas dimensi dabholkar
Tugas dimensi dabholkarTugas dimensi dabholkar
Tugas dimensi dabholkarnoe irredenta
 
Effect of customer value and quality of service on customer satisfaction (cas...
Effect of customer value and quality of service on customer satisfaction (cas...Effect of customer value and quality of service on customer satisfaction (cas...
Effect of customer value and quality of service on customer satisfaction (cas...Iwan Kurniawan Subagja
 
6. hapzi ali, et al., 2016, mercu buana univversity,iosr jbb
6. hapzi ali, et al., 2016, mercu buana univversity,iosr jbb6. hapzi ali, et al., 2016, mercu buana univversity,iosr jbb
6. hapzi ali, et al., 2016, mercu buana univversity,iosr jbbHapzi Ali
 
Paper industrial enginering
Paper industrial engineringPaper industrial enginering
Paper industrial engineringJugala Raya, CV.
 

What's hot (19)

Factors determining the customer satisfaction & loyalty a study of mobile tel...
Factors determining the customer satisfaction & loyalty a study of mobile tel...Factors determining the customer satisfaction & loyalty a study of mobile tel...
Factors determining the customer satisfaction & loyalty a study of mobile tel...
 
1
11
1
 
Correlate of Service Quality Dimensions and Customer Loyalty in the Nigerian ...
Correlate of Service Quality Dimensions and Customer Loyalty in the Nigerian ...Correlate of Service Quality Dimensions and Customer Loyalty in the Nigerian ...
Correlate of Service Quality Dimensions and Customer Loyalty in the Nigerian ...
 
11.appraisal relationship between service quality and customer satisfaction i...
11.appraisal relationship between service quality and customer satisfaction i...11.appraisal relationship between service quality and customer satisfaction i...
11.appraisal relationship between service quality and customer satisfaction i...
 
International Journal of Business and Management Invention (IJBMI)
International Journal of Business and Management Invention (IJBMI)International Journal of Business and Management Invention (IJBMI)
International Journal of Business and Management Invention (IJBMI)
 
10320140501004
1032014050100410320140501004
10320140501004
 
Effect Of Quality Services On Customer Satisfaction And Loyalty (Theoritical...
	Effect Of Quality Services On Customer Satisfaction And Loyalty (Theoritical...	Effect Of Quality Services On Customer Satisfaction And Loyalty (Theoritical...
Effect Of Quality Services On Customer Satisfaction And Loyalty (Theoritical...
 
Examining the Differences in Service Quality Dimensions and their Consequence...
Examining the Differences in Service Quality Dimensions and their Consequence...Examining the Differences in Service Quality Dimensions and their Consequence...
Examining the Differences in Service Quality Dimensions and their Consequence...
 
A model for assessing
A model for assessingA model for assessing
A model for assessing
 
Ijm 06 09_011
Ijm 06 09_011Ijm 06 09_011
Ijm 06 09_011
 
Understanding Consumer Perception of Price-Quality- Value Relationship
Understanding Consumer Perception of Price-Quality- Value RelationshipUnderstanding Consumer Perception of Price-Quality- Value Relationship
Understanding Consumer Perception of Price-Quality- Value Relationship
 
Improving hospital profitability through cost of quality
Improving hospital profitability through cost of qualityImproving hospital profitability through cost of quality
Improving hospital profitability through cost of quality
 
546335bc0cf2837efdb02f2f
546335bc0cf2837efdb02f2f546335bc0cf2837efdb02f2f
546335bc0cf2837efdb02f2f
 
Tugas dimensi dabholkar
Tugas dimensi dabholkarTugas dimensi dabholkar
Tugas dimensi dabholkar
 
Effect of customer value and quality of service on customer satisfaction (cas...
Effect of customer value and quality of service on customer satisfaction (cas...Effect of customer value and quality of service on customer satisfaction (cas...
Effect of customer value and quality of service on customer satisfaction (cas...
 
Kano model lectura_2
Kano model lectura_2Kano model lectura_2
Kano model lectura_2
 
6. hapzi ali, et al., 2016, mercu buana univversity,iosr jbb
6. hapzi ali, et al., 2016, mercu buana univversity,iosr jbb6. hapzi ali, et al., 2016, mercu buana univversity,iosr jbb
6. hapzi ali, et al., 2016, mercu buana univversity,iosr jbb
 
Hung_up_switching
Hung_up_switchingHung_up_switching
Hung_up_switching
 
Paper industrial enginering
Paper industrial engineringPaper industrial enginering
Paper industrial enginering
 

Similar to The Effects of Service Quality Dimensions on Customer Satisfaction: An Empirical Investigation in Syrian Mobile Telecommunication Services

The role of tangibility in service quality
The role of tangibility in service qualityThe role of tangibility in service quality
The role of tangibility in service qualityTapan Panda
 
A Review On Dimensions Of Service Quality Models
A Review On Dimensions Of Service Quality ModelsA Review On Dimensions Of Service Quality Models
A Review On Dimensions Of Service Quality ModelsMaria Perkins
 
The Effects of Customer Expectation and Perceived Service Quality on Customer...
The Effects of Customer Expectation and Perceived Service Quality on Customer...The Effects of Customer Expectation and Perceived Service Quality on Customer...
The Effects of Customer Expectation and Perceived Service Quality on Customer...Samaan Al-Msallam
 
The Effects of Customer Expectation and Perceived Service Quality on Custome...
	The Effects of Customer Expectation and Perceived Service Quality on Custome...	The Effects of Customer Expectation and Perceived Service Quality on Custome...
The Effects of Customer Expectation and Perceived Service Quality on Custome...inventionjournals
 
Các yếu tố ảnh hưởng đến chất lượng dịch vụ bán lẻ nghiên cứu ở các siêu th...
Các yếu tố ảnh hưởng đến chất lượng dịch vụ bán lẻ   nghiên cứu ở các siêu th...Các yếu tố ảnh hưởng đến chất lượng dịch vụ bán lẻ   nghiên cứu ở các siêu th...
Các yếu tố ảnh hưởng đến chất lượng dịch vụ bán lẻ nghiên cứu ở các siêu th...leethanhbinhf
 
Application of servqual model in customer service of mobile operators
Application of servqual model in customer service of mobile operatorsApplication of servqual model in customer service of mobile operators
Application of servqual model in customer service of mobile operatorsAlexander Decker
 
11.application of servqual model in customer service of mobile operators
11.application of servqual model in customer service of mobile operators11.application of servqual model in customer service of mobile operators
11.application of servqual model in customer service of mobile operatorsAlexander Decker
 
Customer expectations and perceptions of service quality of mobile phone
Customer expectations and perceptions of service quality of mobile phoneCustomer expectations and perceptions of service quality of mobile phone
Customer expectations and perceptions of service quality of mobile phoneIAEME Publication
 
Linking quality, satisfaction and behaviour intentions in ghana’s mobile tele...
Linking quality, satisfaction and behaviour intentions in ghana’s mobile tele...Linking quality, satisfaction and behaviour intentions in ghana’s mobile tele...
Linking quality, satisfaction and behaviour intentions in ghana’s mobile tele...Alexander Decker
 
A REVIEW OF SERVICE QUALITY MODELS
A REVIEW OF SERVICE QUALITY MODELSA REVIEW OF SERVICE QUALITY MODELS
A REVIEW OF SERVICE QUALITY MODELSRenee Lewis
 
Ijbrm 144Customer Perceptions and Expectations Regarding Service Qualities in...
Ijbrm 144Customer Perceptions and Expectations Regarding Service Qualities in...Ijbrm 144Customer Perceptions and Expectations Regarding Service Qualities in...
Ijbrm 144Customer Perceptions and Expectations Regarding Service Qualities in...Waqas Tariq
 
Extended information technology enabled service quality model for life insura...
Extended information technology enabled service quality model for life insura...Extended information technology enabled service quality model for life insura...
Extended information technology enabled service quality model for life insura...prjpublications
 
Extended information technology enabled service quality model for life insura...
Extended information technology enabled service quality model for life insura...Extended information technology enabled service quality model for life insura...
Extended information technology enabled service quality model for life insura...prj_publication
 
Valor optimo del durbin watson
Valor optimo del durbin watsonValor optimo del durbin watson
Valor optimo del durbin watsonDamagadi
 
An Empirical Analysis Of After Sales Service And Customer Satisfaction
An Empirical Analysis Of After Sales Service And Customer SatisfactionAn Empirical Analysis Of After Sales Service And Customer Satisfaction
An Empirical Analysis Of After Sales Service And Customer SatisfactionLeonard Goudy
 
Computers in Human Behavior (Mobile , VAS )
Computers in Human Behavior (Mobile , VAS )Computers in Human Behavior (Mobile , VAS )
Computers in Human Behavior (Mobile , VAS )MUHAMMAD MEHROZE
 

Similar to The Effects of Service Quality Dimensions on Customer Satisfaction: An Empirical Investigation in Syrian Mobile Telecommunication Services (20)

The role of tangibility in service quality
The role of tangibility in service qualityThe role of tangibility in service quality
The role of tangibility in service quality
 
A Review On Dimensions Of Service Quality Models
A Review On Dimensions Of Service Quality ModelsA Review On Dimensions Of Service Quality Models
A Review On Dimensions Of Service Quality Models
 
The Effects of Customer Expectation and Perceived Service Quality on Customer...
The Effects of Customer Expectation and Perceived Service Quality on Customer...The Effects of Customer Expectation and Perceived Service Quality on Customer...
The Effects of Customer Expectation and Perceived Service Quality on Customer...
 
The Effects of Customer Expectation and Perceived Service Quality on Custome...
	The Effects of Customer Expectation and Perceived Service Quality on Custome...	The Effects of Customer Expectation and Perceived Service Quality on Custome...
The Effects of Customer Expectation and Perceived Service Quality on Custome...
 
Các yếu tố ảnh hưởng đến chất lượng dịch vụ bán lẻ nghiên cứu ở các siêu th...
Các yếu tố ảnh hưởng đến chất lượng dịch vụ bán lẻ   nghiên cứu ở các siêu th...Các yếu tố ảnh hưởng đến chất lượng dịch vụ bán lẻ   nghiên cứu ở các siêu th...
Các yếu tố ảnh hưởng đến chất lượng dịch vụ bán lẻ nghiên cứu ở các siêu th...
 
Application of servqual model in customer service of mobile operators
Application of servqual model in customer service of mobile operatorsApplication of servqual model in customer service of mobile operators
Application of servqual model in customer service of mobile operators
 
11.application of servqual model in customer service of mobile operators
11.application of servqual model in customer service of mobile operators11.application of servqual model in customer service of mobile operators
11.application of servqual model in customer service of mobile operators
 
Customer expectations and perceptions of service quality of mobile phone
Customer expectations and perceptions of service quality of mobile phoneCustomer expectations and perceptions of service quality of mobile phone
Customer expectations and perceptions of service quality of mobile phone
 
Linking quality, satisfaction and behaviour intentions in ghana’s mobile tele...
Linking quality, satisfaction and behaviour intentions in ghana’s mobile tele...Linking quality, satisfaction and behaviour intentions in ghana’s mobile tele...
Linking quality, satisfaction and behaviour intentions in ghana’s mobile tele...
 
A REVIEW OF SERVICE QUALITY MODELS
A REVIEW OF SERVICE QUALITY MODELSA REVIEW OF SERVICE QUALITY MODELS
A REVIEW OF SERVICE QUALITY MODELS
 
Ijbrm 144Customer Perceptions and Expectations Regarding Service Qualities in...
Ijbrm 144Customer Perceptions and Expectations Regarding Service Qualities in...Ijbrm 144Customer Perceptions and Expectations Regarding Service Qualities in...
Ijbrm 144Customer Perceptions and Expectations Regarding Service Qualities in...
 
10120140504014 2
10120140504014 210120140504014 2
10120140504014 2
 
Sem mobile service providers
Sem mobile service providersSem mobile service providers
Sem mobile service providers
 
Extended information technology enabled service quality model for life insura...
Extended information technology enabled service quality model for life insura...Extended information technology enabled service quality model for life insura...
Extended information technology enabled service quality model for life insura...
 
Extended information technology enabled service quality model for life insura...
Extended information technology enabled service quality model for life insura...Extended information technology enabled service quality model for life insura...
Extended information technology enabled service quality model for life insura...
 
The Determinants of Customer Loyalty in Telecommunication Industry of Pakistan
The Determinants of Customer Loyalty in Telecommunication Industry of PakistanThe Determinants of Customer Loyalty in Telecommunication Industry of Pakistan
The Determinants of Customer Loyalty in Telecommunication Industry of Pakistan
 
Valor optimo del durbin watson
Valor optimo del durbin watsonValor optimo del durbin watson
Valor optimo del durbin watson
 
An Empirical Analysis Of After Sales Service And Customer Satisfaction
An Empirical Analysis Of After Sales Service And Customer SatisfactionAn Empirical Analysis Of After Sales Service And Customer Satisfaction
An Empirical Analysis Of After Sales Service And Customer Satisfaction
 
Computers in Human Behavior (Mobile , VAS )
Computers in Human Behavior (Mobile , VAS )Computers in Human Behavior (Mobile , VAS )
Computers in Human Behavior (Mobile , VAS )
 
Quality Custom Essays
Quality Custom EssaysQuality Custom Essays
Quality Custom Essays
 

Recently uploaded

/:Call Girls In Indirapuram Ghaziabad ➥9990211544 Independent Best Escorts In...
/:Call Girls In Indirapuram Ghaziabad ➥9990211544 Independent Best Escorts In.../:Call Girls In Indirapuram Ghaziabad ➥9990211544 Independent Best Escorts In...
/:Call Girls In Indirapuram Ghaziabad ➥9990211544 Independent Best Escorts In...lizamodels9
 
Progress Report - Oracle Database Analyst Summit
Progress  Report - Oracle Database Analyst SummitProgress  Report - Oracle Database Analyst Summit
Progress Report - Oracle Database Analyst SummitHolger Mueller
 
India Consumer 2024 Redacted Sample Report
India Consumer 2024 Redacted Sample ReportIndia Consumer 2024 Redacted Sample Report
India Consumer 2024 Redacted Sample ReportMintel Group
 
Call Girls in DELHI Cantt, ( Call Me )-8377877756-Female Escort- In Delhi / Ncr
Call Girls in DELHI Cantt, ( Call Me )-8377877756-Female Escort- In Delhi / NcrCall Girls in DELHI Cantt, ( Call Me )-8377877756-Female Escort- In Delhi / Ncr
Call Girls in DELHI Cantt, ( Call Me )-8377877756-Female Escort- In Delhi / Ncrdollysharma2066
 
Call Girls In Sikandarpur Gurgaon ❤️8860477959_Russian 100% Genuine Escorts I...
Call Girls In Sikandarpur Gurgaon ❤️8860477959_Russian 100% Genuine Escorts I...Call Girls In Sikandarpur Gurgaon ❤️8860477959_Russian 100% Genuine Escorts I...
Call Girls In Sikandarpur Gurgaon ❤️8860477959_Russian 100% Genuine Escorts I...lizamodels9
 
The CMO Survey - Highlights and Insights Report - Spring 2024
The CMO Survey - Highlights and Insights Report - Spring 2024The CMO Survey - Highlights and Insights Report - Spring 2024
The CMO Survey - Highlights and Insights Report - Spring 2024christinemoorman
 
NewBase 19 April 2024 Energy News issue - 1717 by Khaled Al Awadi.pdf
NewBase  19 April  2024  Energy News issue - 1717 by Khaled Al Awadi.pdfNewBase  19 April  2024  Energy News issue - 1717 by Khaled Al Awadi.pdf
NewBase 19 April 2024 Energy News issue - 1717 by Khaled Al Awadi.pdfKhaled Al Awadi
 
Youth Involvement in an Innovative Coconut Value Chain by Mwalimu Menza
Youth Involvement in an Innovative Coconut Value Chain by Mwalimu MenzaYouth Involvement in an Innovative Coconut Value Chain by Mwalimu Menza
Youth Involvement in an Innovative Coconut Value Chain by Mwalimu Menzaictsugar
 
Islamabad Escorts | Call 03274100048 | Escort Service in Islamabad
Islamabad Escorts | Call 03274100048 | Escort Service in IslamabadIslamabad Escorts | Call 03274100048 | Escort Service in Islamabad
Islamabad Escorts | Call 03274100048 | Escort Service in IslamabadAyesha Khan
 
Market Sizes Sample Report - 2024 Edition
Market Sizes Sample Report - 2024 EditionMarket Sizes Sample Report - 2024 Edition
Market Sizes Sample Report - 2024 EditionMintel Group
 
Keppel Ltd. 1Q 2024 Business Update Presentation Slides
Keppel Ltd. 1Q 2024 Business Update  Presentation SlidesKeppel Ltd. 1Q 2024 Business Update  Presentation Slides
Keppel Ltd. 1Q 2024 Business Update Presentation SlidesKeppelCorporation
 
Lean: From Theory to Practice — One City’s (and Library’s) Lean Story… Abridged
Lean: From Theory to Practice — One City’s (and Library’s) Lean Story… AbridgedLean: From Theory to Practice — One City’s (and Library’s) Lean Story… Abridged
Lean: From Theory to Practice — One City’s (and Library’s) Lean Story… AbridgedKaiNexus
 
Lowrate Call Girls In Sector 18 Noida ❤️8860477959 Escorts 100% Genuine Servi...
Lowrate Call Girls In Sector 18 Noida ❤️8860477959 Escorts 100% Genuine Servi...Lowrate Call Girls In Sector 18 Noida ❤️8860477959 Escorts 100% Genuine Servi...
Lowrate Call Girls In Sector 18 Noida ❤️8860477959 Escorts 100% Genuine Servi...lizamodels9
 
8447779800, Low rate Call girls in New Ashok Nagar Delhi NCR
8447779800, Low rate Call girls in New Ashok Nagar Delhi NCR8447779800, Low rate Call girls in New Ashok Nagar Delhi NCR
8447779800, Low rate Call girls in New Ashok Nagar Delhi NCRashishs7044
 
Call Girls In Sikandarpur Gurgaon ❤️8860477959_Russian 100% Genuine Escorts I...
Call Girls In Sikandarpur Gurgaon ❤️8860477959_Russian 100% Genuine Escorts I...Call Girls In Sikandarpur Gurgaon ❤️8860477959_Russian 100% Genuine Escorts I...
Call Girls In Sikandarpur Gurgaon ❤️8860477959_Russian 100% Genuine Escorts I...lizamodels9
 
Sales & Marketing Alignment: How to Synergize for Success
Sales & Marketing Alignment: How to Synergize for SuccessSales & Marketing Alignment: How to Synergize for Success
Sales & Marketing Alignment: How to Synergize for SuccessAggregage
 
Kenya’s Coconut Value Chain by Gatsby Africa
Kenya’s Coconut Value Chain by Gatsby AfricaKenya’s Coconut Value Chain by Gatsby Africa
Kenya’s Coconut Value Chain by Gatsby Africaictsugar
 
Global Scenario On Sustainable and Resilient Coconut Industry by Dr. Jelfina...
Global Scenario On Sustainable  and Resilient Coconut Industry by Dr. Jelfina...Global Scenario On Sustainable  and Resilient Coconut Industry by Dr. Jelfina...
Global Scenario On Sustainable and Resilient Coconut Industry by Dr. Jelfina...ictsugar
 
Flow Your Strategy at Flight Levels Day 2024
Flow Your Strategy at Flight Levels Day 2024Flow Your Strategy at Flight Levels Day 2024
Flow Your Strategy at Flight Levels Day 2024Kirill Klimov
 
Intro to BCG's Carbon Emissions Benchmark_vF.pdf
Intro to BCG's Carbon Emissions Benchmark_vF.pdfIntro to BCG's Carbon Emissions Benchmark_vF.pdf
Intro to BCG's Carbon Emissions Benchmark_vF.pdfpollardmorgan
 

Recently uploaded (20)

/:Call Girls In Indirapuram Ghaziabad ➥9990211544 Independent Best Escorts In...
/:Call Girls In Indirapuram Ghaziabad ➥9990211544 Independent Best Escorts In.../:Call Girls In Indirapuram Ghaziabad ➥9990211544 Independent Best Escorts In...
/:Call Girls In Indirapuram Ghaziabad ➥9990211544 Independent Best Escorts In...
 
Progress Report - Oracle Database Analyst Summit
Progress  Report - Oracle Database Analyst SummitProgress  Report - Oracle Database Analyst Summit
Progress Report - Oracle Database Analyst Summit
 
India Consumer 2024 Redacted Sample Report
India Consumer 2024 Redacted Sample ReportIndia Consumer 2024 Redacted Sample Report
India Consumer 2024 Redacted Sample Report
 
Call Girls in DELHI Cantt, ( Call Me )-8377877756-Female Escort- In Delhi / Ncr
Call Girls in DELHI Cantt, ( Call Me )-8377877756-Female Escort- In Delhi / NcrCall Girls in DELHI Cantt, ( Call Me )-8377877756-Female Escort- In Delhi / Ncr
Call Girls in DELHI Cantt, ( Call Me )-8377877756-Female Escort- In Delhi / Ncr
 
Call Girls In Sikandarpur Gurgaon ❤️8860477959_Russian 100% Genuine Escorts I...
Call Girls In Sikandarpur Gurgaon ❤️8860477959_Russian 100% Genuine Escorts I...Call Girls In Sikandarpur Gurgaon ❤️8860477959_Russian 100% Genuine Escorts I...
Call Girls In Sikandarpur Gurgaon ❤️8860477959_Russian 100% Genuine Escorts I...
 
The CMO Survey - Highlights and Insights Report - Spring 2024
The CMO Survey - Highlights and Insights Report - Spring 2024The CMO Survey - Highlights and Insights Report - Spring 2024
The CMO Survey - Highlights and Insights Report - Spring 2024
 
NewBase 19 April 2024 Energy News issue - 1717 by Khaled Al Awadi.pdf
NewBase  19 April  2024  Energy News issue - 1717 by Khaled Al Awadi.pdfNewBase  19 April  2024  Energy News issue - 1717 by Khaled Al Awadi.pdf
NewBase 19 April 2024 Energy News issue - 1717 by Khaled Al Awadi.pdf
 
Youth Involvement in an Innovative Coconut Value Chain by Mwalimu Menza
Youth Involvement in an Innovative Coconut Value Chain by Mwalimu MenzaYouth Involvement in an Innovative Coconut Value Chain by Mwalimu Menza
Youth Involvement in an Innovative Coconut Value Chain by Mwalimu Menza
 
Islamabad Escorts | Call 03274100048 | Escort Service in Islamabad
Islamabad Escorts | Call 03274100048 | Escort Service in IslamabadIslamabad Escorts | Call 03274100048 | Escort Service in Islamabad
Islamabad Escorts | Call 03274100048 | Escort Service in Islamabad
 
Market Sizes Sample Report - 2024 Edition
Market Sizes Sample Report - 2024 EditionMarket Sizes Sample Report - 2024 Edition
Market Sizes Sample Report - 2024 Edition
 
Keppel Ltd. 1Q 2024 Business Update Presentation Slides
Keppel Ltd. 1Q 2024 Business Update  Presentation SlidesKeppel Ltd. 1Q 2024 Business Update  Presentation Slides
Keppel Ltd. 1Q 2024 Business Update Presentation Slides
 
Lean: From Theory to Practice — One City’s (and Library’s) Lean Story… Abridged
Lean: From Theory to Practice — One City’s (and Library’s) Lean Story… AbridgedLean: From Theory to Practice — One City’s (and Library’s) Lean Story… Abridged
Lean: From Theory to Practice — One City’s (and Library’s) Lean Story… Abridged
 
Lowrate Call Girls In Sector 18 Noida ❤️8860477959 Escorts 100% Genuine Servi...
Lowrate Call Girls In Sector 18 Noida ❤️8860477959 Escorts 100% Genuine Servi...Lowrate Call Girls In Sector 18 Noida ❤️8860477959 Escorts 100% Genuine Servi...
Lowrate Call Girls In Sector 18 Noida ❤️8860477959 Escorts 100% Genuine Servi...
 
8447779800, Low rate Call girls in New Ashok Nagar Delhi NCR
8447779800, Low rate Call girls in New Ashok Nagar Delhi NCR8447779800, Low rate Call girls in New Ashok Nagar Delhi NCR
8447779800, Low rate Call girls in New Ashok Nagar Delhi NCR
 
Call Girls In Sikandarpur Gurgaon ❤️8860477959_Russian 100% Genuine Escorts I...
Call Girls In Sikandarpur Gurgaon ❤️8860477959_Russian 100% Genuine Escorts I...Call Girls In Sikandarpur Gurgaon ❤️8860477959_Russian 100% Genuine Escorts I...
Call Girls In Sikandarpur Gurgaon ❤️8860477959_Russian 100% Genuine Escorts I...
 
Sales & Marketing Alignment: How to Synergize for Success
Sales & Marketing Alignment: How to Synergize for SuccessSales & Marketing Alignment: How to Synergize for Success
Sales & Marketing Alignment: How to Synergize for Success
 
Kenya’s Coconut Value Chain by Gatsby Africa
Kenya’s Coconut Value Chain by Gatsby AfricaKenya’s Coconut Value Chain by Gatsby Africa
Kenya’s Coconut Value Chain by Gatsby Africa
 
Global Scenario On Sustainable and Resilient Coconut Industry by Dr. Jelfina...
Global Scenario On Sustainable  and Resilient Coconut Industry by Dr. Jelfina...Global Scenario On Sustainable  and Resilient Coconut Industry by Dr. Jelfina...
Global Scenario On Sustainable and Resilient Coconut Industry by Dr. Jelfina...
 
Flow Your Strategy at Flight Levels Day 2024
Flow Your Strategy at Flight Levels Day 2024Flow Your Strategy at Flight Levels Day 2024
Flow Your Strategy at Flight Levels Day 2024
 
Intro to BCG's Carbon Emissions Benchmark_vF.pdf
Intro to BCG's Carbon Emissions Benchmark_vF.pdfIntro to BCG's Carbon Emissions Benchmark_vF.pdf
Intro to BCG's Carbon Emissions Benchmark_vF.pdf
 

The Effects of Service Quality Dimensions on Customer Satisfaction: An Empirical Investigation in Syrian Mobile Telecommunication Services

  • 1. International Journal of Business and Management Invention ISSN (Online): 2319 – 8028, ISSN (Print): 2319 – 801X www.ijbmi.org || Volume 4 Issue 5|| May. 2015 || PP-81-89 www.ijbmi.org 81 | Page The Effects of Service Quality Dimensions on Customer Satisfaction: An Empirical Investigation in Syrian Mobile Telecommunication Services Wael Rahhal Marketing and International Trade Department Higher Institute of Business Administration Syria –Damascus ABSTRACT: The effect of the perceived service quality on customer satisfaction is an issue still under debate in the academic literature. Thus, the primary goal of this article is to analyze the effects of service quality dimensions on Customer Satisfaction in Syrian mobile phones companies, The present study strives to develop a valid and reliable instrument to measure customer perceived service quality incorporating both service delivery as well as technical quality aspects. This study was used to gather data relevant to the proposed hypothesis from a convenience sample of 600 mobile phone service users, and was distributed among the Damascus and Aleppo, a total of 460 (76.6%) valid questionnaires were collected and used for analysis. Through a survey of 460 regular users of mobile services, a seven dimensional service quality instrument is revealed, which is empirically tested for unidimensionality, reliability, and construct validity using confirmatory factor analysis. The findings of this study shows the direct significant impact of service quality on customer satisfaction, and this effect had appeared through three dimensions (network quality, responsiveness, reliability) and there are no direct effect of other dimensions on customer satisfaction. Syrian companies must know how provide superior network quality which be considered as critical by the respondents in judging the quality of mobile communication services and satisfaction in the Syrian context. KEYWORDS: Service Quality Dimensions, Customer Satisfaction, Telecommunication, Syria. I. INTRODUCTION Service Quality has been a frequently studied topic in the service marketing literature. It has become an important means of differentiation and path to achieve business success, and service quality researchers to date have paid attention to the issue of the dimensions of service quality. Researchers note that relevant service dimensions vary across different industries, which emphasizes a need for developing multiple scale items that provide adequate measures of service quality in a particular context (Bolton and Drew, 1994). Also, a model of service quality needs to be developed from the consumers' perspective, what consumers seek and evaluate in the market (Gronroos, 1984). The importance of Customer satisfaction as a core concept in marketing has led to numerous studies over past decades. The literature supports that satisfied customers are willing to buy more services or products, recommend them to others, and less price sensitive (Homburg et al., 2005). Hence, satisfaction is an essential factor related to company's future profit by increasing the customer retention rate (Anderson et al., 2004). II. LITERATURE REVIEW Service Quality Quality is defined as "overall excellence or superiority that consumers perceive form a product/service" (Zeithaml, 1988). Previous studies attempted to identify dimensions of service quality. For instance, Gronroos,(1984) proposed two distinct service dimensions: technical and functional quality. Technical quality is what consumers get as an outcome of an interaction with a service provider. A concept of technical quality is also studied in the form of core service quality – service /product- related offerings (McDougall and Levesque 2000). In turn, functional quality has to do with how the service is delivered. This dimension is not directly related to core service offerings, but include a broad range of service delivery items, such as perceptions of a firm's customer care and the manner of service personnel (Andelman et al., 1994) However, the most widely used service quality measurement tools include SERVQUAL (Parasuraman, Zeithaml and Berry, 1988) and SERVPERF (Cronin and Taylor, 1992). The SERVQUAL scale measures service quality, based on the difference between expectations and performance perceptions of customers using twenty-two items and five-dimensional structures. In the SERVPERF scale, service quality is operationalized through performance only scores based on the same twenty-two items and five-dimensional structure of SERVQUAL.
  • 2. The Effects of Service Quality Dimensions on Customer… www.ijbmi.org 82 | Page SERVQUAL is appreciated by researchers (Carman, 1990; Dabholkar, 1996; Zhu et al., 2002) for its robust and well-defined structure. However, many authors (Cronin and Taylor, 1992; Boulding et al., 1993; Jain and Gupta, 2004) found the SERVPERF scale to outperform the SERVQUAL scale in terms of both reliability and validity. Also the issue of universal dimensions of the SERVQUAL scale for various service applications is debatable. For service quality measurement in telecommunication (including fixed line and cellular mobile services), researchers have supported both SERVQUAL as well as SERVPERF tools. Some of the key findings in this area are highlighted in Table 1. Table I. Service Quality Measurement in Telecommunication Customer Satisfaction Customer satisfaction has been considered one of the most important constructs (Morgan et al. , 1996; McQuitty et al. , 2000), and one of the main goals in marketing (Erevelles and Leavitt, 1992). Satisfaction plays a central role in marketing because it is a good predictor of purchase behaviour (repurchase, purchase intentions, brand choice and switching behaviour) (Oliver ,1993; McQuitty et al. , 2000). Oliver(1997) offered definition of satisfaction ,stating that satisfaction is “the consumer's fulfillment response. It is a judgment that a product or service feature, or the product or service itself, provided (or is providing) a pleasurable level of consumption- related fulfillment, including levels of under- or over fulfillment”. And Kotler (1997) defines satisfaction as follows “satisfaction is a person’s feeling of pleasure or disappointed resulting from comparing a product’s perceived performance (or outcome) in relation to his or her expectations”. Consumer satisfaction research began in the marketing field in the 1970s and is currently based on the “disconfirmation of expectations paradigm” (Cadotte et al., 1987). This paradigm says consumer brand evaluation involves comparing actual performance with some standard. Three outcomes are likely: (1) Confirmation, where performance matches standards, leading to neutral feelings. (2) Positive disconfirmation, where performance is deemed better than standard, resulting in satisfaction. (3) Negative disconfirmation, where performance is deemed worse than standard, resulting in dissatisfaction. Therefore, it is commonly accepted that to determine satisfaction or dissatisfaction, comparisons must be made between customers’ expectations and the perceived performance of the product or service (Yi ,1990). Service Quality Dimensions and Satisfaction This study suggests a direct influence of service quality dimensions on satisfaction. Empirical findings of previous studies provided insights about the critical dimensions of service quality, which could be categorized under two groups as follows: Functional quality dimensions: This included five SERVQUAL (Parasuraman, Zeithaml and Berry, 1988) dimensions, namely, (reliability, responsiveness, assurance, empathy, and tangibles). Further, few items related to 'convenience' and 'complaint handling'. were also incorporated (Negi, 2009). Technical quality dimensions: In the context of cellular mobile communication, this dimension is No Author, Year Field of Study Key Findings 1 Leisen and Vance, 2001 Fixed line telephone services SERVQUAL instrument seems to be the best fitting model of service quality in the US and Germany. Service quality is important to overall customer satisfaction with telephone services. 2 Johnson and Sirikit, 2002 Both fixed line and cellular mobile services Service quality assessment using SERVQUAL performed reliably in the Thai telecommunication service settings. 3 Van der Wal, Pampallis and Bond, 2002 Cellular mobile services Focused on the customer’s perception of service quality. SERVQUAL instrument is reliable for the measurement of service quality in the telecommunication industry in South Africa. 4 Wang and Lo, 2002 Cellular mobile services Used SERVPERF scale for service quality measurement and found that network quality and empathy are the most important drivers of overall service quality in China’s mobile phone market. 5 Ranaweera and Neely, 2003 Fixed line telephone services Used SERVPERF with some modifications for service quality measurement. Study revealed that price perceptions and indifference moderated the relationship between service quality and customer retention. 6 Kim, Park and Jeong, 2004 Cellular mobile services Service quality has positive impact on customer satisfaction. Study revealed that call quality is the most important issue that impacts customer satisfaction for mobile services.
  • 3. The Effects of Service Quality Dimensions on Customer… www.ijbmi.org 83 | Page related to customer perceived network quality. The measures related to this dimension were derived from literature and the subsequent feedback gained during the exploratory interviews. These included items relating to network coverage (on highways, inside buildings, and basement), voice clarity, call drop, and network congestion. In all, eight dimensions for measuring service quality in cellular mobile telephony were identified, which are summarized in Table II. Negi (2009) explained that satisfaction is influenced by the dimensions (Reliability, Empathy, and Assurance). Table II. Critical Dimensions for Measuring Service Quality in Cellular Mobile Communication This leads to following hypothesis (based on SERVPERF): H1: Tangibles is positively associated with Customer Satisfaction. H2: Reliability is positively associated with Customer Satisfaction. H3: Responsiveness is positively associated with Customer Satisfaction. H4: Assurance is positively associated with Customer Satisfaction. H5: Empathy is positively associated with Customer Satisfaction. H6: Complaint handling is positively associated with Customer Satisfaction. H7: Convenience is positively associated with Customer Satisfaction. H8: Network quality is positively associated with Customer Satisfaction. III. RESEARCH METHODOLOGY Model, Sampling design and data collection Figure 1 provides a graphical summary of the conceptual framework that this study examines: Figure 1 A Conceptual Framework For The Effect Of Service Quality Dimensions On Customer Satisfaction Functional Reliability Ability to perform the service accurately and dependably, as promised. Parasuraman, Zeithaml and Berry, 1988; Rosen and Karwan, 1994 Responsiveness Willingness of the firm’s staff to help customers and provide prompt services. Parasuraman, Zeithaml and Berry, 1988; Rosen and Karwan, 1994 Assurance Knowledge and courtesy of employees and their abilities to inspire trust and confidence. Parasuraman, Zeithaml and Berry, 1988; Rosen Karwan,1994 Empathy Ability of the service provider to provide a caring and personalized attention to each customer Parasuraman, Zeithaml and Berry, 1988; Saleh and Ryan, 1991 Tangibles Appearance of physical facilities, equipment, personnel and communication materials. Parasuraman, Zeithaml and Berry, 1988; Rosen and Karwan, 1994 Convenience Implies flexible and comfortable facilities to suit the customers' needs. Carvalho and Leite 1999; Gagliano and Hathcote, 1994 Complaint handling Procedures to receive/handle customer complaints in time effective Negi 2009 Technical . Customer perceived network quality It is an indicator of network performance in terms of voice quality, call drop rate, network coverage, and network congestion. Naghshineh and Schwartz, 1996;Markoulidakis et. al., 2000; Sharma and Ojha 2004.
  • 4. The Effects of Service Quality Dimensions on Customer… www.ijbmi.org 84 | Page Data was collected through a field survey of (MTN and SYRIATEL) customers in Damascus and Aleppo, Syria. A sample of 600 mobile phone service users, and was distributed among the Damascus and Aleppo, a total of 460 (76.6%) valid questionnaires were collected and used for analysis. Table III shows the community demographics. Table III. Community demographics II. METHOD OF DATA OBTAINMENT Before conducting the final survey, a preliminary study was conducted with a sample size of 30, to judge the applicability of instrument items. For this purpose, statementsof the SERVQUAL instrument were modified (Parasuramanet al., 1991;Sharma and Ojha 2004; Negi, 2009) to best fit in the context of the Syrian setting, and additional dimensions related to service quality were asked of the respondents by using open-ended question. The study survey consisted of two sections: service quality dimensions, measured using 40 items; customer satisfaction, measured using three items. Respondents are asked to indicate their agreement level of each item of the sections on the five-point Likert scale anchored by ‟strongly agree (=1)” to ‟strongly disagree (=5)”. Analysis of results Measurement model This study employs a structural equation modeling (SEM) approach, using AMOS 18, to develop a model that represents the causal relationships among the variables (Chin, 2001). The questionnaire items (Appendix) employed to collect data were adapted from Parasuraman et al. (1991),Sharma and Ojha (2004)and Negi, (2009). Each variable was measured using previously developed components of instruments that have demonstrated good psychometric properties.. Exploratory Factor Analysis was conducted to define possible relationships of observed variables for service quality dimensions, the results indicated that the two dimensions (responsiveness and complaint handling) were combined into one dimension as 'Responsiveness' A confirmatory factor analysis (CFA) was conducted to empirically test the measurement model. Multiple tests on construct validity and reliability were performed, where items with low loading were eliminated, one item (service provider maintain the records accurately) from Reliability, two items (physical facilities at service provider are visually appealing, and service provider has up to date equipments/technology) from Tangibles, and one item (service provider has sufficient offices in Suburbs to facilitate easily the sales after sales services) from convenience. Model fit was evaluated using the maximum likelihood (ML) method. Construct reliability: Construct reliability was assessed using Cronbach’s α, composite reliability (CR) and average variance extracted (AVE) using CFA. As the α-values (Table IV) for all the constructs are greater N % Gender Male 255 55.4 Female 205 44.6 Total 460 100 Income (SP) Less than 10000 101 22.0 10000 -19999 147 32.0 20000 -29999 102 22.0 30000 to above 82 17.8 Total 432 93.9 Age Less than 21 53 11.5 21 -29 213 46.3 30 -39 111 24.1 40 to above 83 18.0 Total 460 100 Education level Under graduate 186 40.4 Post graduate 274 59.6 Total 460 100 SYRIATEL 232 50.4 Service Provider MTN 228 49.6 Total 460 100
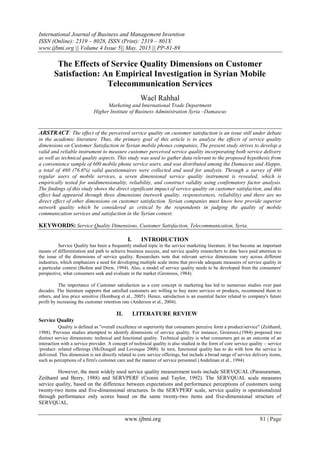
  • 5. The Effects of Service Quality Dimensions on Customer… www.ijbmi.org 85 | Page than the guideline of 0.70, it can be concluded that the scales can be applied for the analysis with acceptable reliability(Saunders et al., 2003). CR and AVE were calculated from model estimates using the CR formula and AVE formula given by Fornell and Larcker (1981). In the measurement model, all constructs had a CR over the cut-off of 0.70 and the AVE for all exceeded the recommended level of 0.5 (Bagozzi and Yi, 1988). Based on these assessments, measures used within this study were within the acceptable levels supporting the reliability of the constructs (TableIV). Content and discriminant validity: Content validity was verified by expert judgment and by a careful literature review, To assess the discriminant validity, Fornell and Larcker’s (1981) criterion, that square root of the AVE for each construct should be greater than the correlation between constructs, was used. Table Vshows the values of the square root of the AVE are all greater than the inter-construct correlations. Eight common model-fit measures were used to assess the model’s overall goodness of fit. As shown in Table VI, all the model-fit indices exceeded the respective common acceptance levels suggested by previous research (Kim et al.,2004), demonstrating that the measurement model exhibited a good fit with the data collected. Structural model Using AMOS 18, the researcher determine the path coefficients. Figure 2 shows the Results of structural model. Figure 2. Theoretical model tested
  • 6. The Effects of Service Quality Dimensions on Customer… www.ijbmi.org 86 | Page Table VII. Result of the structural model Notes: ***p<0.001, **p<0.01 Network quality showed a positive effect on Customer Satisfaction (β=0.360, p <0.001) Therefore, H8 confirmed (Table VII). In addition Responsiveness had a positive effect on Customer Satisfaction (β =0.284, p <0.001) Therefore, H3 was supported. Also Reliability had positive effect on Customer Satisfaction (β=0.156, p <0.01) Therefore , H2 was supported. IV. CONCLUSIONS AND IMPLICATIONS The research resulted in the development of a reliable and valid instrument for assessing customer perceived service quality for cellular mobile services. The resulting instrument is devised after a review of the literature and exploratory investigations followed by a series of acceptable validation procedures. On the basis of the findings revealed during the exploratory investigations, complaint handling, convenience and customer perceived network quality dimensions were added in the original SERVQUAL scale. Factor analysis indicates that “network quality” operates as a stand-alone dimension while “responsiveness and compliant handling” were merged as one to maintain high internal consistency, this also represents that respondents perceived both the dimensions as one. Further, the study highlighted the relative importance of service quality attributes, an attempt was made to identify the contribution of each service quality dimensions in predicting overall customer satisfaction. Network quality scored the highest (β=0.360, p<0.001) followed by the dimensions of Responsiveness (β =0.284, p<0.001) and Reliability (β=0.156, p<0.01). Findings of this study provide helpful guidelines for mobile service carriers in understanding key drivers of customer satisfaction. Looking at each individual dimension. Customer perceived network quality appeared at the first important place in predicting overall customer satisfaction. For this, service providers need to pay attention on providing adequate network coverage, voice clarity, and focus on reducing the congestion level in their network, as well as service providers should give social occasions more important, where customers need to use mobile phones more than usual. Additionally, responsiveness and complaint handling appeared at the second important place in predicting overall customer satisfaction, it is suggested that the contact employees should resolve the customer's complaints timely and that the customer's queries are taken seriously. This implies that cellular mobile service providers should invest in empowering the contact employees and providing them with adequate resources so that they can take prompt actions to customer queries. For this, they need to ensure that the employees are able to make important decisions regarding customers' requirements at their level, thereby providing adequate responsiveness. Additionally, reliability factor also appeared at the third important place in predicting overall customer satisfaction, thus, the service providers need to focus on performing the service right the first time, providing the services at the promised time. Path Coefficients (Beta) t-values p-value Result Network quality Customer Satisfaction 0.360 7.971 *** Supported Responsiveness Customer Satisfaction 0.284 3.892 *** Supported Convenience Customer Satisfaction 0.009 0.212 0.832 Not supported Tangibles Customer Satisfaction 0.009 0.146 0.884 Not supported Assurance Customer Satisfaction 0.072 1.266 0.206 Not supported Empathy Customer Satisfaction 0.072 1.256 0.209 Not supported Reliability Customer Satisfaction 0.156 2.849 0.004** supported
  • 7. The Effects of Service Quality Dimensions on Customer… www.ijbmi.org 87 | Page V. LIMITATION AND FUTURE RESEARCH The study has been carried out in the Damascus and Aleppo cities, where the income level and population density is very high as compare to rest of Syria; hence, the results are not necessarily generalizable for the whole country or other countries. This research focused on service quality and its effect on customer satisfaction. However, the research did not study the association between customer satisfaction and retention for corporate customers. The results coming from the mobile phone service industry might not be applicable to other service businesses. In other service fields, building a broader understanding of the effect of the factors related to customer satisfaction should create new possibilities in terms of understanding how to increase satisfaction . REFERENCE [1] Adelman, Mara B., Aaron Ahuvia and Cathy Goodwin (1994), “Beyond Smiling,” in Service Quality: New Directions in Theory and Practice, Roland T. Rust and Richard L. Oliver, Eds. New York: Sage, pp.71-139. [2] Anderson, Eugene W., Clases Fornell, Sanal K. Mazvancheryl (2004), “Customer Satisfaction and Shareholder Value”,Journal of Marketing, Vol.68,No.4, pp.172-185. [3] Bagozzi, R. and Yi, Y. (1988) . "On the evaluation of structural equation models",Journal of the Academy of Marketing Science, Vol. 16 No. 1, pp. 74-94. [4] Bolton, Ruth N. and James H. Drew (1994), "Linking Customer Satisfaction to Service Operations and Outcomes" in Roland T. Rust and Richard L. Oliver (Eds.), Service Quality: New Directions in Theory and Practice, New York Sage, Publications, Inc., pp.173-200. [5] Boulding, W; Kalra, A; Staelin, R and Zeithaml, V A (1993), "A Dynamic Process Model of Service Quality: From Expectations to Behavioural Intentions", Journal of Marketing Research, Vol. 30, No.1, pp. 7-27. [6] Cadotte, E., Woodruff, R. &Jenkins, R. (1987), “Expectations and norms in models of consumer satisfaction”, Journal of Marketing Research, Vol. 24, No. 3, pp. 305-14. [7] Carman, JM (1990), "Consumer Perception of Service Quality: An Assessment of the SERVQUAL Dimensions" , Journal of Retailing, Vol.66, No. 1, pp. 33-55. [8] Carvalho de, F A and Leite, V A (1999), "Attribute Importance in Service Quality: An Empirical Test of the PBZ Conjecture in Brazil", International Journal of Service Industry Management, Vol.10, No.5, pp.487-504. [9] Chin, W. (2001). PLS-graph user’s guide. PLS-Graph User’s Guide Version 3.0, Soft Modeling Inc, Houston, TX. [10] Cronin J. and Taylor SA. (1992), “Measuring Service Quality: A Reexamination and Extension”,Journal of Marketing, Vol.56, No.3, pp. 55-68. [11] Dabholkar, P A (1996), "Consumer Evaluations of New Technology-Based Self-Service Operations: An Investigation of Alternative Models", International Journal of Research in Marketing, Vol.13, Vol.1, pp. 29-51. [12] Erevelles, S. &Leavitt, C. (1992) “A comparison of current models of consumer satisfaction/dissatisfaction” Journal of Consumer Satisfaction, Dissatisfaction and Complaining Behavior, vol.5, pp. 104–114. [13] Fornell, C. and Larcker, D. (1981)."Evaluating structural equation models with unobservable variables and measurement error" , Journal of Marketing Research, Vol. 18 No. 1, pp. 39-50. [14] Gagliano, K B and Hathcote, J (1994). "Customer Expectations and Perceptions of Service Quality in Apparel Retailing", Journal of Services Marketing, Vol.8, No.1, pp. 60-69. [15] Gronroos, C. (1984), ‘‘A service quality model and its marketing implications’’, European Journal of Marketing, Vol. 18 No. 4, pp. 36-44. [16] Homburg C., Koschate N., and Hoyer W.D.(2005), “Do Satisfied Customer Really Pay More? A Study of the Relationship Between Customer Satisfaction and Willingness to Pay”, Journal of Marketing , Vol.69, No.2, pp.84-96. [17] Jain, S K and Gupta, Garima (2004), "Measuring Service Quality: SERVQUAL vs. SERVPERF Scales", Vikalpa, The Journal for Decision Makers, Vol.29, No.2, pp. 25-37. [18] Johnson, W C and Sirikit, A (2002). "Service Quality in the Thai Telecommunication Industry: A Tool for Achieving a Sustainable Competitive Advantage", Management Decision, Vol.40, No.7, pp. 693-701. [19] Kim, M; Park, M and Jeong, D (2004). "The Effects of Customer Satisfaction and Switching Barrier on Customer Loyalty in Korean Mobile Telecommunication Services", Telecommunications Policy, Vol.28, No.2, pp. 145-159. [20] Kotler ,p.(1997) “Managing service businesses and product support services”, Prentice Hall. [21] Leisen B., and Vance C.,(2001), “Cross-National Assessment of Service Quality in the Telecommunication Industry: Evidence from the USA and Germany”, Managing Service Quality, Vol.11,No.5, P.307-317. [22] Markoulidakis, J G; Dermitzakis, J E; Lyberopoulos, G L and Theologou, M E (2000). "Optimal System Capacity in Handover Prioritized Schemes in Cellular Mobile Communicatio Telecommunication Systems", Computer Communications, Vol.23, pp.462- 475. [23] McDougall G., and Levesque T., (2000), "Customer Satisfaction with Services: putting perceived value into the equation", Journal of Services Marketing, Vol.14, No.4/5, pp.392-410. [24] McQuitty, S., Finn, A. & Wiley, J.B. (2000) "Systematically varying consumer satisfaction and its implications for product choice", Academy of Marketing Science Review. [25] Morgan, M.J., Attaway, J.A. & Griffin, M. (1996) "The role of product/service experience in the satisfaction formation process: a test of moderation”, Journal of Consumer Satisfaction, Dissatisfaction and Complaining Behavior, vol.9, pp104–114. [26] Naghshineh, M and Schwartz, M (1996). "Distributed Call Admission Control in Mobile/Wireless Networks", IEEE Journal on Selected Areas of Communication, Vol.14, No.4, pp. 711-717. [27] Negi R., (2009)."Determining Customer Satisfaction Through Perceived Service Quality: A Study Of Ethiopian Mobile Users"International Journal of Mobile Marketing, Vol.4, No.1, P31-38. [28] Oliver, R.L. (1993) "Cognitive, affective and attribute bases of the satisfaction response", Journal of Consumer Research, Vol. 20, pp. 418–430. [29] Oliver, R.L., (1997), “Satisfaction: A Behavioral Perspective on the Consumer”, in McMullan, Rosalind & Gilmore, Audrey., (2003), “The Conceptual Development of Customer Loyalty Measurement: A Proposed Scale”, Journal Of Targeting, Measurement and Analysis for Marketing,Vol.11, No.3, pp. 230-243.
  • 8. The Effects of Service Quality Dimensions on Customer… www.ijbmi.org 88 | Page [30] Parasuraman A., Zeithaml V.A. and Berry L. (1988), “SERVQUAL: a multiple-item scale for measuring consumer perceptions of service quality,” Journal of Retailing, Vol. 64, No. 1, pp. 12-40. [31] Parasuraman A., Zeithaml V.A. and Berry L. (1991), “Perceived Service Quality as a Customer-Based Performance Measure: An Empirical Examination of Organizational Barriers Using an Extended Service Quality Model”,Human Resource Management, Vol.30, No.3, P. 335-364. [32] Ranaweera, C and Neely, A (2003). "Some Moderating Effects on the Service Quality-Customer Retention Link", International Journal of Operations & Production Management, Vol. 23, No.2, pp. 230-248. [33] Rosen and Karwan (1994). “ Prioritizing the Dimensions of Service Quality”,International Journal of Service Industry Management , Vol.5,No.4, pp. 39-53. [34] Saleh, F and Ryan, C (1991). "Analyzing Service Quality in the Hospitality Industry Using the SERVQUAL Model", The Service Industries Journal, Vol.11, No.3, pp. 324-343. [35] Saunders, M., Lewis, P. and Thornhill, A. (2003). Research Methods for Business Students, 3rd ed., Financial Times Prentice- Hall, London. [36] Sharma N., and Ojha S., (2004). “Measuring Performance in Mobile Communications" , Service Industries Journal , Vol.24,No.6, pp. 109-128 . [37] Van der Wal, R W E; Pampallis, A and Bond, C (2002). "Service Quality in a Cellular Telecommunications Company: A South African Experience", Managing Service Quality, Vol.12, No. 5, pp. 323-335. [38] Wang Y., and Po Lo H., (2002), “Service Quality, Customer Satisfaction and behavior intentions-Evidence from China’s Telecommunication Industry”, The Journal of Policy Regulation and Strategy for telecommunication Information and Media, Vol.4, No.6, pp.50-60. [39] Yi, Y. (1990), “A critical review of consumer satisfaction”,in Zeithaml, V.A. (Ed.), Review of Marketing 1990, American Marketing Association, Chicago, IL, pp. 68-123. [40] Zeithaml V.A., (1988), “Consumer Perceptions of Price, Quality, and Value: A Means-End Model and Synthesis of Evidence”, Journal of Marketing, Vol.52, No.3, pp. 2-22. [41] Zhu, F X; Wymer, W J and Chen, I (2002), "IT-based Services and Service Quality in Consumer Banking", International Journal of Service Industry Management, Vol.13, No.1, pp. 69-90. APPENDIX. QUESTIONNAIRE, VARIABLE ITEMS Service Quality Dimensions: Tangibles 1. Service Provider has up-to-date equipments/technology. 2. Physical facilities at service provider are visually appealing. 3. Employees are well dressed and neat in appearance. 4. Materials associated with the service (such as pamphlets or statement) will be visually appealing in an excellent company. 5. Company website is visually appealing. Reliability 6. When promises to do something, service provider does so. 7. Excellent telephone companies provide its services at the time it promises to do so. 8. Service provider shows sincere interest in solving customers’ problems. 9. Excellent telephone companies will perform the service right the first time. 10. Service provider is dependable. 11. Service provider maintains the records accurately. 12. Service provider updates the records accurately. Responsiveness 13. Service related information is easily obtainable from the provider 14. Employees provide services promptly to the customers. 15. Employees are always willing to help the customers. 16. Despite their busyness, employees respond promptly to customers’ requests. 17. Employees of excellent telephone companies will tell customer exactly when services will be performed. Assurance 18. Employees behavior instill confidence in customers. 19. Customers feel assure that service requests are duly follow-up by the company. 20. Employees providing service to customers are courteous and friendly. 21. Employees maintain adequate knowledge to handle customer queries. 22. Customer of excellent telephone companies will safe in their transactions. Empathy 23. Excellent telephone companies will give customers individual attention. 24. Employees interacting customers pay personal attention to them. 25. Service provider has customers’ best interests at heart. 26. Service provider understands the specific needs of the customers.
  • 9. The Effects of Service Quality Dimensions on Customer… www.ijbmi.org 89 | Page Complaint handling 27. Service provider has sufficient procedures to receive/handle customer complaints. 28. Procedures of complaint handling at service provider are time effective. Convenience 29. Convenient business hours 30. Service provider has sufficient offices in cities to facilitate easily the sales/after-sales services. 31. Service provider has sufficient offices in suburbs to facilitate easily the sales/after-sales services. Network quality 32. The coverage of this cellular network is strong on all the highways. 33. The signal is strong even inside the buildings including basement. 34. All parts of the city including suburbs are reasonably covered by this network. 35. Service network maintains excellent voice quality and without interruption. 36. You are able to make calls at peak hours. 37. Your call gets connected to the called person during first attempt most of the time. 38. Sending / Receiving SMS is fast. 39. Downloading (ringtones, photos, songs……etc) are fast. 40. Receiving Traffic information are accurate. Customer satisfaction 1. I am happy with the telephone company. 2. I am satisfied with the telephone company. 3. My choice to deal with this telephone company is a wise one.