Impact of FDI on Employment Generation: Nexus in Afghanistan

This study aims to analyze the effect of foreign direct investment (FDI) on new job creation, and pays attention to factors interrelated to employment by using the case of Afghanistan. Using time series data form 2003 to 2017, this paper explore the driving forces and reduction potentials of employment in Afghanistan with consideration for dynamic changes within the traditional OLS and standardize OLS model. The results show that exchange rate plays a dominant role in increasing employment in Afghanistan. And exports and inflation rate plays a dominant role in decreasing employment in Afghanistan. All variables are co-integrated and the analysis of the impulse response function and variance decomposition turns out to be synchronous. Furthermore, in the short run export and inflation rate are more critical in reduction potentials of employment in Afghanistan. Policies should be advised to control inflation rate and illegal export and improve the investment projects to attract more FDI into the economy for quick adjustment purpose in case of the shock to the system.

Recommended
Recommended
More Related Content
What's hot
What's hot (20)
Similar to Impact of FDI on Employment Generation: Nexus in Afghanistan
Similar to Impact of FDI on Employment Generation: Nexus in Afghanistan (20)
More from International Journal of Economics and Financial Research
More from International Journal of Economics and Financial Research (20)
Recently uploaded
Recently uploaded (20)
Impact of FDI on Employment Generation: Nexus in Afghanistan
- 1. International Journal of Economics and Financial Research ISSN(e): 2411-9407, ISSN(p): 2413-8533 Vol. 4, Issue. 12, pp: 354-361, 2018 URL: https://arpgweb.com/journal/journal/5 DOI: https://doi.org/10.32861/ijefr.412.354.361 Academic Research Publishing Group *Corresponding Author 354 Original Research Open Access Impact of FDI on Employment Generation: Nexus in Afghanistan Mr. Riazullah Shinwari* China University of Geo-sciences, School of Economics and Management, No. 388 Lumo Road,Wuhan, P.R. China Prof. Bai Yongliang China University of Geo-sciences, Faculty of Economics and Management, No. 388 Lumo Road,Wuhan, P.R. China Abstract This study aims to analyze the effect of foreign direct investment (FDI) on new job creation, and pays attention to factors interrelated to employment by using the case of Afghanistan. Using time series data form 2003 to 2017, this paper explore the driving forces and reduction potentials of employment in Afghanistan with consideration for dynamic changes within the traditional OLS and standardize OLS model. The results show that exchange rate plays a dominant role in increasing employment in Afghanistan. And exports and inflation rate plays a dominant role in decreasing employment in Afghanistan. All variables are co-integrated and the analysis of the impulse response function and variance decomposition turns out to be synchronous. Furthermore, in the short run export and inflation rate are more critical in reduction potentials of employment in Afghanistan. Policies should be advised to control inflation rate and illegal export and improve the investment projects to attract more FDI into the economy for quick adjustment purpose in case of the shock to the system. Keywords: FDI; Employment; Import & export; OLS; Afghanistan. CC BY: Creative Commons Attribution License 4.0 1. Introduction FDI are generally considered to have a major contribution to the economic development of emerging economies, on the other hand , FDI are also important for developed economies, apparent both developed economies and emerging economies have a common interest in encouraging FDI flows, although their goals are different Resmini (2000); Estrin and Klaus (2004); Coe et al. (1997). The positive externalities of FDI are for host economies, while corporate profits and growth is a typical goal for multinational companies that are globally oriented. A positive impact of FDI on economic growth has been confirmed by number of studies by researchers such as Lunn (1980), Schneider and Frey (1985) Schneider and Frey (1985) Carkovic and Levine (2002). FDI contributes to the economic growth through several channels. First, it is expected to achieve the economies development through capital accumulation more inputs being incorporated into the production process and the existence of a wider range of intermediate goods Carkovic and Levine (2002); Buckley and Mark (1998); Feenestra and Markusen (1994). Secondly, FDI is an important source of technologies change and improving human capital and have the effect of promoting modern technology in the host country Borensztein et al. (1998). Is indicates that additional foreign direct investment will be generated more employment of labor in the long run and thereby making the absorptive capacity of the economy to be increased. Form the classical point of view, unemployment and wage rate are negatively related showing that as there are more demand for goods and services, wages will increase and employment will be demanded for. Salami (2013), stated FDI which is the other concept inbound in FI are investment made by an organization or individuals in one nation in business interested in another nation, in the form of either establishing business operation or acquiring business assets in the other country, such as ownership or controlling interest in a foreign direct company. In contrast to this, Rizvi and and Nishat (2009) concluded their study of the impact of FDI on employment opportunities in India, China and Pakistan, by stating that it would not suffice to expect FDI to create a direct impact on employment opportunities in the above mentioned countries. They also suggest that in addition to FDI enhancement polices, other measures to boost employment growth should be generated. Unemployment rate stayed unaffected in Afghanistan during the last two fiscal years, in (2017) at 8.80 percent from 8.80 in 2016. Science 1991 until 2017 Afghanistan is facing high rate of unemployment which is causes poverty, education, and low per capita income and GDP growth. Averaged unemployment rate is 9.60 percent, reaching an all-time high of 12.40 percent in 1993 and a record of 6.70 percent in 2009 (trading economic). According to World Bank data relationship between FDI and employment in Afghanistan since 2001 until 2017 shows there slightly impact on employment generation, the lowest is employment rate is 0.26percent and the very high is 1.32 percent. in (2001) FDI % 0.03, employment 0.62, (2005) FDI % 4.32, employment 0.88, (2010) DFI % 1.2, employment 1.21, and finally (2017) FDI% 0.26, employment 1.24, on the other hand in same period GPD% growth rate is comparatively significant and satisfactory due to FDI inflows percentage. The most recent household survey mid-term result (ALCS 2016/2017) show an increase in the unemployment rate about 1 percent point over the past two years. In 2013/14 the unemployment rate stood at 22.6 percent, female employment rate higher two in half times than male. It is primarily severe amongst low skill, illiterate workers, who are at the greatest risk to falling in poverty. Sustained demographic pressures and sluggish economic growth
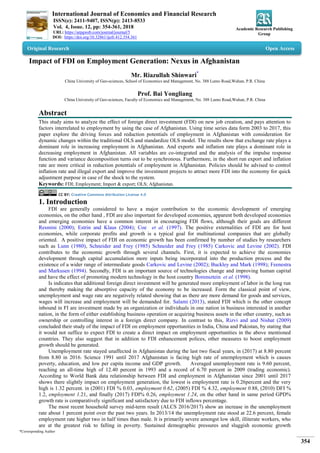
- 2. International Journal of Economics and Financial Research 355 exacerbate unemployment situation, average annual population growth rate of 3 percent with estimated 400,000 Afghans entering the labor market each year. Higher economic growth rates required to improve per capita incomes and provide best opportunities for expanding workforce (World Bank report, Nov 2017). Source: World Bank Data Indicators, 2018 2. Conceptual Framework FDI are particularly important for transition economies because these economies have insufficient reserves and the technology and the capital are needed in order to stimulate economic growth Billington, 1999; Bevan and Estrin, 2000. The international capital flows, through the magnitude of their composition and stability are important for the transition to a market economy Garibaldi et al. 2002, Neuhaus, 2006. After receiving foreign capital, Romania has recorded high growth rates for the period 2005-2008. In a considerable way, this growth can be explained by the FDI that contributes by using new technologies, knowledge, and employment in the host country and opening new markets for them. According to Obadan and Odusola (2001), the growth of employment is demand determinants of long term growth of output also influence the growth rate of employment. Foreign direct investment feeds receiver countries through the capital inflows, technical involvement, human capital improvement and managerial proficiency compulsory for supportable economic development according to Abdoulaye and XieKefan (2015). this section is focus on to highlight the nature and measurement of these economic growth variables around which the whole study revolves. The next section is focus on the methodology and analysis of these variables. In accumulation a number of literature that focuses on FDI and employment, there is the other aspect of literature that discover the impact of inward FDI on job creation, such as Tang and Gyasi (2012), which was focused to employment activities. Chinese investments have impacted the economy of Ghana. Their results from this study show that, about 8 percent or more of investments from China have been mostly concentrated in manufacturing. Kim and Han (2014) focused on location patterns of inward FDI in Korea and explored local impacts of job creation with respect to flows of capital, people and economic activities. There findings show that foreign capital has added to the vivacity of the economy, creating job opportunities. Manufacturing has brought larger-scale employments than producer services due to the labor-intensive industrial nature. 3. Econometric Methodology 3.1. Unit Root Test The reliability of statistical inference depends on the distinction between stationary and non-stationary (or integrated) time series. Shocks to a stationary time series are momentary due to constant mean and variance over time. In turn, non-stationary time series has time dependent mean and variance giving raise to permanent fluctuations after shock. Keeping in view the importance of peculiar characteristic of time series, it is necessary to check the stationary properties of the variables using appropriate unit root tests,these tests include inter alia ADF, Phillips- Perron and Ng-Perron tests. The general form of various tests is: (1) The equation for intercept and no trend can be written as follows: ∑ (2) 3.2. Cointegration Test To investigate the relationship among variables several econometric techniques have been proposed in the literature. Univariate cointegration examples include Engle and Granger (1987) and the fully modified OLS procedure of 0 5 10 15 20 25 1 2 3 4 5 6 7 8 9 10 11 12 13 14 15 16 17 %Growth years GDP (%) FDI (%) employment
- 3. International Journal of Economics and Financial Research 356 Phillips and Hansen (1990). With regard to multivariate cointegration, Johansen S. (1988) and Johansen and Juselius (1990) full information maximum likelihood procedure are widely used in empirical research. We can apply Ordinary least-square (OLS) method to investigate the cointegration among FDI, employment rate and, other variables. 3.3. Regression Model Suppose the equation 1 has a linear relationship, it can be written as; We also run standardized regression model for advantages, 3.4. Granger Causality Granger causality tests endeavors to establish if changes in FDI precede change in EMR, this is, FDI causes EMR and not causing FDI. The Granger causality test in vector auto regressive model (VAR) format can be expressed as follows: ∑ ∑ ∑ ∑ Equation (7) assumes that current EMR is belongs to past values of itself as well as that of FDI, and (8) postulates a similar behavior for FDI. There are four possibilities for Granger causality 4. Data and Estimation of the Model 4.1. Data Overview Time serious secondary data over the period 2003 – 2017 have been used for analysis. Based on data availability, FDI data is taken in (% of GDP). Employment to population ratio in (%), export & import are also (% GDP). Official exchange rate to dollar and inflation consumer prices (annual %). The data are collected from the World Bank Development indicators (WDI, 2017 www.worldbank.org). All variables are taken in natural logarithm form. Table-1. Correlation and Descriptive statistics and correlation EMR FDI IMP EXP EX_RATE INF_RATE Mean 3.878 -0.298 3.750 2.385 3.969 1.240 Std. Dev. 0.013 1.068 1.073 0.960 0.125 1.194 Skewness 0.481 0.416 -3.076 -0.716 1.033 0.163 Kurtosis 2.133 1.717 11.463 3.585 2.747 1.643 Jarque-Bera 1.048 1.463 68.419 1.496 2.712 1.216 EMR 1 FDI -0.3033 1 IMP -0.525 0.456 1 EXP -0.613 0.736 0.830 1 EX_RATE 0.919 -0.433 -0.595 -0.677 1 INF_RATE -0.282 -0.079 0.258 0.125 -0.257 1 Table 1 provides descriptive statistics of the variables along with correlation matrix of the variables. Standard deviations of the variables indicate that all other variables are less volatile followed by EMR and FDI. Correlation results show that some variables are not positively correlated with each other and these correlations are not statistically significant. There is negative correlation between EMR and FDI followed by other variables. 4.2. Unit Root Test The result of the unit root tests are presented in Table 2 the data are in linear form with no trend and intercept. It is evident that all the variables are stationary at I (1). The implication of the results presented in table 2 is that there is a tendency of producing a spurious regression result should the data be used in the linear form.
- 4. International Journal of Economics and Financial Research 357 Table-2. Unit Root Test for Stationary with Constant Only/ None intercept variable Level 1 diff 2 diff Conc. FDI -1.067 -3.411(0.0025) -6.428(0.0001) EMR 1.796 -6.640(0.0000) -3.320(0.0038) EXP -5.406(0.000) -2.456(0.018) -5.431(0.0001) IMP -1.945(0.0523) -1.487(0.123) -3.517(0.0022) EXR 2.045 -1.998(0.047) -4.007(0.0009) INF -2.926(0.0067) -5.156(0.0001) -6.436(0.0000) *, ** and *** implies significant 10%, 5% and 1% respectively, Table-3. Leg selection criteria Lag LogL LR FPE AIC SC HQ 0 7.124409 NA 3.39e-08 -0.172986 0.087760 -0.226581 1 129.5075 112.9690* 1.23e-13* -13.46268 -11.63746 -13.83785 2 1952.129 0.000000 NA -288.3275* -284.9379* -289.0243* *indicate that the leg order is selected by criterion LR: Sequential modified LR test statistics (each test at 5% level), FPE: final prediction error, AIC: Akaike information criterion. SC: Schwarz information crieterion, HQ: Hannan-Quinn information criterian 4.3. OLS Model The table below presents the results of the ordinary or traditional OLS model. Our traditional and standardize OLS results are presented in table 4 and 5 respectively. The constant term, the coefficient of FDI, import and exchange rate of traditional OLS linear regression are respectively 3.494, 0.000, 0.097 all are positive, but the coefficient of export and inflation rate are negative in table 4, 5. Table-4. Dependent Variable EMR Variable Coefficient S.E T.value P.value Constants 3.494 0.076 45.449 0.000 FDI 0.0003 0.002 1.215 0.255 IMP 0.002 0.003 0.751 0.472 EXP -0.004 0.005 -0.970 0.357 EXR 0.097 0.018 5.357 0.000*** INF -0.000 0.000 -0.292 0.777 *, ** and *** implies significant 10%, 5% and 1% respectively. Multiple R-squared: 0.870, Adjusted R-squared: 0.799, F-statistic: 12.105, DW: 3.545 4.4. Result Of the Standardize Linear Regression Model Table 5 demonstrate the result of the standardize regression model. Gujarati (2004) states in standardize regression all variables are put in equal basis. In this case all the coefficients can be compared directly with one another. If the coefficient of one standardize regressor is greater than another standardize in the model, then the earlier contributes more relatively to the explanation of the regressand than the later. The economics significance of the variables in table 4 remains the same in table 5, their statistical significance differs dramatically. Regression on the Standardize variable shows that exchange rate makes the greatest positive and significance contribution to Afghanistan employment status. While inflation rate and export impacts negatively on the economy of Afghanistan. Table-5. Standardize OLS / dependent variable (EMR) Variable Coefficient Std. Error t-Statistic Prob. FDI 0.194107 0.153450 1.264953 0.2377 IMPORT 0.092712 0.267984 0.345962 0.7373 EXPORT -0.238297 0.267552 -0.890659 0.3963 EX_RATE 0.874596 0.137319 6.369082 0.0001 INF__RATE -0.179167 0.114836 -1.560199 0.1531 *, ** and *** implies significant 10%, 5% and 1% respectively. Multiple R-squared: 0.892, Adjusted R-squared: 0.832, F-statistic: 14.853, DW: 3.464 4.5. Cointegration Analysis To determine the existence of long run cointegration relationship among FDI and employment rate, OLS regression model is applied using the data period (2003 – 2017). Table 4 and 5 provides the estimated results. Wilhelms and Itter (1998) conducted partly similar work to ours, submit that the robustness of unlogged regression results could be tested by using the semi-logged (linear-log) and the logged forms of the variables, following this clues we presents the standardize OLS result of the log-log forms of the variables in tables. Comparison of Table 4 and 5 discloses not only stimulating difference but it also indicates some good similarities, the log-log regression form shows a higher contribution of exchange rate to employment. The Durbin-Watson (DW) statistic test is
- 5. International Journal of Economics and Financial Research 358 generally used for the presence of autocorrelation in a data. BLUE (Best Linear Unbiased Estimator) property of OLS is lost in the presence of autocorrelation. Whether a regression result contains autocorrelation or not depends on the closeness of departure of the associated DW statistics to or from 2 respectively. The DW statistic associated with table 4 and 5 are respectively 3.464 and 3.545. The negative sign of inflation equally makes more economics sense than the positive sing reported in table 4 Table-6. Standardized linear regression model/ dependent variable ln (EMR) Variable Coefficient Std. Error t-Statistic Prob. ln(FDI) 0.240384 0.197852 1.214969 0.2553 ln(IMP) 0.181255 0.241332 0.751059 0.4718 ln(EXP) -0.325328 0.335295 -0.970272 0.3573 ln(EX_R) 0.901164 0.168207 5.357486 0.0005 ln(INF__R) -0.038109 0.130434 -0.292174 0.7768 *, ** and *** implies significant 10%, 5% and 1% respectively Multiple R-squared: 0.870, Adjusted R-squared: 0.799,F-statistic: 12.105, DW: 3.545 4.6. Granger Causality Test (VAR) Table-7. Dependent variable: EMR Null hypothesis Chi-sq Prob. FDI 0.435492 0.5093 IMP 2.956924 0.0855 EXP01 6.101184 0.0135 EX_RATE 9.698164 0.0018 INF_RATE 0.039108 0.8432 5. Concluding Remarks The paper empirically examines the cointegration and causal relationship between FDI employment rates in Afghanistan using annually data for the period 2003 – 2017. The estimated result indicates that long run cointegrating relationship holds between FDI and employment. Granger causality results indicate that there is bidirectional short run and long run causality between FDI and employment rate. However, no short run causal relationship is found between employment rates, import, export and exchange rate. Long run cointegration is also found between variables and statistically this cointegration is more significant during the period. These results also upheld by variance decomposition and impulse response analysis. Our OLS results show FDI net inflows don't have a significant effect on employment rate in Afghanistan, the error arising from traditional OLS model and the negligent of the FDI-growth lag dependent. Instead of using a single model to investigate the data, the present work employs 3 different regression models in a bid to arrive at a true conclusion. A comparison of the two results do not only show some bewildering difference but it will also vindicate the claim that detailed analyses are required to predict the true part of FDI in the economy of Afghanistan. Export and inflation rate has negative effect on employment rate, which indicates government in Afghanistan should take measure to cope with inflation rate and illegal flow of money; more steps need to be taken especially to build small businesses and make employment opportunities. Further, government should remove the root causes of unemployment, poverty, illiteracy, income equality, etc. to attract beneficial foreign direct investment and allocate them in proper way government should plan properly and increase public investment. Further, diversification opportunities may be provided to foreign investors with less risky environment. 5.1. Stability Checking In order to check the stability of the long-run coefficients, the cumulative sum (CUSUM) and the cumulative sum of squares (CUSUMSQ) tests suggested by Brown et al. (1975) are used. If the plots of CUSUM and CUSUMSQ statistics stay within the critical bounds of 5% level of significance, the null hypothesis of all coefficients in the given regression are stable and cannot be rejected. As can be seen in Figs.1 and 2, the estimated CUSUM and CUSUMSQ stay within the critical bonds indicating that all coefficients in the OLS model are stable.
- 6. International Journal of Economics and Financial Research 359 -0.4 0.0 0.4 0.8 1.2 1.6 2009 2010 2011 2012 2013 2014 2015 2016 2017 CUSUM of Squares 5% Significance -10.0 -7.5 -5.0 -2.5 0.0 2.5 5.0 7.5 10.0 2009 2010 2011 2012 2013 2014 2015 2016 2017 CUSUM 5% Significance 5.2 .Impulse Response -200 -100 0 100 200 2 4 6 8 10 12 14 Response ofEMR to EMR -200 -100 0 100 200 2 4 6 8 10 12 14 Response ofEMR to FDI -200 -100 0 100 200 2 4 6 8 10 12 14 Response ofEMR to IMP -200 -100 0 100 200 2 4 6 8 10 12 14 Response of EMR to EXP01 -200 -100 0 100 200 2 4 6 8 10 12 14 Response of EMR to EX_RATE -200 -100 0 100 200 2 4 6 8 10 12 14 Response of EMR to INF_RATE -20,000 -10,000 0 10,000 20,000 2 4 6 8 10 12 14 Response ofFDIto EMR -20,000 -10,000 0 10,000 20,000 2 4 6 8 10 12 14 Response ofFDIto FDI -20,000 -10,000 0 10,000 20,000 2 4 6 8 10 12 14 Response ofFDIto IMP -20,000 -10,000 0 10,000 20,000 2 4 6 8 10 12 14 Response of FDI to EXP01 -20,000 -10,000 0 10,000 20,000 2 4 6 8 10 12 14 Response of FDI to EX_RATE -20,000 -10,000 0 10,000 20,000 2 4 6 8 10 12 14 Response of FDI to INF_RATE -8,000 -4,000 0 4,000 8,000 2 4 6 8 10 12 14 Response ofIMPto EMR -8,000 -4,000 0 4,000 8,000 2 4 6 8 10 12 14 Response ofIMPto FDI -8,000 -4,000 0 4,000 8,000 2 4 6 8 10 12 14 Response ofIMPto IMP -8,000 -4,000 0 4,000 8,000 2 4 6 8 10 12 14 Response of IMP to EXP01 -8,000 -4,000 0 4,000 8,000 2 4 6 8 10 12 14 Response of IMP to EX_RATE -8,000 -4,000 0 4,000 8,000 2 4 6 8 10 12 14 Response of IMP to INF_RATE -8,000 -4,000 0 4,000 8,000 2 4 6 8 10 12 14 Response of EXP01 to EMR -8,000 -4,000 0 4,000 8,000 2 4 6 8 10 12 14 Response of EXP01 to FDI -8,000 -4,000 0 4,000 8,000 2 4 6 8 10 12 14 Response of EXP01 to IMP -8,000 -4,000 0 4,000 8,000 2 4 6 8 10 12 14 Response of EXP01 to EXP01 -8,000 -4,000 0 4,000 8,000 2 4 6 8 10 12 14 Response of EXP01 to EX_RATE -8,000 -4,000 0 4,000 8,000 2 4 6 8 10 12 14 Response of EXP01 to INF_RATE -2,000 -1,000 0 1,000 2,000 2 4 6 8 10 12 14 Response of EX_RATE to EMR -2,000 -1,000 0 1,000 2,000 2 4 6 8 10 12 14 Response of EX_RATE to FDI -2,000 -1,000 0 1,000 2,000 2 4 6 8 10 12 14 Response of EX_RATE to IMP -2,000 -1,000 0 1,000 2,000 2 4 6 8 10 12 14 Response of EX_RATE to EXP01 -2,000 -1,000 0 1,000 2,000 2 4 6 8 10 12 14 Response of EX_RATE to EX_RATE -2,000 -1,000 0 1,000 2,000 2 4 6 8 10 12 14 Response of EX_RATE to INF_RATE -4,000 -2,000 0 2,000 4,000 2 4 6 8 10 12 14 Response of INF_RATE to EMR -4,000 -2,000 0 2,000 4,000 2 4 6 8 10 12 14 Response of INF_RATE to FDI -4,000 -2,000 0 2,000 4,000 2 4 6 8 10 12 14 Response of INF_RATE to IMP -4,000 -2,000 0 2,000 4,000 2 4 6 8 10 12 14 Response of INF_RATE to EXP01 -4,000 -2,000 0 2,000 4,000 2 4 6 8 10 12 14 Response of INF_RATE to EX_RATE -4,000 -2,000 0 2,000 4,000 2 4 6 8 10 12 14 Response of INF_RATE to INF_RATE Response to CholeskyOne S.D. Innovations ± 2 S.E.
- 7. International Journal of Economics and Financial Research 360 5.3. Variance Decomposition 0 20 40 60 80 100 1 2 3 4 5 6 7 8 9 10 EMR EX_RATE EXP01 FDI IMP INF_RATE Variance Decomposition of EMR 0 10 20 30 40 50 60 70 1 2 3 4 5 6 7 8 9 10 EMR EX_RATE EXP01 FDI IMP INF_RATE Variance Decomposition of EX_RATE 0 20 40 60 80 1 2 3 4 5 6 7 8 9 10 EMR EX_RATE EXP01 FDI IMP INF_RATE Variance Decomposition of EXP01 0 20 40 60 80 100 1 2 3 4 5 6 7 8 9 10 EMR EX_RATE EXP01 FDI IMP INF_RATE Variance Decomposition of FDI 0 20 40 60 80 1 2 3 4 5 6 7 8 9 10 EMR EX_RATE EXP01 FDI IMP INF_RATE Variance Decomposition of IMP 0 10 20 30 40 50 60 70 1 2 3 4 5 6 7 8 9 10 EMR EX_RATE EXP01 FDI IMP INF_RATE Variance Decomposition of INF_RATE References Abdoulaye, O. B. and XieKefan, O.-O. (2015). Strategies and determinants of foreign direct investment (FDI) attraction. International Journal of Management Science and Business Administration, 1(5): 81-89. Borensztein, E., De, G. J. and Lee, J. W. (1998). How does foreign direct investment affect economic growth? Journal of International Economics, 45: 115-35. Brown, R. L., Durbin, J. and Evans, J. M. (1975). Techniques for testing the constancy of regression relationships over time (with discussion). Journal of the Royal Statistical Society, 37(2): 149–63. Buckley, P. J. and Mark, C. C. (1998). Analyzing foreign market entry strategies Extending the in ternalization approach. Journal of International Business Studies, 29(3): 539-62.
- 8. International Journal of Economics and Financial Research 361 Carkovic, M. and Levine, R. (2002). Does Foreign Direct Investment Accelerate Economic Growth? . Institute of International Economics Press: Washington DC. Coe, D. T., Helpman, E. and Hoffmaister, A. W. (1997). North-South R&D spillovers. Economic Journal, 107: 134- 49. Engle and Granger, C. (1987). Cointegration and error correction, representation. Estimation and Testing. Econometrica, 55(2): 251–76. Estrin, S. and Klaus, E. M. (2004). Investment strategies in emerging markets. Elgar: Cheltenham. Feenestra, R. and Markusen, I. (1994). Accounting for Growth with New Inputs. International Economic Review, 33: 429-47. Gujarati (2004). Basic Econometrics. 4th ednThe McGraw−Hill Companies. Johansen and Juselius (1990). Maximum likelihood estimation and inference on cointegration with applications the demand for money. Oxford Bulletin of Economics and Statistics, 52(2): 169–210. Johansen, S. (1988). Statistical analysis of cointegrating vectors. Journal of Economics Dynamics and Control, 12(2): 231–54. Kim, H. M. and Han, S. S. (2014). Inward foreign direct investment in Korea, location patterns and local impacts. Habitat International, 44: 146-57. Available: https://www.sciencedirect.com/science/article/pii/S0197397514000757 Lunn, J. (1980). Determinats of U.S. Direct investment in the E.E.C.: Furher evidence. European Economic Review, 13(1): 93-101. Obadan, M. I. and Odusola, A. F. (2001). Productivity and unemployment in Nigeria. National Centre for Economic Management and Administration: Ibadan. Phillips, C. B. and Hansen, B. E. (1990). Statistical inference in in strumental variables regression with i(1) processes. Review of Economic Studies, 57(1): 99–125. Resmini, L. (2000). The determinants of foreign direct investment in the ceecs, new evidence from sectorial patterns. Economics of Transition, 8(3): 665-89. Available: https://onlinelibrary.wiley.com/doi/abs/10.1111/1468- 0351.00060 Rizvi, S. Z. A. and and Nishat, M. (2009). The impact of foreign direct investment on employment opportunities: Panel Data Analysis, Empirical Evidence from Pakistan, India and China. Unpublished manuscript, Institute of Business Management (IBM), Karachi. Salami, I. (2013). Nigeria Capital Market in West Africa,Opportunities and Challenges. Available: https://tradingeconomics.com/afghanistan/unemployment-rate Schneider, F. and Frey, B. (1985). Economic and Political Determinants of Foreign Direct Investment,. World Development, 13(2): 161-75. Tang, D. and Gyasi, K. B. (2012). China – Africa foreign trade policies,the impact of China’s foreign direct, Investment_FDI_Flow_on_Employment_of_Ghana. Wilhelms, S. K. S. W. and Itter, M. S. D. (1998). Foreign direct investment and its determinants in emerging economies. African economic policy paper 9 united states agency for international development Bureau for Africa, Office of sustainable development. Washington DC.