1. HP – MET - 01
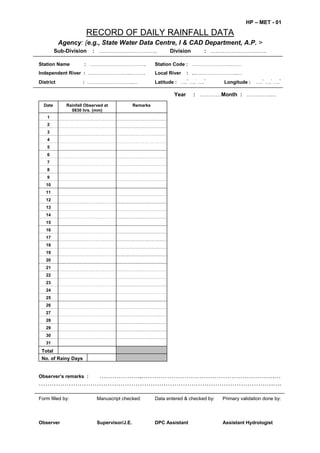
RECORD OF DAILY RAINFALL DATA
Agency: {e.g., State Water Data Centre, I & CAD Department, A.P. >
Sub-Division : ….……………………….. Division : ….…………………..…..
Station Name : …………………………….. Station Code : …………………….……
Independent River : ……………………..………. Local River : ...……………………..…
District : ………………………..… Latitude : ….°
….′
….″
Longitude : ….°
….′
….″
Year : …………Month : …………..…
Date Rainfall Observed at
0830 hrs. (mm)
Remarks
1
2
3
4
5
6
7
8
9
10
11
12
13
14
15
16
17
18
19
20
21
22
23
24
25
26
27
28
29
30
31
Total
No. of Rainy Days
Observer’s remarks : ………………...…………………………………………………….…
……………………………………………………………………………………………….….
Form filled by: Manuscript checked: Data entered & checked by: Primary validation done by:
Observer Supervisor/J.E. DPC Assistant Assistant Hydrologist
2. HP – MET - 02
RECORD OF TWICE-DAILY RAINFALL DATA
Agency: {e.g., State Water Data Centre, I & CAD Department, A.P. >
Sub-Division : ….……………………….. Division : ….…………………..…..
Station Name : …………………………….. Station Code : …………………….……
Independent River : ……………………..………. Local River : ...……………………..…
District : ………………………..… Latitude : ….°
….′
….″
Longitude : ….°
….′
….″
Year : …………Month : …………..…
Rainfall (mm) Observed atDate
1730 hrs.
(Previous Day)
0830 hrs.
Daily Rainfall
(mm)
Remarks
1
2
3
4
5
6
7
8
9
10
11
12
13
14
15
16
17
18
19
20
21
22
23
24
25
26
27
28
29
30
31
Total
No. of Rainy Days
Observer’s remarks : ………………...…………………………………………………….…
……………………………………………………………………………………………….….
Form filled by: Manuscript checked: Data entered & checked by: Primary validation done by:
Observer Supervisor/J.E. DPC Assistant Assistant Hydrologist
3. HP – MET - 03RECORDOF HOURLYRAINFALL DATA
Agency: {e.g., State Water Data Centre, I &CADDepartment, A.P. >
Sub-Division : ….……………………….. Division : ….…………………..…..
Station Name : …………………………….. Station Code: …………………….…… Independent River : ……………………..………. Local River : ...……………………..… District : ………………………………
Latitude : ….
°
….
′
….
″
Longitude : ….
°
….′
….″
Year : …………… Month : ………………..…
Rainfall Amounts (mm) for Clock Hours (Indian StandardTime) EndingAtDate
0100 0200 0300 0400 0500 0600 0700 0800 0900 1000 1100 1200 1300 1400 1500 1600 1700 1800 1900 2000 2100 2200 2300 2400
Total
1
2
3
4
5
6
7
8
9
10
11
12
13
14
15
16
17
18
19
20
21
22
23
24
25
26
27
28
29
30
31
Total
Observer’s remarks : ………………...……………………………………………………………………………………………………………………………………………………………………………………….…
Formfilled by: Manuscript checked: Data entered &checked by: Primary validation done by:
Observer Supervisor/J.E. DPCAssistant Assistant Hydrologist
4. HP – MET -04
RECORD OF DAILY CLIMATIC DATA
<Agency: {e.g., State Water Data Centre, I & CAD Department, A.P. >
Sub-Division : ….……………………….. Division : ….…………………..…..
Station Name : …………………………….. Station Code : …………………….……
Independent River : ……………………..………. Local River : ...……………………..…
District : ………………………..… Latitude : ….°
….′
….″
Longitude : ….°
….′
….″
Year : …………… Month : ……………..…
(ALL OBSERVATIONS ARE AT 0830 HRS. IST)
Date Min.
Temp.
Max.
Temp.
Dry
Bulb
Temp.
Wet
Bulb
Temp.
Rel.
Humi.
Inst.
Wind
Speed
Av.
Wind
Speed
Wind
Directi
on
Pan
Water
Temp
Pan
Evapo
-ration
Rain-
fall
Remarks
( °
C ) ( °
C ) ( °
C ) ( °
C ) (%) (Km/h) (Km/h) (16pts.) ( °
C) (mm) (mm)
1
2
3
4
5
6
7
8
9
10
11
12
13
14
15
16
17
18
19
20
21
22
23
24
25
26
27
28
29
30
31
Total
Av.
Observer’s remarks : ………………...…………………………………………………….……….
……………………………………………………………………………………………….………..
Form filled by: Manuscript checked: Data entered & checked by: Primary validation done by:
Observer Supervisor/J.E. DPC Assistant Assistant Hydrologist
5. HP – MET - 05RECORDOF TWICE-DAILYCLIMATICDATA
Agency: {e.g., State Water Data Centre, I &CADDepartment, A.P. >
Sub-Division : ….……………………….. Division : ….…………………..…..
StationName : …………………………….. StationCode : …………………….…… Independent River : ……………………..………. Local River : ...……………………..… District : ………………………………
Latitude : ….
°
….
′
….
″
Longitude : ….
°
….′
….″
Year : …………… Month : ………………..…
(OBSERVATIONSAREAT 0830 &1730 HRS. IST)
Pan Evapo. (mm) Rainfall (mm)Min. Temp.
(
°
C)
Max. Temp.
(
°
C)
Dry Bulb Temp.
(
°
C)
Wet BulbTemp.
(
°
C)
Rel. Humidity
(%)
Inst. Wind Speed
(Km/h)
Av. Wind Speed
(Km/h)
WindDirect.
(16pts.)
Pan WaterTemp.
(
°
C)
Date
0830 1730 0830 1730 0830 1730 0830 1730 0830 1730 0830 1730 0830 1730 0830 1730 0830 1730 0830
1730
(Prev. Day) 0830
1730
(Prev. Day)
Remarks
1
2
3
4
5
6
7
8
9
10
11
12
13
14
15
16
17
18
19
20
21
22
23
24
25
26
27
28
29
30
31
Total
Av.
Observer’s remarks : ………………...……………………………………………………………………………………………………………………………………………………………………………………….…
Formfilled by: Manuscript checked: Data entered &checked by: Primary validation done by:
Observer Supervisor/J.E. DPCAssistant Assistant Hydrologist
6. HP – MET - 06
RECORD OF HOURLY SUNSHINE DURATION DATA
<Agency: {e.g., State Water Data Centre, I & CAD Department, A.P. >
Sub-Division : ….……………………….. Division : ….…………………..…..
Station Name : …………………………….. Station Code : …………………….……
Independent River : ……………………..………. Local River : ...……………………..…
District : ………………………..… Latitude : ….°
….′
….″
Longitude : ….°
….′
….″
Year : …………… Month : ……………..…
Bright Sunshine Duration (in hrs.) Tabulated for Clock Hrs. (IST) Ending AtDate
0600 0700 0800 0900 1000 1100 1200 1300 1400 1500 1600 1700 1800 1900
Daily
Total
Remarks
1
2
3
4
5
6
7
8
9
10
11
12
13
14
15
16
17
18
19
20
21
22
23
24
25
26
27
28
29
30
31
Total
Observer’s remarks : ………………...…………………………………………………….……….
……………………………………………………………………………………………….………..
Form filled by: Manuscript checked: Data entered & checked by: Primary validation done by:
Observer Supervisor/J.E. DPC Assistant Assistant Hydrologist
7. HP – MET - 07RECORDOFHOURLYTEMPERATUREDATA
Agency: {e.g., State Water Data Centre, I &CADDepartment, A.P. >
Sub-Division : ….……………………….. Division : ….…………………..…..
Station Name : …………………………….. Station Code: …………………….…… Independent River : ……………………..………. Local River : ...……………………..… District : ………………………………
Latitude : ….
°
….
′
….
″
Longitude : ….
°
….′
….″
Year : …………… Month : ………………..…
Temperature (
°
C) at Clock Hours (Indian StandardTime)Date
0100 0200 0300 0400 0500 0600 0700 0800 0900 1000 1100 1200 1300 1400 1500 1600 1700 1800 1900 2000 2100 2200 2300 2400
Average
1
2
3
4
5
6
7
8
9
10
11
12
13
14
15
16
17
18
19
20
21
22
23
24
25
26
27
28
29
30
31
Observer’s remarks : ………………...……………………………………………………………………………………………………………………………………………………………………………………….…
Formfilled by: Manuscript checked: Data entered &checked by: Primary validation done by:
Observer Supervisor/J.E. DPCAssistant Assistant Hydrologist
8. HP – MET - 08RECORDOFHOURLYRELATIVEHUMIDITYDATA
Agency: {e.g., State Water Data Centre, I &CADDepartment, A.P. >
Sub-Division : ….……………………….. Division : ….…………………..…..
Station Name : …………………………….. Station Code: …………………….…… Independent River : ……………………..………. Local River : ...……………………..… District : ………………………………
Latitude : ….
°
….
′
….
″
Longitude : ….
°
….′
….″
Year : …………… Month : ………………..…
Relative Humidity (%) at Clock Hours (IndianStandard Time)Date
0100 0200 0300 0400 0500 0600 0700 0800 0900 1000 1100 1200 1300 1400 1500 1600 1700 1800 1900 2000 2100 2200 2300 2400
Average
1
2
3
4
5
6
7
8
9
10
11
12
13
14
15
16
17
18
19
20
21
22
23
24
25
26
27
28
29
30
31
Observer’s remarks : ………………...……………………………………………………………………………………………………………………………………………………………………………………….…
Formfilled by: Manuscript checked: Data entered &checked by: Primary validation doneby:
Observer Supervisor/J.E. DPCAssistant Assistant Hydrologist
9. HP – SW - 01
RECORD OF MULTIPLE TIMES A DAY STAGE DATA
<Agency: {e.g., State Water Data Centre, I & CAD Department, A.P.} >
Sub-Division : ….……………………….. Division : ….…………………..…..
Station Name : …………………………….. Station Code : …………………….……
Independent River : ……………………..………. Local River : ...……………………..…
District : ………………………..… Latitude : ….°
….′
….″
Longitude : ….°
….′
….″
R.L. of Gauge Zero : …………… (m+m.s.l) Year : …………Month : …………..…
Stage (m) Observed atDate
<0800 hrs.> <1300 hrs.> <1800 hrs.>
Remarks
1
2
3
4
5
6
7
8
9
10
11
12
13
14
15
16
17
18
19
20
21
22
23
24
25
26
27
28
29
30
31
Total
Av.
Observer’s remarks : ………………...…………………………………………………….…
……………………………………………………………………………………………….….
Form filled by: Manuscript checked: Data entered & checked by: Primary validation done by:
Observer Supervisor/J.E. DPC Assistant Assistant Hydrologist
10. HP – SW - 02
RECORD OF STAGE AND TEMPERATURE DATA
<Agency: {e.g., State Water Data Centre, I & CAD Department, A.P. >
Sub-Division : ….……………………….. Division : ….…………………..…..
Station Name : …………………………….. Station Code : …………………….……
Independent River : ……………………..………. Local River : ...……………………..…
District : ………………………..… Latitude : ….°
….′
….″
Longitude : ….°
….′
….″
R.L. of Gauge Zero : …………… (m+m.s.l.) Year : …………Month : …………..…
Stage (m) Observed at Temperatures ( °
C )
River Water Min. Atm. Max. Atm.
Date
<0800 hrs.> <1300 hrs.> <1800 hrs.> <0800 hrs.> 0830 hrs. 0830 hrs.
Remarks
1
2
3
4
5
6
7
8
9
10
11
12
13
14
15
16
17
18
19
20
21
22
23
24
25
26
27
28
29
30
31
Total
Av.
Observer’s remarks : ………………...…………………………………………………….…
……………………………………………………………………………………………….….
Form filled by: Manuscript checked: Data entered & checked by: Primary validation done by:
Observer Supervisor/J.E. DPC Assistant Assistant Hydrologist
11. HP – SW - 03
RECORDOFHOURLYSTAGEDATA
<Agency: {e.g., State Water Data Centre, I &CADDepartment, A.P. >
Sub-Division : ….……………………….. Division : ….…………………..…..
Station Name : …………………………….. Station Code : …………………….…… Independent River : ……………………..………. Local River : ...……………………..… District : ………………………………
Latitude : ….
°
….
′
….
″
Longitude : ….
°
….′
….″
R.L. of Gauge Zero: ……………(m+m.s.l.) Year : …………… Month : ………………..…
Stage (m) at Clock Hours (Indian Standard Time)Date
0100 0200 0300 0400 0500 0600 0700 0800 0900 1000 1100 1200 1300 1400 1500 1600 1700 1800 1900 2000 2100 2200 2300 2400
Average
1
2
3
4
5
6
7
8
9
10
11
12
13
14
15
16
17
18
19
20
21
22
23
24
25
26
27
28
29
30
31
Observer’s remarks : ………………...……………………………………………………………………………………………………………………………………………………………………………………….…
Formfilled by: Manuscript checked: Data entered &checked by: Primary validation doneby:
Observer Supervisor/J.E. DPCAssistant Assistant Hydrologist
12. HP – SW - 04
RECORD OF VELOCITY MEASUREMENTS FOR STAGE-DISCHARGE OBSERVATION
<Agency: {e.g., State Water Data Centre, I & CAD Department, A.P. >
Sub-Division : ….… … … … … … …… ….. Division : ….… … … … … … … ..… ..
Station Name : .… … … …… … … … … …… … … Station Code : … … … … … …… … … … … District : … … … …… … … … … …… … … .
Independent River : … … .… … … …… … … … ..… … .. Local River : ...… … … … … …… … ..….. Latitude : … .
°
… .
′
… .
″
Longitude : … .
°
… .′
… .″
R.L. of Gauge Zero : … … … … .. (m+m.s.l.) Date of Observation : …… …… … Time at Start : … … …… … Tim e at End : …… … … …
General Information
Location of discharge site : Temporary ∋ Distance from permanent site : … …… … … (m) U/S ∋
Permanent ∋ D/S ∋
Mode of crossing : … …… … … … … … … Method of vel. Obser. : … …… … … … … Sounding taken with : … …… … … … … … …
Sounding weight used : … …… … … .…Units: … …… ..
Condition of water : … …… … … … … … … Condition of weather : … …… … … … … … … River water temp. : … …… … At. temp. : … …… … … … …
Wind direction w.r.t current : … …… … … ( °
) Strength of wind : … …… … … .… … ….. Average wind speed : … …… … … ... (km/h)
Gauge Information Current Meter Information
Mean Gauge Reading (m)
Permanent Site Temporary Site
At Start
At End
Mean
Mean Water Level (m+m.s.l): … … … …… … …
Current meter used : … …… … … ..… … Rating Eq. of C.M. : … …… … … ..… …
Date of last rating : … …… … … ..…… Since when in use : … …… … … ..……
Rated spin : … …… … .. (sec.) Spin before measure.: … …… ….. (sec.)
Spin after measure.: … …… … … (sec.) No. of days in use : .… … …
.
Gauging Information
Method of suspending meter : … … …… …… … … … Weight used with meter: … … ….. Units: … … ….. No. of compartments : …… … …
Compartment
No.
No.ofSections
SectionNo.
ObservedDepth
(m)
VerticalAngle
(Deg.)
Airline
Correction(m)
Wetline
Correction(m)
CorrectedWater
Depth(m)
Contri.for
WettedPeri.(m)
SegmentalArea
(m
2
)
No.ofVelocity
Observations
DepthofObse-
rvationPoint
No.of
Revolutions
TimeTaken
(sec.)
PointVelocity
(m/sec.)
MeanVelocity
(m/sec.)
Angleof
Oblique.(Deg.)
VelocityCorr.fo
Oblique.(m/sec.
DriftDistance
(m)
TimeforDrift
(sec.)
DriftCorrection
(m/sec.)
FinalMean
Velocity(m/sec.
Segmental
Disch.(cumec.)
Remarks
Top Width (T) : … … … … (m) Wetted Peri. (P) : … … …. (m) Total Area (A) : …...… … … (m
2
) Total Discharge (Q): …… … … … (cumecs)
Max. Point Velocity : … … … … (m/sec.) Hyd. Radius (R=A/P) : … … ..… (m) Hyd. Depth (A/T) : ….… … … .. (m) Mean Velocity (V) : … … ….… … (m/sec.)
Surface Slope Observation
Surface Slope Observation by Leveling Surface Slope Observation by Staff GaugeDistance
from CGL
Difference in
Distances (m) Level
Reading (m)
Difference in
Level Reading (m)
Slope Mean
Slope
Gauge
Reading (m)
Difference in
Gauge Reading (m)
Slope Mean
Slope
… … .. m U/S
0 m
… … .. m D/S
Chezy’s Value (C = V/(RS)
0.5
: … … … … … … … … … Manning’s Value (N = R
1/6
/C): … … … … … … … …… …… … ..
Characteristics of river bed : … … … … … … … … … … … …… …… … … … … … Class of roughness under which it falls: …… …… … … … … … … … … … … … … … ..…
Observer’s remarks : … … …… ...…… … … … … … … … … … … … … … … …… …… … … … … … … … … … … … … … … …… …… … … … … … … … …… … … … … … … … … … .… .
Form filled by: Manuscript checked: Data entered & checked by: Primary validation done by:
Observer Supervisor/J.E. DPC Assistant Assistant Hydrologist
13. HP – SW - 05
RECORDOFSUMMARYOFSTAGE-DISCHARGEOBSERVATIONS
<Agency: {e.g., State Water Data Centre, I &CADDepartment, A.P. >
Sub-Division : ….……………………….. Division : ….…………………..…..
StationName : .………………………………… StationCode: …………………………… District : ………………………………….
Independent River : …….……………………..…….. Local River : ...……………………..….. Latitude: ….
°
….
′
….
″
Longitude : ….
°
….′
….″
R.L. of GaugeZero: ………….. (m+m.s.l.) Year: …………… Month(s): ……………
Date
Av.Timeof
Observation
ObservationNo.
MeanGauge
Reading(m)
MeanWater
Level(m+msl)
Discharge
(cumec.)
Observed/
Computed
Area
(m
2
)
SurfaceSlope
TopWidth
(m)
WettedPerimeter
(m)
HydraulicRadius
(m)
MeanVelocity
(m/sec.)
Manning’sN
Gradient
(m/day)
Fall
(m)
Modeof
Crossing
MethodofVelo-
cityObservation
No.ofVerticals/
FloatCompt.
Max.Velocity
(m/sec.)
Weather
Condition
WindVelocity
(km/h)
WindDirection
(16pts.)
Remarks
Observer’s remarks : …………...…………………………………………………………………………………………………………………………………………………….….
Formfilled by: Manuscript checked: Data entered &checkedby: Primary validation doneby:
Observer Supervisor/J.E. DPCAssistant Assistant Hydrologist
14. HP – SW - 07
RECORD OF SUSPENDED SEDIMENT SUMMARY DATA
Agency: Central Water Commission, C&SR, Coimbatore
Sub-Division: ……………………… Division: ………………………
Name : …………………………….. Station Code : …………………….……
Independent River : ……………………..………. Local River : ...……………………..…
District : ………………………..… Latitude : ….°
….′
….″
Longitude : ….°
….′
….″
R.L. of Gauge Zero : …………… (m+m.s.l.) Year : …………Month : …………..…
Suspended sediment concentration (g/l)Date Time of
observation
Gauge
Reading
(m)
Water
Level (m)
Total
Discharge
(cusec)
Coarse
Fraction
Medium
Fraction
Fine
Fraction
Total
Remarks
1
2
3
4
5
6
7
8
9
10
11
12
13
14
15
16
17
18
19
20
21
22
23
24
25
26
27
28
29
30
31
Observer’s remarks: ………………………………………………………………………………………………………………………….
……………………………………………………………………………………………………………………………………………………
Form filled by: Manuscript checked: Data entered & checked by: Primary validation done by:
Observer Supervisor/J.E. DPC Assistant Assistant Hydrologist
15. HP – WQ - 01
RECORD OF SAMPLE IDENTIFICATION
<Agency: {e.g., State Water Data Centre, I & CAD Department, A.P.} >
Sub-Division:……….……………………….. Division:…………….….…………………..…..
Sample code
Observer Agency Project
Date Time Station code
Container Preservation Treatment
Parameter
code
Glass PVC PE Teflon None Cool Acid Other None Decant Filter
(1) Gen
(2) Bact
(3) BOD
(4) COD, NH3,NO3
-
(5) H. Metals
(6)Tr. Organics
Source of sample
Waterbody Point Approach Medium Matrix
o River
o Drain
o Canal
o Reservoir
o Main current
o Right bank
o Left bank
o Bridge
o Boat
o Wading
o Water
o Susp matter
o Biota
o Sediment
o Fresh
o Brackish
o Salt
o Effluent
Sample type o Grab o Time-comp o Flow-comp o Depth-integ o Width-integ
Sample device o Weighted bottle o Pump o Depth sampler
Field determinations
Temp o
C pH EC µmho/cm DO mg/L
Odour
code
(1) Odour free
(2) Rotten eggs
(3) Burnt sugar
(4) Soapy
(5) Fishy
(6) Septic
(7) Aromatic
(8) Chlorinous
(9) Alcoholic
(10) Unpleasant
Colour
code
(1) Light brown
(2) Brown
(3) Dark brown
(4) Light green
(5) Green
(6) Dark green
(7) Clear
(8) Other (specify)
Remarks
Weather o Sunny o Cloudy o Rainy o Windy
Water vel. m/s o High (> 0.5) o Medium (0.1-0.5) o Low (< 0.1) o Standing
Water use o None o Cultivation o Bathing & washing o Cattle washing
o Melon/vegetable farming in river bed
17. HP – WQ - 02
RECORD OF WQ SAMPLE IDENTIFICATION
<Agency: {e.g., State Water Data Centre, I & CAD Department, A.P.} >
Sub-Division:……….……………………….. Division:…………….….…………………..…..
Date/Time
receivedatlab.
Date/Time
collected
Stationcode
Project
Collecting
agency/collector
Preservation
Parametercode
Lab.SampleNo.
(1) (2) (3) (4) (5) (6) (7) (8)
Note:
- Column (3) gives the station code conventionally followed by the monitoring agency.
- Column (4) gives the project under which the sample is collected.
- Column (7) corresponds to the parameter(s) code given in the sample identification form.
- Column (8) gives the laboratory sample number assigned to the sample as it is received in the
laboratory. Note that the numbering has two parts separated by a hyphen. The first part is
assigned in a sequential manner as samples are received from various stations. If two samples
are collected at the same time from a station for different sets of analysis, the first part of the
number is the same. The second part corresponds to the parameter code.
- The results of the analyses of all the samples having the same first part of the code would be
entered in the data entry system as one sample having the same station code and time of sample
collection.
18. HP – WQ – 03
RECORD OF WQ DATA AND VALIDATION
Name of Laboratory: Laboratory code:
Data record
Field determinations General Nutrients Org matter Alkalinity Hardness Major ions Other inorganics Coliforms Biol
LabsampleNo
Stationcode
Dateofcollection
pH
EC,µmho/cm
DO,mg/L
Temp,
o
C
Colour,code
Odour,code
pH
EC,µmho/cm
TDS,mg/L
TSS,mg/L
NH3,mgN/L
NO2
-
+NO3
-
,
mgN/L
TotalP,mg/L
BOD,mg/L
COD,mg/L
Phen,
mgCaCO3/L
Total,
mgCaCO3/L
Total,
mgCaCO3/L
Ca
++
,
mgCaCO3/L
Ca
++
,mg/L
Mg
++
,mg/L
Na
+
,mg/L
K
+
,mg/L
Cl
-
,mg/L
SO4
--
,mg/L
CO3
--
,mg/L
HCO3
-
,mg/L
Si,mg/L
F
-
,mg/L
B,mg/L
Total,
MPN/100mL
Faecal,
MPN/100mL
Chlorophyll-A,
µg/L
(1) (2) (3) (4) (5) (6) (7) (8) (9) (10) (11) (12) (13) (14) (15) (16) (17) (18) (19) (20) (21) (22) (23) (24) (25) (26) (27) (28) (29) (30) (31) (32) (33) (34) (35) (36)
Data validation
Cations Anions Ion balance EC bal
Carbon
bal
CO3
--
bal Verification criteria Checked by Remarks
Labsample
No
Stationcode
Ca
++
,meq/L
Mg
++
,meq/L
Na
+
,meq/L
K
+
,meq/L
Totalcations
Cl
-
,meq/L
SO4
--
,meq/L
CO3
--
,meq/L,
HCO3
-
,meq/L
NO2
-
+NO3
-
,
meq/L
Totalanions
{(41)-(47)} / {(41)+(47)} (39) / (42) (12) / (11) (18) / (17)
If (10) < 8.3,
is (19)=0 ?
(1) (2) (37) (38) (39) (40) (41) (42) (43) (44) (45) (46) (47) (48) (49) (50) (51) (52) (53) (54) (55)
(48) < 0.1
(49) = 0.8-1.2
(50 ) = 0.55-0.9
(51) > 1
(52) = yes