SlideShare a Scribd company logo
1 of 4
Looking back the recent past, the here and now
                                    Membership: Last 5 Years Trend
                                     Based on Memberships not Headcount


                   4.00


                   3.50


                   3.00
Memebers in 000s


                   2.50


                   2.00                                                                                   Membership


                   1.50


                   1.00                                                                         Doing Nothing
                                                                                                Is Not an Option
                   0.50


                   0.00
                          Yr 2006   Yr 2007   Yr 2008   Yr 2009   Yr 2010   Yr 2011   Yr 2012
                                                        Years
Financial Trends: Last 5 Years
                                      Cause and Effect
  120.00


  100.00                                                                   * Only 1 Core Cost
                                                                           Capable of Substantial
                                                                           reduction -The Journal
   80.00


   60.00

                                                                                            Total Income
   40.00                                                                                    Total Costs
                                                                                            Net Surplus
                                                                                            Total Net Reserves
   20.00


    0.00
                                                                               Doing Nothing
            Yr 2006   Yr 2007    Yr 2008   Yr 2009     Yr 2010   Yr 2011    Yr 2012
                                                                               Is Not an Option
            Year -6   Year -5    Year -4   Year -3     Year -2   Year -1    Year 0
   -20.00

                                                     • Reduced Revenue -reflects reduced Membership
   -40.00                                            •Costs increasing in excess of Revenue
                                                     •Eating into reserves since 2008
                                                     •Year on Year we are making a Loss
Ann-Marie Shearer Treasurer 3 of 6
The Good News - The Way Forward
                                 Membership: Steady Improvement
                                        Reverse the Curve
Members


            4.00
            3.50
             3.00
             2.50
             2.00
             1.50
             1.00
             0.50
              0.00
                     Yr 2006    Yr Yr 2008
                               2007        Yr 2009 Yr 2010
                                                             Yr 2011 Yr 2012
                                                                             Yr 2013 Yr 2014
                                                                                               Yr 2015
                                                                                                          Yr 2016
                                                                                                                      Yr 2017


                       Yr 2006 Yr 2007 Yr 2008 Yr 2009 Yr 2010 Yr 2011 Yr 2012 Yr 2013 Yr 2014 Yr 2015 Yr 2016 Yr 2017
          Membership    2.10      3.18    3.74    3.49       2.84   2.66     2.32    2.44      2.66      2.66       2.82    2.96
The Way Forward
 Reversing the Trend, Reducing Journal Costs over 3 Years
                 Increasing Membership
                   120.00


                   100.00


                    80.00                                   The Way Forward -Reversing The Curve
                    60.00
      Axis Title


                    40.00


                    20.00


                     0.00


                   -20.00


                   -40.00
                             Yr      Yr      Yr      Yr      Yr      Yr       Yr       Yr      Yr      Yr      Yr      Yr
                            2006    2007    2008    2009    2010    2011     2012     2013    2014    2015    2016    2017
Total Net Reserves          79.68   89.41   97.39   93.94   90.76   71.12    52.91    47.70   49.96   66.01   84.08   104.26
Total Income                38.64   59.38   70.78   59.03   53.99   53.84    46.79    57.83   61.49   61.49   63.50   65.61
Total Costs                 41.12   49.65   60.86   62.47   57.17   73.46     65      63.04   59.23   45.43   45.43   45.43
Net Surplus                 -2.48   9.73    9.92    -3.44   -3.18   -19.62   -18.21   -5.21   2.26    16.06   18.07   20.18

More Related Content

Viewers also liked

Uroki konstruktorskogo tvortchestwa1
Uroki konstruktorskogo tvortchestwa1Uroki konstruktorskogo tvortchestwa1
Uroki konstruktorskogo tvortchestwa1inflyceum130
 
Uroki konstruktorskogo tvortchestwa
Uroki konstruktorskogo tvortchestwaUroki konstruktorskogo tvortchestwa
Uroki konstruktorskogo tvortchestwainflyceum130
 
Uroki konstruktorskogo tvortchestwa
Uroki konstruktorskogo tvortchestwaUroki konstruktorskogo tvortchestwa
Uroki konstruktorskogo tvortchestwainflyceum130
 
Ifh hgs presentation v1.7 live
Ifh hgs presentation v1.7 liveIfh hgs presentation v1.7 live
Ifh hgs presentation v1.7 liveHGS Forward
 
Final presentation es1
Final presentation es1Final presentation es1
Final presentation es1Waed Shagareen
 
Abnormalities In Hatching Chicks
Abnormalities In Hatching ChicksAbnormalities In Hatching Chicks
Abnormalities In Hatching ChicksMujahid Hussain
 
Pipeline and data hazard
Pipeline and data hazardPipeline and data hazard
Pipeline and data hazardWaed Shagareen
 
Blood Clotting Mechanism
Blood Clotting MechanismBlood Clotting Mechanism
Blood Clotting MechanismMujahid Hussain
 
evaluaciones de matematicas 1º de primaria
evaluaciones de matematicas  1º de primaria evaluaciones de matematicas  1º de primaria
evaluaciones de matematicas 1º de primaria Carmen Maria Aragon
 

Viewers also liked (14)

Uroki konstruktorskogo tvortchestwa1
Uroki konstruktorskogo tvortchestwa1Uroki konstruktorskogo tvortchestwa1
Uroki konstruktorskogo tvortchestwa1
 
Uroki konstruktorskogo tvortchestwa
Uroki konstruktorskogo tvortchestwaUroki konstruktorskogo tvortchestwa
Uroki konstruktorskogo tvortchestwa
 
Uroki konstruktorskogo tvortchestwa
Uroki konstruktorskogo tvortchestwaUroki konstruktorskogo tvortchestwa
Uroki konstruktorskogo tvortchestwa
 
Ifh hgs presentation v1.7 live
Ifh hgs presentation v1.7 liveIfh hgs presentation v1.7 live
Ifh hgs presentation v1.7 live
 
Fat Role In Body Health
Fat Role In Body HealthFat Role In Body Health
Fat Role In Body Health
 
Final presentation es1
Final presentation es1Final presentation es1
Final presentation es1
 
Bovine ephemeral fever
Bovine ephemeral feverBovine ephemeral fever
Bovine ephemeral fever
 
Endocrinology
EndocrinologyEndocrinology
Endocrinology
 
Abnormalities In Hatching Chicks
Abnormalities In Hatching ChicksAbnormalities In Hatching Chicks
Abnormalities In Hatching Chicks
 
Pipeline and data hazard
Pipeline and data hazardPipeline and data hazard
Pipeline and data hazard
 
Incremental
IncrementalIncremental
Incremental
 
Urea Molasses Block
Urea Molasses BlockUrea Molasses Block
Urea Molasses Block
 
Blood Clotting Mechanism
Blood Clotting MechanismBlood Clotting Mechanism
Blood Clotting Mechanism
 
evaluaciones de matematicas 1º de primaria
evaluaciones de matematicas  1º de primaria evaluaciones de matematicas  1º de primaria
evaluaciones de matematicas 1º de primaria
 

Similar to HGS The Way Forward Reversing the Curve

USA bond Presentation (Mr. Rierson)
USA bond Presentation (Mr. Rierson)USA bond Presentation (Mr. Rierson)
USA bond Presentation (Mr. Rierson)Fred Sharpsteen
 
“SCORECARD” Incentive Remuneration System for Microfinance
“SCORECARD” Incentive Remuneration System for Microfinance“SCORECARD” Incentive Remuneration System for Microfinance
“SCORECARD” Incentive Remuneration System for MicrofinanceMABSIV
 
Bp oil spill impact on pinellas county
Bp oil spill impact on pinellas countyBp oil spill impact on pinellas county
Bp oil spill impact on pinellas countyHarry Haigley
 
Mortgage Delinquencies: I Quarter 2011
Mortgage Delinquencies: I Quarter 2011Mortgage Delinquencies: I Quarter 2011
Mortgage Delinquencies: I Quarter 2011REALTORS
 
Analysis of Revenue guidance - Infosys
Analysis of Revenue guidance - InfosysAnalysis of Revenue guidance - Infosys
Analysis of Revenue guidance - InfosysSarasvathi T.A
 
HealthCheck360 Wellness ROI Examples
HealthCheck360 Wellness ROI ExamplesHealthCheck360 Wellness ROI Examples
HealthCheck360 Wellness ROI Examplesjim_wachtel
 
Honeywell Gabelli & Company 12th Annual Aircraft Supplier Symposium Presentation
Honeywell Gabelli & Company 12th Annual Aircraft Supplier Symposium PresentationHoneywell Gabelli & Company 12th Annual Aircraft Supplier Symposium Presentation
Honeywell Gabelli & Company 12th Annual Aircraft Supplier Symposium Presentationfinance8
 
FY 2014 Fiscal Forecast School Operating Fund
FY 2014 Fiscal Forecast School Operating FundFY 2014 Fiscal Forecast School Operating Fund
FY 2014 Fiscal Forecast School Operating FundFairfax County
 
Commercial Real Estate and Economic Outlook
Commercial Real Estate and Economic OutlookCommercial Real Estate and Economic Outlook
Commercial Real Estate and Economic OutlookNar Res
 
Cavit Financial Model(1)
Cavit Financial Model(1)Cavit Financial Model(1)
Cavit Financial Model(1)guest4e1120
 
atmos enerrgy aga2008
atmos enerrgy aga2008atmos enerrgy aga2008
atmos enerrgy aga2008finance35
 

Similar to HGS The Way Forward Reversing the Curve (20)

USA bond Presentation (Mr. Rierson)
USA bond Presentation (Mr. Rierson)USA bond Presentation (Mr. Rierson)
USA bond Presentation (Mr. Rierson)
 
MEGA brands
MEGA brandsMEGA brands
MEGA brands
 
Ramirent Q4 2011
Ramirent Q4 2011Ramirent Q4 2011
Ramirent Q4 2011
 
Present and Future of Company
Present and Future of CompanyPresent and Future of Company
Present and Future of Company
 
EXOTIC CARS ASSOCIATION
EXOTIC CARS ASSOCIATIONEXOTIC CARS ASSOCIATION
EXOTIC CARS ASSOCIATION
 
“SCORECARD” Incentive Remuneration System for Microfinance
“SCORECARD” Incentive Remuneration System for Microfinance“SCORECARD” Incentive Remuneration System for Microfinance
“SCORECARD” Incentive Remuneration System for Microfinance
 
Bp oil spill impact on pinellas county
Bp oil spill impact on pinellas countyBp oil spill impact on pinellas county
Bp oil spill impact on pinellas county
 
OGDCL Presentation
OGDCL PresentationOGDCL Presentation
OGDCL Presentation
 
B mart
B martB mart
B mart
 
Mortgage Delinquencies: I Quarter 2011
Mortgage Delinquencies: I Quarter 2011Mortgage Delinquencies: I Quarter 2011
Mortgage Delinquencies: I Quarter 2011
 
Analysis of Revenue guidance - Infosys
Analysis of Revenue guidance - InfosysAnalysis of Revenue guidance - Infosys
Analysis of Revenue guidance - Infosys
 
HealthCheck360 Wellness ROI Examples
HealthCheck360 Wellness ROI ExamplesHealthCheck360 Wellness ROI Examples
HealthCheck360 Wellness ROI Examples
 
Honeywell Gabelli & Company 12th Annual Aircraft Supplier Symposium Presentation
Honeywell Gabelli & Company 12th Annual Aircraft Supplier Symposium PresentationHoneywell Gabelli & Company 12th Annual Aircraft Supplier Symposium Presentation
Honeywell Gabelli & Company 12th Annual Aircraft Supplier Symposium Presentation
 
The Bahamas - Trade Profile UWI's Shridath Ramphal Centre
The Bahamas - Trade Profile UWI's Shridath Ramphal CentreThe Bahamas - Trade Profile UWI's Shridath Ramphal Centre
The Bahamas - Trade Profile UWI's Shridath Ramphal Centre
 
FY 2014 Fiscal Forecast School Operating Fund
FY 2014 Fiscal Forecast School Operating FundFY 2014 Fiscal Forecast School Operating Fund
FY 2014 Fiscal Forecast School Operating Fund
 
Commercial Real Estate and Economic Outlook
Commercial Real Estate and Economic OutlookCommercial Real Estate and Economic Outlook
Commercial Real Estate and Economic Outlook
 
The Data Game
The Data GameThe Data Game
The Data Game
 
St louis parcel negotiating 2012
St louis parcel negotiating 2012St louis parcel negotiating 2012
St louis parcel negotiating 2012
 
Cavit Financial Model(1)
Cavit Financial Model(1)Cavit Financial Model(1)
Cavit Financial Model(1)
 
atmos enerrgy aga2008
atmos enerrgy aga2008atmos enerrgy aga2008
atmos enerrgy aga2008
 

HGS The Way Forward Reversing the Curve

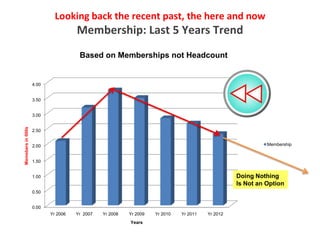
  • 1. Looking back the recent past, the here and now Membership: Last 5 Years Trend Based on Memberships not Headcount 4.00 3.50 3.00 Memebers in 000s 2.50 2.00 Membership 1.50 1.00 Doing Nothing Is Not an Option 0.50 0.00 Yr 2006 Yr 2007 Yr 2008 Yr 2009 Yr 2010 Yr 2011 Yr 2012 Years
  • 2. Financial Trends: Last 5 Years Cause and Effect 120.00 100.00 * Only 1 Core Cost Capable of Substantial reduction -The Journal 80.00 60.00 Total Income 40.00 Total Costs Net Surplus Total Net Reserves 20.00 0.00 Doing Nothing Yr 2006 Yr 2007 Yr 2008 Yr 2009 Yr 2010 Yr 2011 Yr 2012 Is Not an Option Year -6 Year -5 Year -4 Year -3 Year -2 Year -1 Year 0 -20.00 • Reduced Revenue -reflects reduced Membership -40.00 •Costs increasing in excess of Revenue •Eating into reserves since 2008 •Year on Year we are making a Loss Ann-Marie Shearer Treasurer 3 of 6
  • 3. The Good News - The Way Forward Membership: Steady Improvement Reverse the Curve Members 4.00 3.50 3.00 2.50 2.00 1.50 1.00 0.50 0.00 Yr 2006 Yr Yr 2008 2007 Yr 2009 Yr 2010 Yr 2011 Yr 2012 Yr 2013 Yr 2014 Yr 2015 Yr 2016 Yr 2017 Yr 2006 Yr 2007 Yr 2008 Yr 2009 Yr 2010 Yr 2011 Yr 2012 Yr 2013 Yr 2014 Yr 2015 Yr 2016 Yr 2017 Membership 2.10 3.18 3.74 3.49 2.84 2.66 2.32 2.44 2.66 2.66 2.82 2.96
  • 4. The Way Forward Reversing the Trend, Reducing Journal Costs over 3 Years Increasing Membership 120.00 100.00 80.00 The Way Forward -Reversing The Curve 60.00 Axis Title 40.00 20.00 0.00 -20.00 -40.00 Yr Yr Yr Yr Yr Yr Yr Yr Yr Yr Yr Yr 2006 2007 2008 2009 2010 2011 2012 2013 2014 2015 2016 2017 Total Net Reserves 79.68 89.41 97.39 93.94 90.76 71.12 52.91 47.70 49.96 66.01 84.08 104.26 Total Income 38.64 59.38 70.78 59.03 53.99 53.84 46.79 57.83 61.49 61.49 63.50 65.61 Total Costs 41.12 49.65 60.86 62.47 57.17 73.46 65 63.04 59.23 45.43 45.43 45.43 Net Surplus -2.48 9.73 9.92 -3.44 -3.18 -19.62 -18.21 -5.21 2.26 16.06 18.07 20.18