Market for butter
•Download as PPTX, PDF•
0 likes•480 views

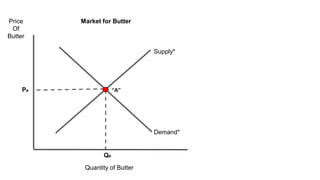
The document discusses how a shift in the supply curve of butter from Supply* to Supply1, representing an increase in the cost of a vital input. This causes the market for butter to move from an initial equilibrium at point A, with price Pe and quantity Qe, to a new equilibrium. With the higher costs, the supply curve shifts leftward to Supply1. The market attempts to price butter at the initial price P1, but this creates a surplus as the quantity supplied at B exceeds the quantity demanded at E. Economic theory suggests the price will decrease to clear the market, moving along the demand and supply curves until a new equilibrium is reached at point C, with a higher price P2 and quantity Q1.

Recommended
More Related Content
More from Gene Hayward
More from Gene Hayward (20)
Recently uploaded
Recently uploaded (20)
Market for butter
- 1. Price Of Butter Quantity of Butter Demand* Supply* Pe Qe Market for Butter “A”
- 2. Quantity of Butter Demand* Supply* Pe Qe Market for ButterPrice Of Butter P1 “B” To still produce Quantity “Qe” the ADDITIONAL cost is the difference between “Pe” and “P1”. This is represented by Point “B”. “A”
- 3. Quantity of Butter Demand* Supply* Pe Qe “A” Market for ButterPrice Of Butter P1 “B” Ceterus Paribus, what is true from Point “A” on the Supply Curve to Point “B” is also true at every other point along Supply* “C”
- 4. Quantity of Butter Demand* Supply* Pe Qe “A” Market for ButterPrice Of Butter P1 “B” Ceterus Paribus, what is true from Point “A” on the Supply Curve to Point “B” is also true at every other point along Supply* “D” “C”
- 5. Quantity of Butter Demand* Supply* Pe Qe “A” Market for ButterPrice Of Butter P1 “B” With the increase in the cost of a vital input we can see a new supply curve, SUPPLY 1 emerging representing a shift in Market Supply for Butter. “C” “D” Supply 1
- 6. Quantity of Butter Demand* Supply* Pe Qe “A” Market for ButterPrice Of Butter P1 “B” The new Market Supply Curve lies to the LEFT of the old one.“C” “D” Supply 1
- 7. Quantity of Butter Demand* Supply* Pe Qe “A” Market for ButterPrice Of Butter “B” If the Market attempted to price Butter at “P1” we can see from the respective Demand and (new) Supply Curves the Market is not in equilibrium. At “P1” the Quantity Demanded is Point “E” and the Quantity Supplied is at Point “B”... “C” P1 “E” Qd Supply 1
- 8. Quantity of Butter Demand* Supply* Pe Qs “A” Market for ButterPrice Of Butter “B” We have a SURPLUS equal to Qs minus Qd (Point “B” minus Point “E”). Economic theory suggests the Market Price will DECREASE in order to “Clear the Market”. With a Decrease in PRICE, the market will obey the Laws of Demand and Supply and move ALONG the respective Demand and Supply Curves until a new Equilibrium is established at... “C” P1 “E” Qd “SURPLUS” Supply 1
- 9. Quantity of Butter Demand* Supply* Pe Qe “A” Market for ButterPrice Of Butter P2 Point “C” where the new Market Price is “P2” and the Market Quantity (Qd=Qs) is “Q1”. NOTE that the New Market Price is in equilibrium at a HIGHER Price than when we started out at Point “A” and Market Quantity “Qe”. “C” Q1 Supply 1