1. June 22, 2009
Active Management and Stock Selection
George Should investors abandon their pursuit of alpha via look at historical results, however, suggests that
Loebrich active management and switch to index funds? I investors might have been better off sticking with
Portfolio answer a resounding no, and in this article present active management and hiring managers with strong
Specialist evidence to demonstrate that active stock selection stock selection capabilities.
continues to provide opportunities for capturing
unrecognized value. Potential of Active Management
During 2008, investors withdrew $238 billion from To illustrate the value of active management, Graph
domestic and international non-index mutual funds 1 shows that, each year over the past 10 years, the
and put $134 billion into index funds. This dramatic top-performing managers in the PSN Large Cap Core
shift suggests investors gave up on active universe have significantly outperformed the Russell
management and the pursuit of excess return on 1000 Index. The graph shows the results for those
capital, perhaps merely hoping for a return of managers in the PSN Large Cap Core universe
capital. Investors may have believed they were screened for three-year annualized tracking errors of
reducing risk by moving into passive strategies. A 2.5% or greater, in order to eliminate index and
enhanced index strategies.
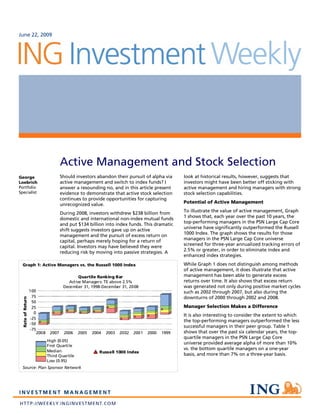
Graph 1: Active Managers vs. the Russell 1000 Index While Graph 1 does not distinguish among methods
of active management, it does illustrate that active
Quartile Ranking Bar management has been able to generate excess
Active Managers: TE above 2.5% returns over time. It also shows that excess return
December 31, 1998-December 31, 2008 was generated not only during positive market cycles
100 such as 2002 through 2007, but also during the
75 downturns of 2000 through 2002 and 2008.
Rate of Return
50
25 Manager Selection Makes a Difference
0
It is also interesting to consider the extent to which
-25
the top-performing managers outperformed the less
-50
successful managers in their peer group. Table 1
-75
2008 2007 2006 2005 2004 2003 2002 2001 2000 1999 shows that over the past six calendar years, the top-
quartile managers in the PSN Large Cap Core
High (0.05)
universe provided average alpha of more than 10%
First Quartile
Median
vs. the bottom quartile managers on a one-year
Russell 1000 Index
Third Quartile basis, and more than 7% on a three-year basis.
Low (0.95)
Source: Plan Sponsor Network
2. June 22, 2009
Table 1: Manager Selection Potential. Year-end alpha Graph 2: Stock Selection Potential: Difference between
differences between top- and bottom-quartile managers, top and bottom performing stocks, 1988-2008
PSN Large Core Universe
40%
1-Year 3-Year Russell 1000
30%
Difference (%) Difference (%)
20%
2003 12.1 8.94
10%
2004 8.41 7.03
0%
2005 10.13 7.76
2006 8.15 6.01 -10%
Top 25% vs. Bottom 25%
2007 11.63 5.9 -20%
2008 11.25 6.69 -30%
Average 10.28 7.06 -40%
1988 1991 1994 1997 2000 2003 2006
Sources: Plan Sponsor Network (data); ING Investment Source: PSN, ING IM
Management (analysis)
These results show that manager selection can be an
important factor in long-term results. While it is Graph 3 narrows the analysis to illustrate the
difficult to identify top-performing managers potential available in the financial, staples and
consistently, academic research over the past two health care sectors. We chose these sectors as
decades suggests that investors have a reasonable representative of the better historical opportunities
chance of finding them. There is evidence suggesting among the Russell 1000 stocks, where active selection
that past risk-adjusted performance is likely to persist could have added between 60% and 90% on
1
in the future. average. While not all sectors provided as much
Security Selection Makes a Difference Too opportunity for excess returns, it should be noted
that the technology sector’s top performers averaged
While the exhibits above illustrate the potential 112% over bottom performers during the period
value added by successful active management, it’s reflected.
also important to get below the surface and examine
Graph 3: Return Differentials Among Top and Bottom
the techniques used to achieve the results. We
Performing Stocks, 1998-2008
believe that stock selection is the key to success and
that the market has consistently provided both the 250% Financials
opportunity to and the reward for picking the right Staples
stocks regardless of overall market conditions. 200%
Health Care
Graph 2 illustrates the potential value added if one 150%
had selected the top 25% of outperforming stocks
versus the bottom 25% of underperforming stocks in 100%
each sector of the Russell 1000 Index over the past 20
50%
years, weighted as in the Index. During that time,
regardless of the performance of the market, the 0%
average dispersion of returns between the top and 1988 1991 1994 1997 2000 2003 2006
bottom performers was 7.5%, reaching as high as
15% in 1999. This dispersion — the blue line — Source: PSN, ING IM
represents the potential to outperform peers
through more effective stock selection.
Looking Ahead
The historical data point to the potential value of
stock selection. Looking forward, what can we say?
We believe that current market dynamics will provide
skilled stock pickers the opportunity to shine in
coming years. One of the most salient of these
dynamics is the reduction in research coverage
provided by prominent sell-side institutions, as they
2