The document describes trends in CD and total revenue from 1990 to 2008. CD sales followed a quadratic function, peaking at 5000 in 1999 and declining to 0 by 2005. Ticket sales followed a linear function, declining from 1.5 to 0 from 1999 to 2005. Total revenue was modeled as a composite function of CD and ticket sales multiplied by 1.04 to the power of t, representing a 4% annual increase. When graphed from 1990 to 2008, total revenue increased until peaking around $24,000 from 2000 to 2001 before declining.
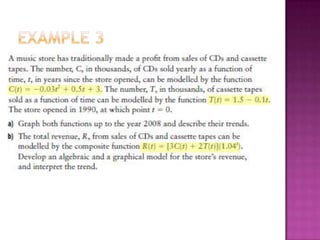
2. Graph both functions up to the year 2008 and describe their trends The total revenue can be modelled by the composite function R(t)=[3C(t)+2T(t)](1.04ⁿ). Find the revenue, create and graphical model and interpret the trend. The number on CD’s sold from 1990 to 1999 started at 3000 and ended at 5000. Once the sales hit 5083 (the maximum of the curve), in 1999 they started to decrease. a) y=-0.03t²+0.5t+3 They stopped selling completely in 2005, when the graph reaches 0. y=1.5-0.1t 1999
3. Graph both functions up to the year 2008 and describe their trends The total revenue can be modelled by the composite function R(t)=[3C(t)+2T(t)](1.04ⁿ). Find the revenue, create and graphical model and interpret the trend. C(t)=(-0.03t²+0.5t+3) T(t)=(1.5-0.1t) b) R(t) =[3C(t)+2T(t)](1.04ⁿ) =[3(-0.03t²+0.5t+3)+2(1.5-0.1t)](1.04t) =(-0.09t²+1.5t+9+3-0.2t)(1.04t) =(-0.09t²+1.3t+12)(1.04t) 24,000 The maximum revenue from 2000 to 2001 was about $24,000 y=(-0.09t²+1.3t+12)(1.04t)
. Find the revenue, create and graphical model and interpret the trend. The number on CD’s sold from 1990 to 1999 started at 3000 and ended at 5000. Once the sales hit 5083 (the maximum of the curve), in 1999 they started to decrease. a) y=-0.03t²+0.5t+3 They stopped selling completely in 2005, when the graph reaches 0. y=1.5-0.1t 1999](data:image/gif;base64,R0lGODlhAQABAIAAAAAAAP///yH5BAEAAAAALAAAAAABAAEAAAIBRAA7)