PBTK Workshop EPAA -Ispra (I)
•Download as PPT, PDF•
1 like•370 views

Presentation of PBTK Model IndusChemFate

Recommended
Recommended
More Related Content
What's hot
What's hot (20)
Viewers also liked
Viewers also liked (18)
Similar to PBTK Workshop EPAA -Ispra (I)
Similar to PBTK Workshop EPAA -Ispra (I) (20)
PBTK Workshop EPAA -Ispra (I)
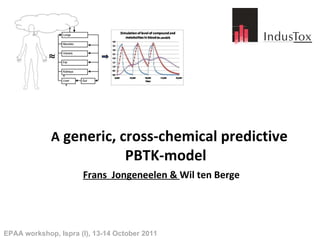
- 1. Frans Jongeneelen & Wil ten Berge EPAA workshop, Ispra (I), 13-14 October 2011 A generic, cross-chemical predictive PBTK-model
- 2. PBTK-model in exposure/dose assessment Schematic from: Georgopoulos
- 5. Scheme of the physiology of the PBTK-model
- 7. Dermal absorption module of the model = New model of AIHA-EASC named IH SKINPERM
- 13. Simulation example 1 Metabolism of pyrene Figure taken from: Luukkanen et al, 2001
- 14. Simulation example 1 Kinetics of in vitro metabolism of pyrene in human hepatic fractions Step Tissue Parameter and value ref Pyrene to 1-OH-pyrene Hepatic 9000*g fraction of 12 individuals V max = 180 µ mol/hr/kg tissue K M = 4.4 µ M Jongeneelen (1987) 1-OH-Pyrene to 1-OH-pyrene- glucuronide Hepatic microsomal fraction of 3 individuals V max = 6,900 µ mol/hr/kg tissue K M = 7.7 µ M Luukkanen et al (2001)
- 16. Simulation example 1 Entering properties & biochem data of pyrene and metabolites Pyrene 1-OH-Pyrene 1-OH-Pyrene-glucuronide
- 17. Simulation example 1 Entering exposure scenario of the coal liquefaction workers Airborne exposure scenario Dermal exposure scenario Oral intake scenario
- 18. Simulation example 1 Run program - Results as table with levels and amounts in fluids and tissues
- 19. Simulation example 1 Run program- Results as graphs Figure 3: Urine Figure 2: Blood Figure 1: Alveolair air
- 20. Simulation Example 1 Result: predicted concentration total 1-OHP in urine of the coal liquefaction workers (in umol/L)
- 22. Simulation Example 1 Result: Estimated fate of mass of pyrene + metabolites
- 24. Simulation example 2: dermal uptake after desinfection of hands with ethanol Nr. Compound Type of study Exposure route Exposure scenario Reference 1 Pyrene Observa-tional study of workers Inhalation + dermal 4*12 on work, 96 hr off work Quinlan, 1995 2 Ethanol Volunteer study Application on skin, dermal 10 times disinfection of hands and arms. Rubbing during 80 min. Kramer, 2007
- 25. Simulation example 2 Ethanol in blood after disinfecting of hands and arms (Kramer et al, 2007) Dermal + inhalation of evaporated ethanol! Solid line: dermal only exposure scenario