More Related Content
Similar to fr06_is-nongaap
Similar to fr06_is-nongaap (20)
fr06_is-nongaap
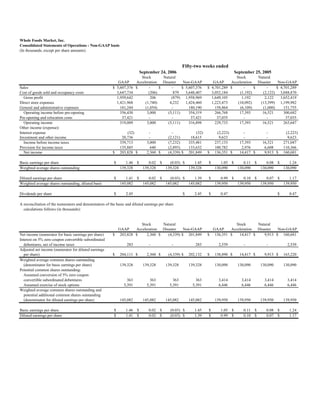
- 1. Whole Foods Market, Inc.
Consolidated Statements of Operations - Non-GAAP basis
(In thousands, except per share amounts)
Fifty-two weeks ended
September 24, 2006 September 25, 2005
Stock Natural Stock Natural
GAAP Acceleration Disaster Non-GAAP GAAP Acceleration Disaster Non-GAAP
Sales $ 5,607,376 $ - $ - $ 5,607,376 $ 4,701,289 $ - $ - $ 4,701,289
Cost of goods sold and occupancy costs 3,647,734 (206) 879 3,648,407 3,052,184 (1,192) (2,122) 3,048,870
Gross profit 1,959,642 206 (879) 1,958,969 1,649,105 1,192 2,122 1,652,419
Direct store expenses 1,421,968 (1,740) 4,232 1,424,460 1,223,473 (10,092) (13,399) 1,199,982
General and administrative expenses 181,244 (1,054) - 180,190 158,864 (6,109) (1,000) 151,755
Operating income before pre-opening 356,430 3,000 (5,111) 354,319 266,768 17,393 16,521 300,682
Pre-opening and relocation costs 37,421 - - 37,421 37,035 - - 37,035
Operating income 319,009 3,000 (5,111) 316,898 229,733 17,393 16,521 263,647
Other income (expense):
Interest expense (32) - - (32) (2,223) - - (2,223)
Investment and other income 20,736 - (2,121) 18,615 9,623 - - 9,623
Income before income taxes 339,713 3,000 (7,232) 335,481 237,133 17,393 16,521 271,047
Provision for income taxes 135,885 640 (2,893) 133,632 100,782 2,976 6,608 110,366
Net income $ 203,828 $ 2,360 $ (4,339) $ 201,849 $ 136,351 $ 14,417 $ 9,913 $ 160,681
Basic earnings per share $ 1.46 $ 0.02 $ (0.03) $ 1.45 $ 1.05 $ 0.11 $ 0.08 $ 1.24
Weighted average shares outstanding 139,328 139,328 139,328 139,328 130,090 130,090 130,090 130,090
Diluted earnings per share $ 1.41 $ 0.02 $ (0.03) $ 1.39 $ 0.99 $ 0.10 $ 0.07 $ 1.17
Weighted average shares outstanding, diluted basis 145,082 145,082 145,082 145,082 139,950 139,950 139,950 139,950
Dividends per share $ 2.45 $ 2.45 $ 0.47 $ 0.47
A reconciliation of the numerators and denominators of the basic and diluted earnings per share
calculations follows (in thousands):
Stock Natural Stock Natural
GAAP Acceleration Disaster Non-GAAP GAAP Acceleration Disaster Non-GAAP
Net income (numerator for basic earnings per share) $ 203,828 $ 2,360 $ (4,339) $ 201,849 $ 136,351 $ 14,417 $ 9,913 $ 160,681
Interest on 5% zero coupon convertible subordinated
debentures, net of income taxes 283 - - 283 2,539 - - 2,539
Adjusted net income (numerator for diluted earnings
per share) $ 204,111 $ 2,360 $ (4,339) $ 202,132 $ 138,890 $ 14,417 $ 9,913 $ 163,220
Weighted average common shares outstanding
(denominator for basic earnings per share) 139,328 139,328 139,328 139,328 130,090 130,090 130,090 130,090
Potential common shares outstanding:
Assumed conversion of 5% zero coupon
convertible subordinated debentures 363 363 363 363 3,414 3,414 3,414 3,414
Assumed exercise of stock options 5,391 5,391 5,391 5,391 6,446 6,446 6,446 6,446
Weighted average common shares outstanding and
potential additional common shares outstanding
(denominator for diluted earnings per share) 145,082 145,082 145,082 145,082 139,950 139,950 139,950 139,950
Basic earnings per share $ 1.46 $ 0.02 $ (0.03) $ 1.45 $ 1.05 $ 0.11 $ 0.08 $ 1.24
Diluted earnings per share $ 1.41 $ 0.02 $ (0.03) $ 1.39 $ 0.99 $ 0.10 $ 0.07 $ 1.17