More Related Content
Similar to cel_resegmentation_quarterly_summary
Similar to cel_resegmentation_quarterly_summary (20)
cel_resegmentation_quarterly_summary
- 1. Table 1
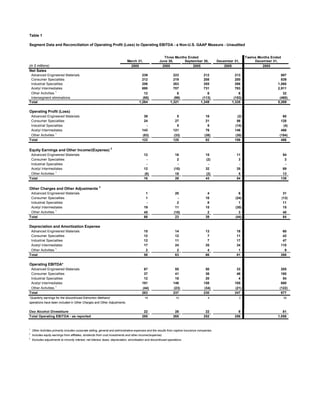
Segment Data and Reconciliation of Operating Profit (Loss) to Operating EBITDA - a Non-U.S. GAAP Measure - Unaudited
Three Months Ended Twelve Months Ended
March 31, June 30, September 30, December 31, December 31,
(in $ millions) 2005 2005 2005 2005 2005
Net Sales
Advanced Engineered Materials 239 223 212 213 887
Consumer Specialties 212 219 208 200 839
Industrial Specialties 206 263 305 286 1,060
Acetyl Intermediates 690 707 731 783 2,911
Other Activities 1 12 8 6 6 32
Intersegment eliminations (95) (99) (113) (153) (460)
Total 1,264 1,321 1,349 1,335 5,269
Operating Profit (Loss)
Advanced Engineered Materials 39 5 18 (2) 60
Consumer Specialties 24 27 21 56 128
Industrial Specialties - 5 5 (14) (4)
Acetyl Intermediates 143 121 76 146 486
Other Activities 1 (83) (33) (38) (30) (184)
Total 123 125 82 156 486
Equity Earnings and Other Income/(Expense) 2
Advanced Engineered Materials 12 16 15 11 54
Consumer Specialties - 2 (2) 3 3
Industrial Specialties - - - - -
Acetyl Intermediates 12 (10) 32 35 69
Other Activities 1 (8) 18 (2) 5 13
Total 16 26 43 54 139
Other Charges and Other Adjustments 3
Advanced Engineered Materials 1 20 4 6 31
Consumer Specialties 1 - 10 (24) (13)
Industrial Specialties - 2 8 1 11
Acetyl Intermediates 19 11 15 (30) 15
Other Activities 1 45 (10) 2 3 40
Total 66 23 39 (44) 84
Depreciation and Amortization Expense
Advanced Engineered Materials 15 14 13 18 60
Consumer Specialties 12 12 7 11 42
Industrial Specialties 12 11 7 17 47
Acetyl Intermediates 17 24 35 34 110
Other Activities 1 2 2 4 1 9
Total 58 63 66 81 268
Operating EBITDA*
Advanced Engineered Materials 67 55 50 33 205
Consumer Specialties 37 41 36 46 160
Industrial Specialties 12 18 20 4 54
Acetyl Intermediates 191 146 158 185 680
Other Activities 1 (44) (23) (34) (21) (122)
Total 263 237 230 247 977
*Quarterly earnings for the discontinued Edmonton Methanol 18 10 4 3 35
operations have been included in Other Charges and Other Adjustments.
Oxo Alcohol Divestiture 22 28 22 9 81
Total Operating EBITDA - as reported 285 265 252 256 1,058
1
Other Activities primarily includes corporate selling, general and administrative expenses and the results from captive insurance companies.
2
Includes equity earnings from affiliates, dividends from cost investments and other income/(expense).
3
Excludes adjustments to minority interest, net interest, taxes, depreciation, amortization and discontinued operations.
- 2. Table 1
Segment Data and Reconciliation of Operating Profit (Loss) to Operating EBITDA - a Non-U.S. GAAP Measure - Unaudited
Three Months Ended Twelve Months Ended
March 31, June 30, September 30, December 31, December 31,
(in $ millions) 2006 2006 2006 2006 2006
Net Sales
Advanced Engineered Materials 231 230 230 224 915
Consumer Specialties 216 223 213 224 876
Industrial Specialties 311 326 335 309 1,281
Acetyl Intermediates 809 839 872 831 3,351
Other Activities 1 5 6 5 6 22
Intersegment eliminations (152) (167) (184) (164) (667)
Total 1,420 1,457 1,471 1,430 5,778
Operating Profit (Loss)
Advanced Engineered Materials 41 38 37 29 145
Consumer Specialties 42 47 35 41 165
Industrial Specialties 15 3 17 9 44
Acetyl Intermediates 103 120 126 107 456
Other Activities 1 (45) (56) (43) (46) (190)
Total 156 152 172 140 620
Equity Earnings and Other Income/(Expense) 2
Advanced Engineered Materials 14 14 14 13 55
Consumer Specialties - 22 - 2 24
Industrial Specialties - (1) - - (1)
Acetyl Intermediates 7 15 18 23 63
Other Activities 1 3 (3) 10 12 22
Total 24 47 42 50 163
Other Charges and Other Adjustments 3
Advanced Engineered Materials (2) (2) - (1) (5)
Consumer Specialties - - - - -
Industrial Specialties 1 10 3 2 16
Acetyl Intermediates 12 14 10 16 52
Other Activities 1 13 15 3 (2) 29
Total 24 37 16 15 92
Depreciation and Amortization Expense
Advanced Engineered Materials 16 16 16 17 65
Consumer Specialties 11 9 9 10 39
Industrial Specialties 14 15 16 14 59
Acetyl Intermediates 23 32 23 23 101
Other Activities 1 1 2 2 - 5
Total 65 74 66 64 269
Operating EBITDA*
Advanced Engineered Materials 69 66 67 58 260
Consumer Specialties 53 78 44 53 228
Industrial Specialties 30 27 36 25 118
Acetyl Intermediates 145 181 177 169 672
Other Activities 1 (28) (42) (28) (36) (134)
Total 269 310 296 269 1,144
*Quarterly earnings for the discontinued Edmonton Methanol 14 12 10 16 52
operations have been included in Other Charges and Other Adjustments.
Oxo Alcohol Divestiture** - - 26 39 65
Total Operating EBITDA - as reported 269 310 322 308 1,209
**For comparative purposes. The Oxo Alcohol Divestiture was reflected as a discontinued operation for the three months ended March 31, 2006 and June 30, 2006
in conjunction with reporting the results for the first and second quarter of 2007.
1
Other Activities primarily includes corporate selling, general and administrative expenses and the results from captive insurance companies.
2
Includes equity earnings from affiliates, dividends from cost investments and other income/(expense).
3
Excludes adjustments to minority interest, net interest, taxes, depreciation, amortization and discontinued operations.
- 3. Table 1
Segment Data and Reconciliation of Operating Profit (Loss) to Operating EBITDA - a Non-U.S. GAAP Measure - Unaudited
Three Months Ended Six Months Ended
March 31, June 30, June 30,
(in $ millions) 2007 2007 2007
Net Sales
Advanced Engineered Materials 262 257 519
Consumer Specialties 269 281 550
Industrial Specialties 346 355 701
Acetyl Intermediates 839 834 1,673
Other Activities 1 1 (5) (4)
Intersegment eliminations (162) (166) (328)
Total 1,555 1,556 3,111
Operating Profit (Loss)
Advanced Engineered Materials 36 32 68
Consumer Specialties 48 48 96
Industrial Specialties 12 (1) 11
Acetyl Intermediates 132 91 223
Other Activities 1 (22) (99) (121)
Total 206 71 277
Equity Earnings and Other Income/(Expense) 2
Advanced Engineered Materials 14 16 30
Consumer Specialties - 35 35
Industrial Specialties - - -
Acetyl Intermediates 5 18 23
Other Activities 1 4 (2) 2
Total 23 67 90
Other Charges and Other Adjustments 3
Advanced Engineered Materials - 5 5
Consumer Specialties 1 8 9
Industrial Specialties - 19 19
Acetyl Intermediates 46 11 57
Other Activities 1 4 72 76
Total 51 115 166
Depreciation and Amortization Expense
Advanced Engineered Materials 17 17 34
Consumer Specialties 11 13 24
Industrial Specialties 14 16 30
Acetyl Intermediates 24 26 50
Other Activities 1 2 1 3
Total 68 73 141
Operating EBITDA*
Advanced Engineered Materials 67 70 137
Consumer Specialties 60 104 164
Industrial Specialties 26 34 60
Acetyl Intermediates 207 146 353
Other Activities 1 (12) (28) (40)
Total 348 326 674
*Quarterly earnings for the discontinued Edmonton Methanol 33 (2) 31
operations have been included in Other Charges and Other Adjustments.
1
Other Activities primarily includes corporate selling, general and administrative expenses and the results from captive insurance companies.
2
Includes equity earnings from affiliates, dividends from cost investments and other income/(expense).
3
Excludes adjustments to minority interest, net interest, taxes, depreciation, amortization and discontinued operations.