Call Girls Near Delhi Pride Hotel, New Delhi|9873777170
marathon oil 3rd Quarter 2008
1. MARATHON OIL CORPORATION REPORTS
THIRD QUARTER 2008 RESULTS
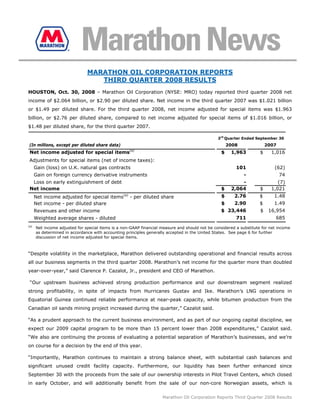
HOUSTON, Oct. 30, 2008 – Marathon Oil Corporation (NYSE: MRO) today reported third quarter 2008 net
income of $2.064 billion, or $2.90 per diluted share. Net income in the third quarter 2007 was $1.021 billion
or $1.49 per diluted share. For the third quarter 2008, net income adjusted for special items was $1.963
billion, or $2.76 per diluted share, compared to net income adjusted for special items of $1.016 billion, or
$1.48 per diluted share, for the third quarter 2007.
3rd Quarter Ended September 30
(In millions, except per diluted share data) 2008 2007
Net income adjusted for special items(a) $ 1,963 $ 1,016
Adjustments for special items (net of income taxes):
Gain (loss) on U.K. natural gas contracts 101 (62)
Gain on foreign currency derivative instruments - 74
Loss on early extinguishment of debt - (7)
Net income $ 2,064 $ 1,021
$ 2.76 $ 1.48
(a)
Net income adjusted for special items - per diluted share
$ 2.90 $ 1.49
Net income - per diluted share
$ 23,446 $ 16,954
Revenues and other income
711 685
Weighted average shares - diluted
(a)
Net income adjusted for special items is a non-GAAP financial measure and should not be considered a substitute for net income
as determined in accordance with accounting principles generally accepted in the United States. See page 6 for further
discussion of net income adjusted for special items.
“Despite volatility in the marketplace, Marathon delivered outstanding operational and financial results across
all our business segments in the third quarter 2008. Marathon’s net income for the quarter more than doubled
year-over-year,” said Clarence P. Cazalot, Jr., president and CEO of Marathon.
“Our upstream business achieved strong production performance and our downstream segment realized
strong profitability, in spite of impacts from Hurricanes Gustav and Ike. Marathon’s LNG operations in
Equatorial Guinea continued reliable performance at near-peak capacity, while bitumen production from the
Canadian oil sands mining project increased during the quarter,” Cazalot said.
“As a prudent approach to the current business environment, and as part of our ongoing capital discipline, we
expect our 2009 capital program to be more than 15 percent lower than 2008 expenditures,” Cazalot said.
“We also are continuing the process of evaluating a potential separation of Marathon’s businesses, and we’re
on course for a decision by the end of this year.
“Importantly, Marathon continues to maintain a strong balance sheet, with substantial cash balances and
significant unused credit facility capacity. Furthermore, our liquidity has been further enhanced since
September 30 with the proceeds from the sale of our ownership interests in Pilot Travel Centers, which closed
in early October, and will additionally benefit from the sale of our non-core Norwegian assets, which is
Marathon Oil Corporation Reports Third Quarter 2008 Results
2. expected to close October 31. Marathon is on track to achieve our goal of $2 - $4 billion in gross proceeds
from the ongoing portfolio review by mid-year 2009,” he said.
Segment Results
Total segment income was $2.063 billion in the third quarter of 2008, compared to $1.013 billion in the third
quarter of 2007.
3rd
Quarter Ended September 30
(In millions) 2008 2007
Segment Income (Loss)
Exploration & Production (E&P)
United States $ 285 $ 147
International 654 332
Total E&P 939 479
Oil Sands Mining (OSM) 288 -
Refining, Marketing & Transportation (RM&T) 771 482
Integrated Gas (IG) 65 52
(a)
Segment Income $ 2,063 $ 1,013
a)
See Preliminary Supplemental Statistics on page 9 for a reconciliation of segment income to net income as reported under
generally accepted accounting principles.
Exploration and Production
Exploration and Production segment income totaled $939 million in the third quarter of 2008, almost double
the $479 million reported in the third quarter of 2007. The increase was primarily a result of the average
liquid hydrocarbon price realization reaching $111.33 per barrel, as well as higher sales volumes. This liquid
hydrocarbon price realization was 63 percent higher, compared to the third quarter of 2007.
Sales volumes during the quarter averaged 379,000 barrels of oil equivalent per day (boepd), compared to
371,000 boepd for the same period last year, despite shutting-in the Gulf of Mexico operations for hurricanes.
Production from the Alvheim/Vilje development offshore Norway and from the new Neptune development in
the Gulf of Mexico more than compensated for those weather-related declines.
Hurricanes Gustav and Ike impacted Gulf of Mexico production for the latter part of the third quarter, resulting
in approximately 9,500 net boepd being shut-in during the quarter. The Neptune development, in which
Marathon holds a 30 percent outside-operated working interest, was shut down during the hurricanes but
resumed production on Sept. 25, and the Marathon-operated Ewing Bank development resumed production on
Oct. 27. However, the non-operated Troika and Ursa fields remain shut-in for repairs. Marathon holds an
approximate 65 percent operated interest in Ewing Bank, a 50 percent working interest in Troika and a 3.5
percent overriding royalty interest in Ursa.
Production available for sale in the third quarter 2008 averaged 389,000 boepd, compared to 373,000 boepd
in the same period last year, an increase of more than 4 percent. Excluding hurricane impacts, the year-on-
year increase would have been nearly 7 percent. The difference between production volumes available for sale
and the recorded sales volumes is due to the timing of international oil liftings and natural gas held in storage.
The Company has narrowed its expectation for 2008 production available for sale to be between 385,000 and
395,000 boepd, excluding the effects of any dispositions.
Marathon Oil Corporation Reports Third Quarter 2008 Financial Results page 2
3. United States upstream income was $285 million in the third quarter of 2008, compared to $147 million in the
third quarter of 2007, primarily as a result of higher liquid hydrocarbon and natural gas price realizations
partially offset by increased costs, operating expense and depletion, depreciation and amortization, primarily
related to new production and higher income taxes.
International upstream income was $654 million in the third quarter of 2008, compared to $332 million in the
third quarter of 2007. The increase was primarily a result of higher liquid hydrocarbon prices, sales volumes
and natural gas price realizations, partially offset by increased costs related to new production and higher
income taxes.
3rd Quarter Ended September 30
2008 2007
Key Production Statistics
Net Sales
United States – Liquids (mbpd) 63 63
United States – Natural gas (mmcfpd) 426 464
International – Liquids (mbpd) 161 136
International – Natural gas (mmcfpd) 502 567
Total Net Sales (mboepd) 379 371
The Vilje field offshore Norway began production in late July 2008. Commissioning of the Alvheim/Vilje project
is continuing with a total of 10 wells currently available for production, out of a total of 12 producing wells
planned for Phase 1. Marathon has seen extended periods of production at facility capacity of 125,000 gross
boepd (75,000 net boepd) and expects stabilization at these rates during November. Marathon has a 65
percent operated interest in the Alvheim fields and a 47 percent outside-operated working interest in the Vilje
field.
In the Gulf of Mexico, Marathon announced a deepwater discovery on the Freedom/Gunflint prospect on Oct.
14. The discovery well, located on Mississippi Canyon Block 948, encountered more than 550 feet of net
hydrocarbon-bearing sands in the Middle and Lower Miocene reservoirs. Marathon holds a 12.5 percent
working interest in the block.
Marathon made its 28th deepwater discovery offshore Angola with the Dione discovery well on Block 31,
announced on Oct. 15. Marathon holds a 10 percent outside-operated interest in Block 31 and a 30 percent
outside-operated interest in Block 32.
In October, the Company was awarded a 49 percent interest and operatorship in the Bone Bay Block offshore
Indonesia. This high potential, under-explored area has water depths ranging between 165 to 6,500 feet. The
Bone Bay Block is about 200 miles southeast of Marathon's Pasangkayu Block, which was awarded in 2006.
Oil Sands Mining
The Oil Sands Mining segment reported income of $288 million for the third quarter of 2008. This reflects a
net after-tax gain of $190 million on crude oil derivative instruments, which includes a realized after-tax loss
of $24 million and an unrealized after-tax mark-to-market gain of $214 million. These derivative instruments
were put in place by Western Oil Sands Inc. prior to its acquisition by Marathon in October 2007 to mitigate
price risk related to future sales of synthetic crude oil. The last of these derivative instruments is set to expire
in the fourth quarter of 2009.
Marathon Oil Corporation Reports Third Quarter 2008 Financial Results page 3
4. Marathon’s third quarter 2008 net bitumen production before royalties from the Athabasca Oil Sands Project
(AOSP) mining operation was approximately 28,000 bpd. Third quarter production increased 15 percent over
the second quarter 2008 due to greater reliability of delivery of mined ore to the processing plant. Also, during
the third quarter, the royalty calculation rate applicable to bitumen production from the Muskeg River Mine
increased from 1 percent of gross revenue to 25 percent of net revenue, as per applicable regulations,
following the achievement of the project’s payout.
3rd Quarter Ended September 30
2008 2007
Key Oil Sands Mining Statistics
Net Bitumen Production (mbpd)(a) 28 -
Net Synthetic Crude Oil Sales (mbpd) 32 -
(b)
Synthetic Crude Oil Average Realization (per bbl) $ 113.42 $ -
(a)
Before royalties.
(b)
Excludes gains/losses on derivative instruments.
The AOSP Phase 1 expansion is on track and is anticipated to begin operations in the 2010/2011 timeframe.
The Phase 1 expansion includes construction of mining and extraction facilities at the Jackpine mine,
expansion of treatment facilities at the existing Muskeg River mine, expansion of the Scotford upgrader and
development of related infrastructure.
Refining, Marketing and Transportation
The Refining, Marketing and Transportation (RM&T) segment income was $771 million in the third quarter of
2008 compared to $482 million in the third quarter of 2007. The increase was primarily a result of a higher
refining and wholesale marketing gross margin, in part attributable to a substantial drop in crude oil prices.
The third quarter margin also benefited from an increase in the average sweet/sour differentials compared to
the same quarter last year.
The refining and wholesale marketing gross margin per gallon was 25.19 cents in the third quarter of 2008,
compared to 17.17 cents in the third quarter of 2007. Marathon’s refining and wholesale marketing gross
margin included pre-tax derivative gains of $156 million for the third quarter of 2008 compared to losses of
$360 million for the third quarter of 2007. The variance primarily reflects falling crude futures prices, as well
as the fact that the Company no longer uses derivatives to mitigate its domestic crude oil acquisition price
risk. Most of these derivatives have an underlying physical commodity transaction; however, the income effect
related to the derivatives and the income effect related to the underlying physical transactions may not
necessarily be recognized in net income in the same period. Marathon expects to selectively continue its
practice of using derivatives to protect the carrying value of seasonal RM&T inventories and long-haul foreign
crude oil spot purchases.
Crude oil refined during the third quarter of 2008 averaged 955,000 bpd, an 87,000 bpd decrease from the
third quarter of 2007, and total refinery throughputs were 1,144,000 bpd, approximately 8 percent lower than
the 1,241,000 bpd in the third quarter of 2007, attributable primarily to weather-related impacts.
Speedway SuperAmerica LLC (SSA) gasoline and distillates gross margin per gallon averaged 16.9 cents in the
third quarter of 2008, compared to 11.03 cents in the third quarter of 2007. SSA same store gasoline sales
volume declined by approximately 12 percent during the third quarter of 2008 while same store merchandise
sales increased by approximately 2 percent during the same period. During the third quarter 2007, SSA
Marathon Oil Corporation Reports Third Quarter 2008 Financial Results page 4
5. completed a special sales promotion that was estimated to increase SSA’s 2007 third quarter same store
gasoline volume by approximately 6 percent. Excluding this special sales promotion, the Company estimates
that SSA’s third quarter same store gasoline volume decline would have been approximately 6 percent.
3rd Quarter Ended September 30
2008 2007
Key Refining, Marketing & Transportation Statistics
Crude Oil Refined (mbpd) 955 1,042
Other Charge and Blend Stocks (mbpd) 189 199
Total Refinery Inputs (mbpd) 1,144 1,241
Refined Product Sales Volumes (mbpd) 1,357 1,440
Refining and Wholesale Marketing Gross Margin ($/gallon) $ 0.2519 $ 0.1717
In the third quarter, Marathon announced an agreement to sell its 50 percent ownership interest in Pilot
Travel Centers LLC (PTC) to Pilot Corporation. The transaction, valued at approximately $700 million before
tax, was completed in October 2008.
The Garyville Major Expansion (GME) project is approximately 70 percent complete with an on-schedule
startup expected in the fourth quarter 2009. The Company has identified minor increases for additional
quantities of materials required, material and labor escalation and some additional costs associated with the
recent hurricanes in the Gulf Coast region. Marathon now projects the project will cost about $3.35 billion, or
approximately 5 percent more than the original estimate.
All the permits have been received for the Detroit Heavy Oil Upgrading Project (DHOUP) and construction
started at the end of the second quarter of 2008. Due to the current market conditions, Marathon is in the
process of reevaluating the project construction schedule and expects to defer the project completion. The
Company is currently compiling the new project schedule and cost, and expects to complete this analysis by
year-end 2008.
Integrated Gas
Integrated Gas segment income was $65 million in the third quarter of 2008 compared to $52 million in the
third quarter of 2007.
3rd Quarter Ended September 30
2008 2007
Key Integrated Gas Statistics
Net Sales (mtpd)
LNG 6,048 6,137
Methanol 757 1,421
Net LNG sales for the third quarter of 2008 exceeded original estimates as the 60 percent Marathon-owned
Equatorial Guinea LNG facility has delivered increased reliability at the facility and the ability to produce LNG
in excess of the plant’s nameplate capacity of 3.7 million metric tonnes per annum. EGLNG production was
curtailed for 16 days in July while scheduled repairs and modifications were completed on the facility to
improve the overall efficiency of the plant. The operational availability of the facility has been superior,
operating at 97.8 percent year-to-date with 13 cargoes delivered during the third quarter of 2008.
Marathon Oil Corporation Reports Third Quarter 2008 Financial Results page 5
6. Pre-tax earnings from Atlantic Methanol Production Company LLC (AMPCO) methanol sales were
approximately $5 million in the third quarter. Profitability was impacted by a series of planned and unplanned
maintenance events, but the facility was returned to full production status in October and is presently
operating at full capacity, or 1,064,000 gross tons per annum. Marathon holds a 45 percent interest in
AMPCO.
Marathon continues to invest in the development of new technologies to create value and supply new energy
sources. The Company expended approximately $21 million on a pretax basis during the third quarter of 2008
on gas commercialization technologies, including completing the construction and beginning the
TM
commissioning of the demonstration plant to further develop its proprietary Gas-To-Fuels technology.
Expenses in the third quarter of 2007 for comparable items amounted to $12 million on a pre-tax basis.
Corporate
At Sept. 30, 2008, Marathon’s main sources of short-term liquidity amounted to approximately $3.2 billion,
comprised of approximately $1.5 billion of cash equivalents and $1.7 billion of unused capacity under its $3
billion committed revolving credit facility. At Oct. 29, 2008, Marathon’s cash balance remained at
approximately the same level of $1.5 billion while it had nearly the full $3 billion of capacity under the
previously mentioned committed revolving credit facility bring total liquidity to approximately $4.5 billion.
At Sept. 30, 2008, the Company had a 23 percent cash-adjusted debt-to-capital ratio.
Marathon continued its share repurchase program during the third quarter, repurchasing approximately 2.3
million shares at a cost of approximately $107 million. Since January 2006, Marathon’s Board of Directors has
authorized the repurchase of up to $5 billion of Marathon’s common stock. As of the end of the third quarter,
approximately $2.9 billion in Marathon shares had been repurchased, bringing total shares repurchased so far
to 65.9 million.
Special Items
Marathon has two natural gas sales contracts in the United Kingdom that are accounted for as derivative
instruments. Mark-to-market changes in the valuation of these contracts must be recognized in current period
income. In the third quarter of 2008, the non-cash after-tax mark-to-market gain on these contracts related
to sales of natural gas from the Brae field complex totaled $101 million. Due to the volatility in the fair value
of these contracts, Marathon consistently excludes these non-cash gains and losses from net income adjusted
for special items.
During the third quarter of 2007, Marathon entered foreign currency derivative instruments to limit the
Company’s exposure to changes in the Canadian dollar exchange rate related to the acquisition of Western Oil
Sands, Inc. The non-cash after-tax unrealized gains on these derivative instruments of $74 million were
excluded from net income adjusted for special items for third quarter 2007.
The Company will conduct a conference call and webcast today, Oct. 30, at 2:00 p.m. EDT during which it will
discuss third quarter results. The webcast will include synchronized slides. To listen to the webcast of the
conference call and view the slides, visit the Marathon website at www.Marathon.com. Replays of the webcast
will be available through Nov. 13, 2008. Quarterly financial and operational information is also provided on
Marathon’s Web site at http://ir.marathon.com in the Quarterly Investor Packet.
Marathon Oil Corporation Reports Third Quarter 2008 Financial Results page 6
7. ###
In addition to net income determined in accordance with generally accepted accounting principles, Marathon
has provided supplementally “net income adjusted for special items,” a non-GAAP financial measure which
facilitates comparisons to earnings forecasts prepared by stock analysts and other third parties. Such
forecasts generally exclude the effects of items that are considered non-recurring, are difficult to predict or to
measure in advance or that are not directly related to Marathon's ongoing operations. A reconciliation between
GAAP net income and “net income adjusted for special items” is provided in a table on page 1 of this release.
“Net income adjusted for special items” should not be considered a substitute for net income as reported in
accordance with GAAP. Management, as well as certain investors, uses “net income adjusted for special
items” to evaluate Marathon's financial performance between periods. Management also uses “net income
adjusted for special items” to compare Marathon's performance to certain competitors.
Unlike capital expenditures reported under generally accepted accounting principles, the projected costs for
the Garyville refinery expansion project discussed in this release do not include capitalized interest.
Capitalized interest is budgeted at the corporate level.
This release contains forward-looking statements with respect to 2008 worldwide net liquid hydrocarbon and
natural gas production available for sale, the AOSP expansion, projected 2009 capital spending, the goal of
achieving $2 - $4 billion in gross proceeds from asset dispositions by mid-year 2009, timing and levels of
production from the Alvheim/Vilje development, the potential separation of Marathon’s businesses,
anticipated future exploratory and development drilling activity, the Garyville refinery expansion project, the
Detroit refinery heavy oil upgrading and expansion project, and the common stock repurchase program. The
projected 2009 capital spending budget is based on current expectations, estimates and projections and is not
a guarantee of future performance. Some factors that could potentially affect the projected asset dispositions
include changes in prices of and demand for crude oil, natural gas and refined products, actions of
competitors, future financial condition and operating results, and economic, business, competitive and/or
regulatory factors affecting the Company’s businesses. Some factors that could potentially affect 2008
worldwide net liquid hydrocarbon and natural gas production available for sale, the timing and levels of
production from the Alvheim/Vilje development, and anticipated future exploratory and development drilling
activity include pricing, supply and demand for petroleum products, the amount of capital available for
exploration and development, regulatory constraints, timing of commencing production from new wells,
drilling rig availability, unforeseen hazards such as weather conditions, acts of war or terrorist acts and the
governmental or military response thereto, and other geological, operating and economic considerations.
Worldwide net liquid hydrocarbon and natural gas production available for sale could also be affected by the
occurrence of acquisitions or dispositions of oil and gas properties. Factors that could affect the potential
separation of Marathon include board approval, future financial condition and operating results, and economic,
business, competitive and/or regulatory factors affecting our businesses. Factors that could affect the AOSP
expansion, the Garyville refinery expansion and the Detroit refinery heavy oil upgrading and expansion
projects include transportation logistics, availability of materials and labor, unforeseen hazards such as
weather conditions, delays in obtaining or conditions imposed by necessary government and third-party
approvals, and other risks customarily associated with construction projects. The common stock repurchase
program could be affected by changes in prices of and demand for crude oil, natural gas and refined products,
actions of competitors, disruptions or interruptions of the Company’s production or refining operations due to
unforeseen hazards such as weather conditions or acts of war or terrorist acts, a decision to separate
Marathon’s businesses, and other operating and economic considerations. The foregoing factors (among
others) could cause actual results to differ materially from those set forth in the forward-looking statements.
In accordance with the quot;safe harborquot; provisions of the Private Securities Litigation Reform Act of 1995,
Marathon Oil Corporation has included in its Annual Report on Form 10-K for the year ended December 31,
2007, and subsequent Forms 10-Q and 8-K, cautionary language identifying other important factors, though
not necessarily all such factors, that could cause future outcomes to differ materially from those set forth in
the forward-looking statements.
Media Relations Contacts: Lee Warren 713-296-4103
Paul Weeditz 713-296-3910
Investor Relations Contacts: Howard Thill 713-296-4140
Chris Phillips 713-296-3213
Marathon Oil Corporation Reports Third Quarter 2008 Financial Results page 7
8. Condensed Consolidated Statements of Income (Unaudited)
3rd Quarter Ended Nine Months Ended
September 30 September 30
(In millions, except per share data) 2008 2007 2008 2007
Revenues and other income:
Sales and other operating revenues
22,477 16,347 60,983 45,221
(including consumer excise taxes) $
637 415 1,865 1,146
Sales to related parties
270 170 735 394
Income from equity method investments
15 2 37 20
Net gain on disposal of assets
47 20 151 62
Other income
23,446 16,954 63,771 46,843
Total revenues and other income
Costs and expenses:
16,992 12,951 49,432 34,358
Cost of revenues (excludes items below)
244 104 609 240
Purchases from related parties
1,273 1,352 3,784 3,856
Consumer excise taxes
597 409 1,552 1,198
Depreciation, depletion and amortization
351 336 1,012 950
Selling, general and administrative expenses
126 95 376 286
Other taxes
109 88 368 264
Exploration expenses
19,692 15,335 57,133 41,152
Total costs and expenses
Income from operations 3,754 1,619 6,638 5,691
(53) 19 (54) 58
Net interest and other financing income (costs)
- 120 - 120
Gain on foreign currency derivative instruments
- (11) - (14)
Loss on early extinguishment of debt
Minority interests in loss of Equatorial Guinea
LNG Holdings Limited - - - 3
Income before income taxes 3,701 1,747 6,584 5,858
,
1,637 726 3,015 2,578
Provision for income taxes
Income from continuing operations 2,064 1,021 3,569 3,280
- - - 8
Discontinued operations
Net income $ 2,064 $ 1,021 $ 3,569 $ 3,288
Income from continuing operations
Per share - basic $ 2.92 $ 1.50 $ 5.03 $ 4.80
Per share - diluted $ 2.90 $ 1.49 $ 5.00 $ 4.76
Net income
Per share - basic $ 2.92 $ 1.50 $ 5.03 $ 4.81
Per share - diluted $ 2.90 $ 1.49 $ 5.00 $ 4.77
Dividends paid per share $ 0.24 $ 0.24 $ 0.72 $ 0.68
Weighted Average Shares:
707 680 710 684
Basic
711 685 714 689
Diluted
Marathon Oil Corporation Reports Third Quarter 2008 Financial Results page 8
9. Preliminary Supplemental Statistics (Unaudited)
3rd Quarter Ended Nine Months Ended
September 30 September 30
(Dollars in millions, except as noted) 2008 2007 2008 2007
Segment Income (Loss)
Exploration and Production
United States $ 147 $ 470
$ 285 $ 888
International 332 794
654 1,563
E&P segment 939 479 2,451 1,264
Oil Sands Mining 288 158
- -
Refining, Marketing and Transportation 482 2,073
771 854
Integrated Gas 52 83
65 266
Segment income 2,063 1,013 3,729 3,420
Items not allocated to segments, net of income taxes:
Corporate and other unallocated items (100) 3 (141) (149)
Gain on foreign currency derivative instruments - 74 - 74
Gain (loss) on U.K. natural gas contracts 101 (62) (19) (56)
Loss on early extinguishment of debt - (7) - (9)
Discontinued operations - - - 8
Net income $ 2,064 $ 1,021 $ 3,569 $ 3,288
Capital Expenditures
$ 738 $ 582 $ 2,387 $ 1,623
Exploration and Production
271 781
Oil Sands Mining - -
765 430 1,978 981
Refining, Marketing and Transportation
Integrated Gas(a) 3 2 4 93
Corporate 9 12 18 28
Total $ 1,786 $ 1,026 $ 5,168 $ 2,725
Exploration Expenses
United States $ 68 $ 53 $ 173 $ 137
International 41 35 195 127
Total $ 109 $ 88 $ 368 $ 264
E&P Operating Statistics
Net Liquid Hydrocarbon Sales (mbpd)(b)
United States 63 63 63 66
Europe 66 33 43 33
Africa 95 103 93 100
Total International 161 136 136 133
Worldwide 224 199 199 199
Net Natural Gas Sales (mmcfd) (b)(c)
United States 426 464 446 478
Europe 156 195 195 206
Africa 346 372 379 221
Total International 502 567 574 427
Worldwide 928 1,031 1,020 905
Total Worldwide Sales (mboepd) 379 371 369 350
(a)
Through April 2007, includes EGHoldings at 100 percent. Effective May 1, 2007, Marathon no longer consolidates EGHoldings
and its investment in EGHoldings is accounted for prospectively using the equity method of accounting; therefore, EGHoldings’
capital expenditures subsequent to April 2007 are not included in Marathon’s capital expenditures.
(b)
Amounts are net after royalties, except for Ireland where amounts are before royalties.
(c)
Includes natural gas acquired for injection and subsequent resale of 2 mmcfd and 51 mmcfd in the third quarters of 2008 and
2007 and 21 mmcfd and 49 mmcfd in the first nine months of 2008 and 2007.
Marathon Oil Corporation Reports Third Quarter 2008 Financial Results page 9
10. Preliminary Supplemental Statistics (Unaudited)
(continued)
3rd Quarter Ended Nine Months Ended
September 30 September 30
(Dollars in millions, except as noted) 2008 2007 2008 2007
E&P Operating Statistics (continued)
Average Realizations(d)
Liquid Hydrocarbons (per bbl)
United States $ 106.81 $ 63.53 $ 100.27 $ 55.83
Europe $ 118.52 $ 73.19 $ 115.15 $ 63.80
Africa $ 109.36 $ 69.48 $ 102.11 $ 60.57
Total International $ 113.10 $ 70.37 $ 106.21 $ 61.37
Worldwide $ 111.33 $ 68.21 $ 104.33 $ 59.54
Natural Gas (per mcf)
United States $ 7.70 $ 5.14 $ 7.70 $ 5.74
Europe $ 8.85 $ 6.47 $ 8.10 $ 5.95
Africa $ 0.25 $ 0.25 $ 0.25 $ 0.25
Total International $ 2.92 $ 2.38 $ 2.91 $ 3.01
Worldwide $ 5.11 $ 3.63 $ 5.00 $ 4.45
OSM Operating Statistics
- -
28 25
Net Bitumen Production (mbpd)(e)
- -
32 31
Net Synthetic Crude Sales (mbpd)(e)
$ 113.42 $ - $ 106.37 $ -
Synthetic Crude Average Realization (per bbl)(d)
RM&T Operating Statistics
Refinery Runs (mbpd)
955
Crude oil refined 1,042 941 1,028
189
Other charge and blend stocks 199 201 211
Total 1,144 1,241 1,142 1,239
Refined Product Yields (mbpd)
586 598
Gasoline 646 649
358 336
Distillates 358 352
21 22
Propane 24 24
95 104
Feedstocks and special products 111 118
20 24
Heavy fuel oil 27 25
79 75
Asphalt 93 87
1,159 1,159
Total 1,259 1,255
1,357 1,440 1,335 1,403
Refined Product Sales Volumes (mbpd)(f)
Refining and Wholesale Marketing Gross
$ 0.2519 $ 0.1717 $ 0.1137 $ 0.2317
Margin (per gallon)(g)
Speedway SuperAmerica
Retail outlets 1,620 1,637 - -
Gasoline & distillates sales (millions of gallons) 796 892 2,376 2,520
Gasoline & distillates gross margin (per gallon) $ 0.1690 $ 0.1103 $ 0.1235 $ 0.1115
Merchandise sales $ 764 $ 752 $ 2,133 $ 2,110
Merchandise gross margin $ 197 $ 191 $ 541 $ 533
IG Operating Statistics
Sales Volumes (mtpd)(h)
6,048
LNG 6,137 6,453 3,117
757
Methanol 1,421 1,024 1,285
(d)
Excludes gains and losses on derivative instruments (including the unrealized effects of U.K. natural gas sales contracts that are
accounted for as derivatives).
(e)
Amount is before royalties.
(f)
Total average daily volumes of all refined product sales to wholesale, branded and retail customers.
(g)
Sales revenue less cost of refinery inputs, purchased products and manufacturing expenses, including depreciation.
(h)
LNG sales volumes include both consolidated sales (Alaska) and our share of the sales of an equity method investee (Equatorial
Guinea). Methanol sales volumes represent our share of sales of an equity method investee in Equatorial Guinea.
Marathon Oil Corporation Reports Third Quarter 2008 Financial Results page 10