More Related Content
Similar to agilent Operating_Results_Q106_to_Q108
Similar to agilent Operating_Results_Q106_to_Q108 (20)
agilent Operating_Results_Q106_to_Q108
- 1. Agilent Operating Results Q1F06 – Q1F08
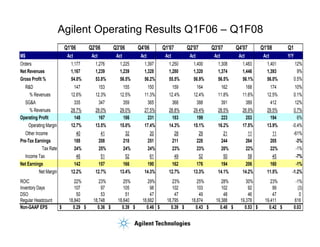
Q1'06 Q2'06 Q3'06 Q4'06 Q1'07 Q2'07 Q3'07 Q4'07 Q1'08 Q1
M$ Act Act Act Act Act Act Act Act Act Y/Y
Orders 1,177 1,276 1,225 1,397 1,250 1,400 1,308 1,483 1,401 12%
Net Revenues 1,167 1,239 1,239 1,328 1,280 1,320 1,374 1,446 1,393 9%
0.5%
Gross Profit % 54.0% 53.8% 56.5% 56.2% 55.5% 56.9% 56.5% 56.1% 56.0%
R&D 147 153 155 150 159 164 162 168 174 10%
% Revenues 12.6% 12.3% 12.5% 11.3% 12.4% 12.4% 11.8% 11.6% 12.5% 0.1%
SG&A 335 347 359 365 368 388 391 389 412 12%
% Revenues 28.7% 28.0% 29.0% 27.5% 28.8% 29.4% 28.5% 26.9% 29.5% 0.7%
Operating Profit 148 167 186 231 183 199 223 253 194 6%
Operating Margin 12.7% 13.5% 15.0% 17.4% 14.3% 15.1% 16.2% 17.5% 13.9% -0.4%
Other Income 40 41 32 20 28 29 21 11 11 -61%
Pre-Tax Earnings 188 208 218 251 211 228 244 264 205 -3%
Tax Rate -1%
24% 25% 24% 24% 23% 23% 20% 22% 22%
Income Tax 46 51 52 61 49 52 50 58 45 -7%
Net Earnings 142 157 166 190 162 176 194 206 160 -1%
Net Margin 12.2% 12.7% 13.4% 14.3% 12.7% 13.3% 14.1% 14.2% 11.5% -1.2%
ROIC 22% 23% 25% 29% 23% 25% 28% 30% 23% -1%
Inventory Days 107 97 105 98 102 103 102 92 99 (3)
DSO 50 53 51 47 47 49 48 46 47 0
Regular Headcount 18,840 18,748 18,640 18,682 18,795 18,874 19,388 19,378 19,411 616
Non-GAAP EPS $ 0.29 $ 0.36 $ 0.39 $ 0.46 $ 0.39 $ 0.43 $ 0.48 $ 0.53 $ 0.42 $ 0.03