csx D93D32C8-49C6-4DAC-B096-D1A37B1CA483_AAR2009WK07_csx
- 1. CSX
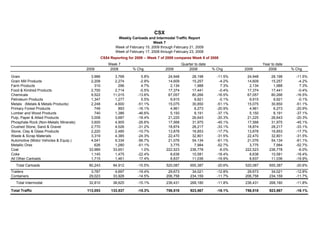
Weekly Carloads and Intermodal Traffic Report
Week 7
Week of February 15, 2009 through February 21, 2009
Week of February 17, 2008 through February 23, 2008
CS54 Reporting for 2009 -- Week 7 of 2009 compares Week 8 of 2008
Week 7 Quarter to date Year to date
2009 2008 % Chg 2009 2008 % Chg 2009 2008 % Chg
Grain 3,986 3,768 5.8% 24,948 28,198 -11.5% 24,948 28,198 -11.5%
Grain Mill Products 2,208 2,274 -2.9% 14,609 15,257 -4.2% 14,609 15,257 -4.2%
Farm Products 310 296 4.7% 2,134 1,988 7.3% 2,134 1,988 7.3%
Food & Kindred Products 2,700 2,714 -0.5% 17,374 17,441 -0.4% 17,374 17,441 -0.4%
Chemicals 9,522 11,015 -13.6% 67,057 80,266 -16.5% 67,057 80,266 -16.5%
Petroleum Products 1,347 1,277 5.5% 9,915 9,921 -0.1% 9,915 9,921 -0.1%
Metals (Metals & Metals Products) 2,248 4,600 -51.1% 15,075 30,850 -51.1% 15,075 30,850 -51.1%
Primary Forest Products 749 893 -16.1% 4,961 6,273 -20.9% 4,961 6,273 -20.9%
Lumber and Wood Products 740 1,386 -46.6% 5,150 8,191 -37.1% 5,150 8,191 -37.1%
Pulp, Paper & Allied Products 3,008 3,687 -18.4% 21,225 26,643 -20.3% 21,225 26,643 -20.3%
Phosphate Rock (Non-Metalic Minerals) 3,600 4,905 -26.6% 17,568 31,975 -45.1% 17,568 31,975 -45.1%
Crushed Stone, Sand & Gravel 2,770 4,026 -31.2% 18,874 28,217 -33.1% 18,874 28,217 -33.1%
Stone, Clay & Glass Products 2,220 2,485 -10.7% 13,878 16,853 -17.7% 13,878 16,853 -17.7%
Waste & Scrap Materials 3,319 4,385 -24.3% 22,470 32,801 -31.5% 22,470 32,801 -31.5%
Automotive (Motor Vehicles & Equip.) 4,041 9,334 -56.7% 21,076 54,134 -61.1% 21,076 54,134 -61.1%
Metallic Ores 626 1,280 -51.1% 3,775 7,984 -52.7% 3,775 7,984 -52.7%
Coal 33,989 33,651 1.0% 222,523 236,778 -6.0% 222,523 236,778 -6.0%
Coke 1,145 1,475 -22.4% 8,638 10,581 -18.4% 8,638 10,581 -18.4%
All Other Carloads 1,715 1,461 17.4% 8,837 11,036 -19.9% 8,837 11,036 -19.9%
Total Carloads 80,243 94,912 -15.5% 520,087 655,387 -20.6% 520,087 655,387 -20.6%
Trailers 3,787 4,697 -19.4% 29,673 34,021 -12.8% 29,673 34,021 -12.8%
Containers 29,023 33,928 -14.5% 206,758 234,159 -11.7% 206,758 234,159 -11.7%
Total Intermodal 32,810 38,625 -15.1% 236,431 268,180 -11.8% 236,431 268,180 -11.8%
Total Traffic 113,053 133,537 -15.3% 756,518 923,567 -18.1% 756,518 923,567 -18.1%