1. FINANCIAL SUPPLEMENT TO FIRST QUARTER 2008 EARNINGS RELEASE
Summary
Quarterly earnings of $0.48 per diluted share (GAAP); excluding $0.07 in after-tax merger charges, earnings were
$0.55 (non-GAAP - see page 17 for additional details)
• First quarter earnings included several significant, largely offsetting, items:
$91.6 million securities sale gain; $62.8 million Visa IPO gain; $28.4 million litigation expense reduction related to the
Visa IPO; $42.0 million MSR impairment charge; $65.4 million early debt extinguishment loss; $24.5 million write-down of
investments in two Morgan Keegan mutual funds; $181.0 million loan loss provision--$55.2 million above net charge-offs
Non-performing assets, net charge-offs rise as expected
• Total net charge-offs up 8 bps linked-quarter to annualized 53 bps of average loans, driven by the residential homebuilder
and home equity portfolios
• Home equity losses rose to annualized 57 bps due to declining home values; remains manageable compared to peers
• Non-performing assets increased to $1,204.4 million, or 1.25% of loans and OREO vs. year-end 2007’s 0.90%
• Residential homebuilder portfolio was the primary driver of non-performing asset growth
• Allowance for credit losses increased to 1.49% of loans at March 31, 2008
Residential homebuilder portfolio exposure declines; workout strategy fully implemented
• The residential homebuilder portfolio declined $1.3 billion, the majority of which relates to paydowns. Partially offsetting
this decline was $340 million of additional funding. The total portfolio stands at $6.2 billion as of March 31, 2008
• Includes $1.2 billion of relationships being proactively managed by an experienced Special Assets real estate team
Core fee-based revenue posts strong gain
• Non-interest revenue, excluding securities and Visa gains, up an annualized 11% linked quarter—benefiting from
diversification and focused growth initiatives
• Brokerage income remained healthy despite market turmoil
• Commercial credit fee income up $18.7 million, driven by surge in customer derivative transactions
• Insurance fees strong, reflecting the January 2008 purchase of Barksdale Bonding & Insurance and seasonal increases
Spread revenue dips slightly despite modestly improved loan growth
• Average loan growth rose to annualized 4% in first quarter 2008 from fourth quarter 2007’s 2% pace
• Average low-cost deposits declined linked quarter, largely due to run-down in commercial balances -
but began to see upturn in March
• Net interest margin dropped 8 bps linked quarter to 3.53%, pressured by a negative funding mix shift and changes in the
term structure of interest rates
Better-than-projected cost saves; significantly raising target
• Core operating expenses stable linked quarter despite the first quarter seasonal jump in FICA and benefits costs
• Realized $127 million in first quarter merger cost saves, bringing run-rate to $510 million vs. targeted mid-year $500 million
• Raised cost saves run-rate target to $700 million by year-end 2008—reflects success to date and new initiatives
• In late March, eliminated approximately 700 positions not included in initial cost save estimates
Maintains strong capital position
• Tangible common equity-to-tangible assets increased to 5.90% at March 31, 2008, compared to 5.88% year-end 2007
2. FINANCIAL SUPPLEMENT TO
FIRST QUARTER 2008 EARNINGS RELEASE
PAGE 2
Regions Financial Corporation and Subsidiaries
Consolidated Balance Sheets
(Unaudited)
($ amounts in thousands)
3/31/08 12/31/07 9/30/07 6/30/07 3/31/07
Assets:
Cash and due from banks $3,061,324 $3,720,365 $2,902,340 $2,796,196 $2,991,232
Interest-bearing deposits
in other banks 47,850 31,706 29,895 73,963 37,365
Federal funds sold and securities
purchased under agreements
to resell 1,071,806 1,177,170 706,378 1,158,771 1,154,994
Trading account assets 1,299,460 907,300 1,355,007 1,606,130 1,490,374
Securities available for sale 17,766,260 17,318,074 16,957,077 17,414,407 18,361,050
Securities held to maturity 49,790 50,935 49,559 44,452 46,008
Loans held for sale 756,500 720,924 792,142 1,596,425 1,175,650
Margin receivables 616,732 504,614 525,953 590,811 555,580
Loans, net of unearned income 96,385,431 95,378,847 94,373,632 94,014,488 94,168,260
Allowance for loan losses (1,376,486) (1,321,244) (1,070,716) (1,061,873) (1,056,260)
Net loans 95,008,945 94,057,603 93,302,916 92,952,615 93,112,000
Premises and equipment, net 2,665,813 2,610,851 2,473,339 2,422,256 2,372,800
Interest receivable 550,117 615,711 664,974 626,514 627,918
Excess purchase price 11,510,096 11,491,673 11,453,078 11,243,287 11,191,675
Mortgage servicing rights (MSRs) 268,784 321,308 377,201 400,056 367,222
Other identifiable intangible assets 729,835 759,832 804,328 809,827 914,410
Other assets 8,845,659 6,753,651 5,841,002 3,886,762 3,669,790
Total Assets $144,248,971 $141,041,717 $138,235,189 $137,622,472 $138,068,068
Liabilities and Stockholders' Equity:
Deposits:
Non-interest-bearing $18,182,582 $18,417,266 $18,834,856 $19,136,419 $19,942,928
Interest-bearing 71,004,827 76,357,702 74,605,074 75,919,972 75,393,720
Total deposits 89,187,409 94,774,968 93,439,930 95,056,391 95,336,648
Borrowed funds:
Short-term borrowings:
Federal funds purchased and
securities sold under agree-
ments to repurchase 8,450,346 8,820,235 8,063,739 8,207,250 8,159,929
Other short-term
borrowings 8,716,951 2,299,887 1,727,346 1,882,114 2,356,205
Total short-term
borrowings 17,167,297 11,120,122 9,791,085 10,089,364 10,516,134
Long-term borrowings 12,357,225 11,324,790 10,817,491 9,287,926 8,593,117
Total borrowed funds 29,524,522 22,444,912 20,608,576 19,377,290 19,109,251
Other liabilities 5,515,119 3,998,808 4,340,334 3,492,404 3,308,003
Total Liabilities 124,227,050 121,218,688 118,388,840 117,926,085 117,753,902
Stockholders' equity:
Common stock 7,358 7,347 7,346 7,344 7,320
Additional paid-in capital 16,560,302 16,544,651 16,527,540 16,500,425 16,447,358
Retained earnings 4,494,573 4,439,505 4,632,033 4,489,078 4,289,354
Treasury stock (1,370,761) (1,370,761) (1,270,922) (1,063,779) (368,837)
Accumulated other comprehensive
income (loss) 330,449 202,287 (49,648) (236,681) (61,029)
Total Stockholders'
Equity 20,021,921 19,823,029 19,846,349 19,696,387 20,314,166
Total Liabilities & SE $144,248,971 $141,041,717 $138,235,189 $137,622,472 $138,068,068
3. FINANCIAL SUPPLEMENT TO
FIRST QUARTER 2008 EARNINGS RELEASE
PAGE 3
Regions Financial Corporation and Subsidiaries
Consolidated Statements of Income (4)
(Unaudited)
($ amounts in thousands, except per share data)
Quarter Ended
3/31/08 12/31/07 9/30/07 6/30/07 3/31/07
Interest income on:
Loans, including fees $1,528,883 $1,674,690 $1,742,172 $1,734,278 $1,773,404
Securities:
Taxable 200,117 202,669 210,932 218,123 224,319
Tax-exempt 9,721 9,361 10,020 10,831 11,048
Total securities 209,838 212,030 220,952 228,954 235,367
Loans held for sale 8,998 10,090 12,302 21,363 48,342
Federal funds sold and
securities purchased under
agreements to resell 13,533 17,032 18,154 17,162 16,373
Trading account assets 14,153 11,822 10,271 15,785 15,620
Margin receivables 6,783 8,160 8,754 9,289 9,610
Time deposits in other banks 616 344 515 649 1,179
Total interest income 1,782,804 1,934,168 2,013,120 2,027,480 2,099,895
Interest expense on:
Deposits 503,190 625,600 673,585 677,239 687,459
Short-term borrowings 113,008 107,077 115,092 116,637 120,661
Long-term borrowings 149,126 157,279 144,662 128,269 122,737
Total interest expense 765,324 889,956 933,339 922,145 930,857
Net interest income 1,017,480 1,044,212 1,079,781 1,105,335 1,169,038
Provision for loan losses 181,000 358,000 90,000 60,000 47,000
Net interest income after
provision for loan losses 836,480 686,212 989,781 1,045,335 1,122,038
Non-interest income:
Service charges on deposit
accounts 271,613 292,709 288,296 297,638 284,097
Brokerage and investment banking 229,203 227,808 209,413 207,372 186,195
Trust department income 56,938 60,798 62,449 64,590 63,482
Mortgage income 45,620 28,047 29,806 40,830 37,021
Securities gains (losses), net 91,643 (45) 23,994 (32,806) 304
Other 213,286 123,661 115,186 119,177 125,813
Total non-interest income 908,303 732,978 729,144 696,801 696,912
Non-interest expense:
Salaries and employee benefits 643,487 678,859 581,425 602,646 608,939
Net occupancy expense 106,665 106,252 120,753 93,175 93,531
Furniture and equipment expense 79,236 80,346 74,127 74,048 72,809
Impairment (recapture) of MSR's 42,000 23,000 20,000 (38,000) 1,000
Other 378,871 459,799 349,089 325,866 332,687
Total non-interest expense (1) 1,250,259 1,348,256 1,145,394 1,057,735 1,108,966
Income before income taxes
from continuing operations 494,524 70,934 573,531 684,401 709,984
Income taxes 157,814 (181) 179,291 230,669 235,908
Income from
continuing operations 336,710 71,115 394,240 453,732 474,076
Loss from discontinued
operations before income taxes (67) (765) (122) (682) (215,818)
Income tax benefit
from discontinued operations (25) (291) (46) (259) (74,723)
Loss from discontinued
operations, net of tax (42) (474) (76) (423) (141,095)
Net income $336,668 $70,641 $394,164 $453,309 $332,981
Weighted-average shares outstanding--
during quarter:
Basic 695,098 695,518 700,589 709,322 726,921
Diluted 695,548 696,895 704,485 715,564 734,534
Actual shares outstanding--
end of quarter (2) 694,721 693,636 697,332 704,398 721,825
Earnings per share from continuing operations (2):
Basic $0.48 $0.10 $0.56 $0.64 $0.65
Diluted $0.48 $0.10 $0.56 $0.63 $0.65
Earnings per share from discontinued operations (2):
Basic $0.00 $0.00 $0.00 $0.00 $(0.19)
Diluted $0.00 $0.00 $0.00 $0.00 $(0.19)
Earnings per share (3):
Basic $0.48 $0.10 $0.56 $0.64 $0.46
Diluted $0.48 $0.10 $0.56 $0.63 $0.45
Cash dividends declared per share (4) $0.38 $0.38 $0.36 $0.36 $0.36
Taxable equivalent net interest income
from continuing operations $1,026,484 $1,050,419 $1,086,575 $1,111,969 $1,175,546
See notes to the Consolidated Statements of Income on page 4
4. FINANCIAL SUPPLEMENT TO
FIRST QUARTER 2008 EARNINGS RELEASE
PAGE 4
(1) Merger-related charges total $75.6 million in 1Q08, $150.2 million in 4Q07, $91.8 million in 3Q07, $59.9 million in 2Q07, and $49.0 million in 1Q07.
See page 17 for additional detail
(2) Certain per share amounts may not appear to reconcile due to rounding
(3) In 4Q07, in addition to the dividend paid, the Board of Directors declared a $0.38 per share dividend payable January 2, 2008
(4) Certain amounts in the prior periods have been reclassified to reflect current period presentation
5. FINANCIAL SUPPLEMENT TO
FIRST QUARTER 2008 EARNINGS RELEASE
PAGE 5
Regions Financial Corporation and Subsidiaries
Consolidated Average Daily Balances and Yield/Rate Analysis Including Discontinued Operations (1)
($ amounts in thousands; yields on taxable-equivalent basis)
Quarter Ended
3/31/08 12/31/07 9/30/07 6/30/07 3/31/07
Average Income/ Yield/ Average Income/ Yield/ Average Income/ Yield/ Average Income/ Yield/ Average Income/ Yield/
Balance Expense Rate Balance Expense Rate Balance Expense Rate Balance Expense Rate Balance Expense Rate
Assets
Interest-earning assets:
Interest-bearing deposits
in other banks $60,505 $616 4.10% $31,039 $344 4.40% $51,740 $515 3.95% $39,767 $649 6.55% $80,520 $1,179 5.94%
Federal funds sold and
securities purchased under
agreement to resell 1,146,251 13,533 4.75% 1,093,155 17,032 6.18% 1,141,666 18,154 6.31% 1,124,636 17,162 6.12% 1,061,976 16,373 6.25%
Trading account assets 1,648,477 14,551 3.55% 1,188,273 12,020 4.01% 1,213,485 10,385 3.40% 1,555,939 15,963 4.12% 1,475,097 15,911 4.37%
Securities:
Taxable 16,565,408 200,117 4.86% 16,407,051 202,669 4.90% 16,545,332 210,932 5.06% 17,245,705 218,123 5.07% 17,748,027 224,319 5.13%
Tax-exempt 727,662 14,863 8.22% 724,152 14,300 7.83% 722,663 15,235 8.36% 737,522 16,430 8.94% 763,297 16,786 8.92%
Loans held for sale 620,722 8,998 5.83% 663,284 10,089 6.03% 779,918 12,303 6.26% 1,323,479 21,363 6.47% 3,427,285 67,196 7.95%
Loans held for sale-divestitures - - - - - - - - - - - - 1,150,548 21,520 7.59%
Margin receivables 582,299 6,783 4.68% 541,915 8,160 5.97% 521,497 8,754 6.66% 532,037 9,289 7.00% 554,896 9,610 7.02%
Loans, net of unearned
income 95,718,586 1,532,347 6.44% 94,783,954 1,675,761 7.01% 94,309,811 1,743,636 7.34% 94,051,511 1,735,135 7.40% 94,338,760 1,745,475 7.50%
Total interest-earning assets 117,069,910 $1,791,808 6.16% 115,432,823 $1,940,375 6.67% 115,286,112 $2,019,914 6.95% 116,610,596 $2,034,114 7.00% 120,600,406 $2,118,369 7.12%
Allowance for loan losses (1,332,583) (1,070,916) (1,062,432) (1,056,832) (1,061,769)
Cash and due from banks 2,746,249 2,831,323 2,751,656 2,803,967 3,010,446
Other assets 23,391,604 21,511,015 19,901,093 19,180,861 19,414,608
$141,875,180 $138,704,245 $136,876,429 $137,538,592 $141,963,691
Liabilities and Stockholders' Equity
Interest-bearing liabilities:
Savings accounts $3,699,304 $1,268 0.14% $3,669,700 $2,236 0.24% $3,756,311 $2,795 0.30% $3,861,380 $2,884 0.30% $3,905,299 $2,964 0.31%
Interest-bearing transaction
accounts 15,620,128 46,525 1.20% 15,029,192 64,376 1.70% 15,268,807 79,618 2.07% 15,816,958 84,334 2.14% 16,113,504 83,343 2.10%
Money market accounts 18,801,773 96,719 2.07% 19,290,437 140,577 2.89% 19,883,326 169,606 3.38% 19,739,594 165,360 3.36% 18,899,250 153,647 3.30%
Time deposits 29,573,584 315,860 4.30% 28,588,955 324,892 4.51% 28,713,151 331,619 4.58% 30,499,907 349,053 4.59% 31,696,531 346,528 4.43%
Foreign deposits 6,005,430 42,818 2.87% 9,212,655 93,519 4.03% 7,466,762 89,947 4.78% 6,432,408 75,608 4.71% 7,589,734 88,886 4.75%
Interest-bearing deposits -
divestitures - - - - - - - - - - - - 1,517,504 12,091 3.23%
Total interest-bearing deposits 73,700,219 503,190 2.75% 75,790,939 625,600 3.27% 75,088,357 673,585 3.56% 76,350,247 677,239 3.56% 79,721,822 687,459 3.50%
Federal funds purchased and
securities sold under agree-
ment to repurchase 8,753,109 67,940 3.12% 8,557,902 92,310 4.28% 8,121,636 98,522 4.81% 7,461,579 90,460 4.86% 8,174,934 96,303 4.78%
Other short-term borrowings 5,389,754 45,068 3.36% 1,554,759 14,767 3.77% 1,598,989 16,570 4.11% 2,251,296 26,177 4.66% 2,213,107 24,358 4.46%
Long-term borrowings 11,653,966 149,126 5.15% 11,054,567 157,279 5.64% 10,085,073 144,662 5.69% 9,014,112 128,269 5.71% 8,606,381 122,737 5.78%
Total interest-bearing
liabilities 99,497,048 $765,324 3.09% 96,958,167 $889,956 3.64% 94,894,055 $933,339 3.90% 95,077,234 $922,145 3.89% 98,716,244 $930,857 3.82%
Net interest spread 3.07% 3.03% 3.05% 3.11% 3.30%
Non-interest-bearing deposits 17,602,501 18,249,585 18,850,607 19,233,146 19,694,403
Other liabilities 4,931,717 3,627,697 3,338,644 3,187,936 3,100,313
Stockholders' equity 19,843,914 19,868,796 19,793,123 20,040,276 20,452,731
$141,875,180 $138,704,245 $136,876,429 $137,538,592 $141,963,691
Net interest income/margin FTE basis $1,026,484 3.53% $1,050,419 3.61% $1,086,575 3.74% $1,111,969 3.82% $1,187,512 3.99%
(1) Certain amounts in prior periods have been reclassified to reflect current period presentation
6. FINANCIAL SUPPLEMENT TO
FIRST QUARTER 2008 EARNINGS RELEASE
PAGE 6
Regions Financial Corporation and Subsidiaries
Selected Ratios
As of and for Quarter Ended
3/31/08 12/31/07 9/30/07 6/30/07 3/31/07
Return on average assets* 0.95% 0.20% 1.14% 1.32% 0.95%
Return on average equity* 6.82% 1.41% 7.90% 9.07% 6.60%
Return on average tangible equity* 17.84% 3.67% 20.14% 22.89% 16.29%
Stockholders' equity per share $28.82 $28.58 $28.46 $27.96 $28.14
Stockholders' equity to total assets 13.88% 14.05% 14.36% 14.31% 14.71%
Tangible stockholders' equity to tangible assets 5.90% 5.88% 6.02% 6.09% 6.52%
Allowance for credit losses as a percentage of loans, net of
unearned income (1) 1.49% 1.45% 1.19% 1.19% 1.18%
Allowance for loan losses as a percentage of loans, net of
unearned income 1.43% 1.39% 1.13% 1.13% 1.12%
Net interest margin (FTE) 3.53% 3.61% 3.74% 3.82% 3.99%
Loans, net of unearned income, to total deposits 108.07% 100.64% 101.00% 98.90% 98.77%
Net charge-offs as a percentage of average loans* 0.53% 0.45% 0.27% 0.23% 0.20%
Total non-performing assets (excluding loans 90 days past due)
as a percentage of loans and other real estate 1.25% 0.90% 0.62% 0.62% 0.45%
Total non-performing assets (including loans 90 days past due)
as a percentage of loans and other real estate 1.73% 1.28% 0.97% 0.84% 0.67%
*Annualized
(1) The allowance for credit losses reflects the allowance related to both loans on the balance sheet and exposure related to unfunded commitments
and standby letters of credit
7. FINANCIAL SUPPLEMENT TO
FIRST QUARTER 2008 EARNINGS RELEASE
PAGE 7
Loans (1)
Loan Portfolio - Period End Data
($ amounts in thousands) 3/31/08 3/31/08
3/31/08 12/31/07 9/30/07 6/30/07 3/31/07 vs. 12/31/07* vs. 3/31/07
Commercial $ 21,721,738 $ 20,906,617 $ 23,565,882 $ 25,123,355 $ 24,188,205 $ 815,121 15.7% $ (2,466,467) -10.20%
Real estate- mortgage 40,553,066 39,343,128 35,337,366 33,646,480 34,505,573 1,209,938 12.4% 6,047,493 17.5%
Real estate- construction 12,866,630 14,025,491 14,237,083 14,311,192 14,357,801 (1,158,861) -33.2% (1,491,171) -10.4%
Home equity lending 15,034,850 14,962,007 14,835,319 14,819,443 14,845,348 72,843 2.0% 189,502 1.3%
Indirect lending 3,961,782 3,938,113 4,015,142 4,052,637 4,050,317 23,669 2.4% (88,535) -2.2%
Other consumer 2,247,365 2,203,491 2,382,840 2,061,381 2,221,016 43,874 8.0% 26,349 1.2%
$ 96,385,431 $ 95,378,847 $ 94,373,632 $ 94,014,488 $ 94,168,260 $ 1,006,584 4.2% $ 2,217,171 2.4%
Loan Portfolio - Average Balances
($ amounts in thousands) 1Q08 1Q08
1Q08 4Q07 3Q07 2Q07 1Q07 vs. 4Q07* vs. 1Q07
Commercial $ 21,155,898 $ 22,913,251 $ 24,146,621 $ 24,623,331 $ 24,094,090 $ (1,757,353) -30.8% $ (2,938,192) -12.2%
Real estate- mortgage 40,114,982 36,660,193 34,923,454 34,060,372 34,922,144 3,454,789 37.9% 5,192,838 14.9%
Real estate- construction 13,154,924 14,104,126 14,232,360 14,295,420 14,221,432 (949,202) -27.1% (1,066,508) -7.5%
Home equity lending 14,997,750 14,888,685 14,774,085 14,836,871 14,858,209 109,065 2.9% 139,541 0.9%
Indirect lending 3,954,999 3,975,744 4,044,072 4,059,108 4,007,349 (20,745) -2.1% (52,350) -1.3%
Other consumer 2,340,033 2,241,955 2,189,219 2,176,409 2,235,536 98,078 17.6% 104,497 4.7%
$ 95,718,586 $ 94,783,954 $ 94,309,811 $ 94,051,511 $ 94,338,760 $ 934,632 4.0% $ 1,379,826 1.5%
(1) Certain amounts in the prior periods have been reclassified to reflect current period presentation
* Linked quarter percentage changes are presented on an annualized basis
• 1Q08 loan classifications reflect an approximate $722 million reclassification of balances from real
estate-construction to real estate-mortgage, effective 1/1/08
• 4Q07 and 3Q07 loan classifications were impacted by conversion-related re-mapping
8. FINANCIAL SUPPLEMENT TO
FIRST QUARTER 2008 EARNINGS RELEASE
PAGE 8
Deposits (1)
Deposit Portfolio - Period End Data
($ amounts in thousands) 3/31/08 3/31/08
3/31/08 12/31/07 9/30/07 6/30/07 3/31/07 vs. 12/31/07* vs. 3/31/07
Interest-Free Deposits $ 18,182,582 $ 18,417,266 $ 18,834,856 $ 19,136,419 $ 19,942,928 $ (234,684) -5.1% $ (1,760,346) -8.8%
Interest-Bearing Checking 15,603,984 15,846,139 15,208,224 15,685,340 16,426,436 (242,155) -6.1% (822,452) -5.0%
Savings 3,792,550 3,646,632 3,692,087 3,795,701 3,937,346 145,918 16.1% (144,796) -3.7%
Money Market 18,649,389 18,934,309 19,694,280 20,025,759 19,222,697 (284,920) -6.1% (573,308) -3.0%
Money Market - Foreign 3,089,721 3,482,603 3,807,196 3,900,599 3,834,587 (392,882) -45.4% (744,866) -19.4%
Total Low-Cost Deposits 59,318,226 60,326,949 61,236,643 62,543,818 63,363,994 (615,841) -4.1% (4,045,768) -6.4%
Time Deposits 29,463,183 29,298,845 27,744,788 29,572,747 31,266,698 164,338 2.3% (1,803,515) -5.8%
Other Foreign Deposits 406,000 5,149,174 4,458,499 2,939,826 705,956 (4,743,174) -370.5% (299,956) -42.5%
$ 89,187,409 $ 94,774,968 $ 93,439,930 $ 95,056,391 $ 95,336,648 $ (5,587,559) -23.7% $ (6,149,239) -6.5%
Deposit Portfolio - Average Balances
($ amounts in thousands) 1Q08 1Q08
1Q08 4Q07 3Q07 2Q07 1Q07 vs. 4Q07* vs. 1Q07
Interest-Free Deposits $ 17,602,501 $ 18,249,585 $ 18,850,607 $ 19,233,146 $ 19,324,381 $ (647,084) -14.3% $ (1,721,880) -8.9%
Interest-Bearing Checking 15,620,128 15,029,192 15,268,807 15,816,958 16,113,504 590,936 15.8% (493,376) -3.1%
Savings 3,699,304 3,669,700 3,756,311 3,861,380 3,905,299 29,604 3.2% (205,995) -5.3%
Money Market 18,801,773 19,290,437 19,883,326 19,739,594 18,899,250 (488,664) -10.2% (97,477) -0.5%
Money Market - Foreign 3,213,214 3,851,065 3,969,910 3,802,564 3,659,151 (637,851) -66.6% (445,937) -12.2%
Total Low-Cost Deposits
excluding divestitures 58,936,920 60,089,979 61,728,961 62,453,642 61,901,585 (1,153,059) -7.7% (2,964,665) -4.8%
Divestitures - Interest-Free - - - - 370,022 - NM (370,022) NM
Divestitures - Other Low-Cost - - - - 796,266 - NM (796,266) NM
Total Low-Cost Deposits 58,936,920 60,089,979 61,728,961 62,453,642 63,067,873 (1,153,059) -7.7% (4,130,953) -6.6%
Time Deposits 29,573,584 28,588,955 28,713,151 30,499,907 31,696,531 984,629 13.9% (2,122,947) -6.7%
Other Foreign Deposits 2,792,216 5,361,590 3,496,852 2,629,844 3,930,583 (2,569,374) -192.7% (1,138,367) -29.0%
Divestitures - Time - - - - 721,238 - NM (721,238) NM
$ 91,302,720 $ 94,040,524 $ 93,938,964 $ 95,583,393 $ 99,416,225 $ (3,890,863) -16.6% $ (8,113,505) -8.2%
(1) Certain amounts in the prior periods have been reclassified to reflect current period presentation
* Linked quarter percentage changes are presented on an annualized basis
• Regions uses foreign deposits as a source of short-term funding. As an alternative to these funds, in 1Q08, the Company
used short-term borrowings, which are not classified as deposits, for much of its short-term funding needs
9. FINANCIAL SUPPLEMENT TO
FIRST QUARTER 2008 EARNINGS RELEASE
PAGE 9
Operating Revenue from Continuing Operations (1)
Revenue
1Q08 1Q08
($ amounts in thousands) 1Q08 4Q07 3Q07 2Q07 1Q07 vs. 4Q07* vs. 1Q07
Net Interest Income (TE basis) $ 1,026,484 $ 1,050,419 $ 1,086,575 $ 1,111,969 $ 1,175,546 $ (23,935) -9.2% $ (149,062) -12.7%
Non-Interest Income (excl. sec. gains/
losses) 816,660 733,023 705,150 729,607 696,608 83,637 45.9% 120,052 17.2%
Total Revenue (excl. sec. gains/losses,
TE basis) $ 1,843,144 $ 1,783,442 $ 1,791,725 $ 1,841,576 $ 1,872,154 $ 59,702 13.5% $ (29,010) -1.5%
(1) Certain amounts in the prior periods have been reclassified to reflect current period presentation
* Linked quarter percentage changes are presented on an annualized basis
• Net interest margin of 3.53% in 1Q08 compared to 3.61% in 4Q07
• Regions' balance sheet positioning is moderately asset sensitive as of March 31, 2008
• Fee income, excluding securities gains/losses, increased linked quarter, due in large part to the Visa IPO gain, higher
insurance income and commercial credit fee income
10. FINANCIAL SUPPLEMENT TO
FIRST QUARTER 2008 EARNINGS RELEASE
PAGE 10
Non-Interest Income and Expense from Continuing Operations (1)
Non-interest Income and Expense
Non-interest Income
1Q08 1Q08
($ amounts in thousands) 1Q08 4Q07 3Q07 2Q07 1Q07 vs. 4Q07* vs. 1Q07
Service charges on deposit accounts $ 271,613 $ 292,709 $ 288,296 $ 297,638 $ 284,097 $ (21,096) -29.0% $ (12,484) -4.4%
Brokerage and investment banking 229,203 227,808 209,413 207,372 186,195 1,395 2.5% 43,008 23.1%
Trust department income 56,938 60,798 62,449 64,590 63,482 (3,860) -25.5% (6,544) -10.3%
Mortgage income 45,620 28,047 29,806 40,830 37,021 17,573 252.0% 8,599 23.2%
Securities gains (losses), net 91,643 (45) 23,994 (32,806) 304 91,688 NM 91,339 NM
Commercial credit fee income 54,300 35,568 29,217 18,971 20,574 18,732 211.8% 33,726 163.9%
Insurance income 30,899 23,320 23,340 25,476 27,229 7,579 130.7% 3,670 13.5%
Other 128,087 64,773 62,629 74,730 78,010 63,314 393.1% 50,077 64.2%
Total non-interest income $ 908,303 $ 732,978 $ 729,144 $ 696,801 $ 696,912 $ 175,325 96.2% $ 211,391 30.3%
Non-interest Expense**
1Q08 1Q08
($ amounts in thousands) 1Q08 4Q07 3Q07 2Q07 1Q07 vs. 4Q07* vs. 1Q07
Salaries and employee benefits $ 581,398 $ 581,635 $ 566,614 $ 579,599 $ 585,408 $ (237) -0.2% $ (4,010) -0.7%
Net occupancy expense 105,266 102,361 99,325 88,490 89,701 2,905 11.4% 15,565 17.4%
Furniture and equipment expense 79,380 78,669 72,185 73,056 72,564 711 3.6% 6,816 9.4%
Impairment (recapture) of MSR's 42,000 23,000 20,000 (38,000) 1,000 19,000 332.3% 41,000 NM
Loss on early extinguishment of debt 65,405 - - - - 65,405 NM 65,405 NM
Professional fees 32,395 43,212 27,533 29,568 17,105 (10,817) -100.7% 15,290 89.4%
Marketing expense 20,784 29,062 20,756 19,624 21,711 (8,278) -114.6% (927) -4.3%
Amortization of core deposit intangible 35,045 42,100 37,432 32,702 43,112 (7,055) -67.4% (8,067) -18.7%
Amortization of MSR's 24,292 21,183 17,308 20,384 20,042 3,109 59.0% 4,250 21.2%
Other 188,696 276,872 192,456 192,385 209,330 (88,176) -128.1% (20,634) -9.9%
Total non-interest expense, excluding
merger charges 1,174,661 1,198,094 1,053,609 997,808 1,059,973 (23,433) -7.9% 114,688 10.8%
Merger-related charges 75,598 150,162 91,785 59,927 48,993 (74,564) -199.7% 26,605 54.3%
Total non-interest expense $ 1,250,259 $ 1,348,256 $ 1,145,394 $ 1,057,735 $ 1,108,966 $ (97,997) -29.2% $ 141,293 12.7%
(1) Certain amounts in prior periods have been reclassified to reflect current period presentation
* Linked quarter percentage changes are presented on an annualized basis
* * Individual expense categories are presented excluding merger-related charges, which are presented in a separate line item in the above table
• Service charges down, reflecting seasonality and an increase in waivers due to 4Q07 conversion events
• Brokerage income increased 23 percent over the same quarter last year reflecting strong fixed income and equity
capital markets revenue
• Trust income declined due to lower overall asset valuations in 1Q08
• Commercial credit fee income increased $18.7 million in 1Q08 due to customers executing derivative
transactions in order to manage their interest rate volatility
• Mortgage income was positively impacted by a 1Q08 adjustment related to FAS 159 adoption for mortgage loans held for
sale; 4Q07 mortgage income reflected a $4.4 million loss on a sale of a portion of out-of-market mortgage servicing portfolio
• 1Q08 insurance income increased $7.6 million, reflecting Regions' recent purchase of Barksdale Bonding &
Insurance in January 2008 and seasonal increases
• Securities were sold at a $91.6 million gain during 1Q08
• 1Q08 other non-interest income is up linked-quarter due primarily to the $62.8 million gain on the redemption
of Visa shares
• 1Q08 expenses include a $65.4 charge for early extinguishment of debt related to the redemption of subordinated notes
• 1Q08 other non-interest expense includes $24.5 million in additional losses on two Morgan Keegan investments. Also
included is a 28.4 million Visa litigation expense reduction related to Visa's IPO
• 1Q08 other non-interest expense also includes an $11.4 million annual first quarter subsidiary dividend payment
• 4Q07 marketing expense included cost related to campaigns run to coincide with the branch conversions
• Professional fees increased in 4Q07 due to special assets litigation resulting from credit cycle deterioration and
higher legal costs
• 4Q07 other non-interest expense includes the $51.5 million charge related to Regions' ownership interest in the Visa
antitrust lawsuit settlements and other related litigation; $38.5 million loss related to two Morgan Keegan mutual
fund investments; and $7.5 million in Other Real Estate losses. Lowering non-interest expense in 4Q07 was a
$10.3 million change in expense related to an investment in energy-related tax credits
• Merger-related cost saves of $127 million, $108 million, $102 million, $84 million and $51 million are reflected in 1Q08,
4Q07, 3Q07, 2Q07 and 1Q07 non-interest expense, respectively
11. FINANCIAL SUPPLEMENT TO
FIRST QUARTER 2008 EARNINGS RELEASE
PAGE 11
Morgan Keegan
Morgan Keegan
Summary Income Statement (excluding merger-related charges)
1Q08 1Q08
($ amounts in thousands) 1Q08 4Q07 3Q07 2Q07 1Q07 vs. 4Q07* vs. 1Q07
Revenues:
Commissions $ 67,801 $ 82,502 $ 82,071 $ 77,563 $ 72,405 $ (14,701) -71.7% $ (4,604) -6.4%
Principal transactions 70,045 56,216 43,916 43,838 37,597 13,829 98.9% 32,448 86.3%
Investment banking 55,010 57,192 48,958 48,579 36,750 (2,182) -15.3% 18,260 49.7%
Interest 29,454 33,772 35,388 39,820 40,031 (4,318) -51.4% (10,577) -26.4%
Trust fees and services 54,085 56,736 55,803 57,185 56,121 (2,651) -18.8% (2,036) -3.6%
Investment advisory 52,049 52,168 42,146 48,088 41,792 (119) -0.9% 10,257 24.5%
Other 10,423 12,357 10,134 13,761 17,303 (1,934) -62.9% (6,880) -39.8%
Total revenues 338,867 350,943 318,416 328,834 301,999 (12,076) -13.8% 36,868 12.2%
Expenses:
Interest expense 15,470 19,790 21,790 25,046 23,983 (4,320) -87.8% (8,513) -35.5%
Non-interest expense 274,355 291,022 225,469 225,074 206,108 (16,667) -23.0% 68,247 33.1%
Total expenses 289,825 310,812 247,259 250,120 230,091 (20,987) -27.2% 59,734 26.0%
Income before income taxes 49,042 40,131 71,157 78,714 71,908 8,911 89.3% (22,866) -31.8%
Income taxes 18,069 15,068 26,000 28,603 26,367 3,001 80.1% (8,298) -31.5%
Net income1 $ 30,973 $ 25,063 $ 45,157 $ 50,111 $ 45,541 $ 5,910 94.8% $ (14,568) -32.0%
1
1Q08 net income does not include merger-related charges of $17.2 million pre-tax, or $11.0 million after-tax. Net income is $20.0 million including the merger-related charges for the quarter
Breakout of Revenue by Division
Fixed-
income Equity Regions
Private Capital Capital MK Asset Interest
($ amounts in thousands) Client Markets Markets Trust Management & Other
Three months ended
March 31, 2008:
$ amount of revenue $ 78,808 $ 89,452 $ 47,313 $ 54,081 $ 41,778 $ 27,435
% of gross revenue 23.3% 26.4% 14.0% 16.0% 12.3% 8.0%
Three months ended
December 31, 2007:
$ amount of revenue $ 99,005 $ 79,544 $ 29,940 $ 56,743 $ 50,066 $ 35,645
% of gross revenue 28.2% 22.7% 8.5% 16.2% 14.3% 10.1%
Three months ended
March 31, 2007
$ amount of revenue $ 96,072 $ 47,556 $ 17,891 $ 56,122 $ 44,474 $ 39,884
% of gross revenue 31.8% 15.8% 5.9% 18.6% 14.7% 13.2%
* Linked quarter percentage changes are presented on an annualized basis
• Principal transactions revenue increased $13.8 million linked quarter, driven by an increase in fixed income
activity as customers migrate to more traditionally stable products
• Commissions revenue was down $14.7 million in 1Q08 primarily due to the current unfavorable market conditions in
traditional equity and retail sectors
• Private Client revenue was down 1Q08 compared to 4Q07 as a result of lower demand for traditional retail product sales
due primarily to current market uncertainty
• Equity Capital Markets revenues were up 1Q08 resulting from increased oil and gas activity along with strong
investment banking business
• Asset Management declined $8.3 million during 1Q08 due to lower asset valuations
• Non-interest expense includes $24.5 million and $38.5 million for 1Q08 and 4Q07, respectively, in losses related to
investments in two Morgan Keegan mutual funds
• 21,400 new accounts were opened in 1Q08 compared to 21,300 in 4Q07 and 25,000 in 1Q07
• Total customer assets were $76.3 billion at March 31, 2008, compared to $80.0 billion at December
31, 2007 and $77.9 billion at March 31, 2007
12. FINANCIAL SUPPLEMENT TO
FIRST QUARTER 2008 EARNINGS RELEASE
PAGE 12
Credit Quality (1)
Credit Quality
As of and for Quarter Ended YTD
($ in thousands) 3/31/08 12/31/07 9/30/07 6/30/07 3/31/07 3/31/08 3/31/07
Allowance for credit losses (ACL) $ 1,432,271 $ 1,379,498 $ 1,126,554 $ 1,118,229 $ 1,110,324 $ 1,432,271 $ 1,110,324
Provision for loan losses from
continuing operations $ 181,000 $ 358,000 $ 90,000 $ 60,000 $ 47,000 $ 181,000 $ 47,000
Provision for unfunded credit losses $ (2,469) $ 2,416 $ (518) $ 2,292 $ 2,229 $ (2,469) $ 2,229
Net loans charged-off:*
Commercial $ 49,570 $ 34,742 $ 19,161 $ 17,406 $ 2,044 $ 49,570 $ 2,044
Real estate - mortgage 20,497 20,409 6,392 11,432 11,108 20,497 11,108
Real estate - construction 13,138 16,036 5,230 709 8,572 13,138 8,572
Home equity lending 21,072 11,513 11,701 8,774 8,686 21,072 8,686
Indirect lending 8,381 7,752 4,395 3,975 4,416 8,381 4,416
Other consumer 13,100 17,020 16,242 11,611 11,196 13,100 11,196
Total $ 125,758 $ 107,472 $ 63,121 $ 53,907 $ 46,022 $ 125,758 $ 46,022
Net loan charge-offs as a % of
average loans, annualized *
Commercial 0.94% 0.60% 0.31% 0.28% 0.03% 0.94% 0.03%
Real estate - mortgage 0.21% 0.22% 0.07% 0.13% 0.13% 0.21% 0.13%
Real estate - construction 0.40% 0.45% 0.15% 0.02% 0.24% 0.40% 0.24%
Home equity lending 0.57% 0.31% 0.31% 0.24% 0.24% 0.57% 0.24%
Indirect lending 0.85% 0.77% 0.43% 0.39% 0.45% 0.85% 0.45%
Other consumer 2.25% 3.01% 2.94% 2.14% 2.03% 2.25% 2.03%
Total 0.53% 0.45% 0.27% 0.23% 0.20% 0.53% 0.20%
Non-performing assets (NPAs):
Non-accrual loans* $ 1,024,201 $ 743,589 $ 494,693 $ 501,175 $ 349,833
Foreclosed properties 180,228 120,465 93,649 83,834 72,658
Total $ 1,204,429 $ 864,054 $ 588,342 $ 585,009 $ 422,491
Loans past due > 90 days* $ 467,375 $ 356,685 $ 332,116 $ 204,829 $ 204,296
Credit Ratios:
ACL/Loans, net 1.49% 1.45% 1.19% 1.19% 1.18%
ALL/Loans, net 1.43% 1.39% 1.13% 1.13% 1.12%
NPAs (ex. 90+ past due)/loans and
foreclosed properties 1.25% 0.90% 0.62% 0.62% 0.45%
NPAs (inc. 90+ past due)/loans and
foreclosed properties 1.73% 1.28% 0.97% 0.84% 0.67%
* See page 13 for loan portfolio (risk view) breakout
Allowance for Credit Losses
($ amounts in thousands)
Three Months Ended March 31
2008 2007
Balance at beginning of year $1,379,498 $1,107,788
Net loans charged-off (125,758) (46,022)
Allowance allocated to sold loans - (853)
Provision for loan losses, from continuing operations 181,000 47,000
Provision for loan losses, from discontinued operations - 182
Provision for unfunded credit commitments (2,469) 2,229
Balance at end of period $1,432,271 $1,110,324
Components:
Allowance for loan losses 1,376,486 1,056,260
Reserve for unfunded credit commitments 55,785 54,064
Allowance for credit losses $1,432,271 $1,110,324
(1) Certain amounts in prior periods have been reclassified to reflect current period presentation
13. FINANCIAL SUPPLEMENT TO
FIRST QUARTER 2008 EARNINGS RELEASE
PAGE 13
Loan Portfolio - Risk View
Total Loan Portfolio
($ in thousands) Ending Balance % of Total Loans Other Consumer, 1%
1Q08 4Q07 1Q08 4Q07
Direct Lending, 1%
Commercial
$ 17,463,045 $ 16,533,176 18% 17% Commercial and
Commercial and Industrial/Leases
4,543,263 4,436,631 5% 5% Industrial/Leases, 18%
Commercial Real Estate - Owner-Occupied Mortgages
22,006,308 20,969,807 23% 22%
Total Commercial Indirect Lending, 4%
Commercial Real Estate Home Equity Lending, 16% Commercial Real Estate -
9,063,831 8,057,504 9% 8%
CRE - Non-Owner-Occupied Mortgages
Owner-Occupied Mortgages,
11,460,090 12,893,068 12% 14%
Construction^
5%
20,523,921 20,950,572 21% 22%
Total Commercial Real Estate
Business and Community Banking Loans 16,045,530 15,540,443 17% 16%
Residential First Mortgage
CRE - Non-Owner-Occupied
2,743,467 2,830,062 3% 3%
Alt-A
Mortgages, 9%
14,019,883 14,129,484 14% 15%
Residential First Mortgage
16,763,350 16,959,546 17% 18%
Total Residential First Mortgage
Residential First Mortgage,
Consumer
14%
15,034,850 14,962,007 16% 16%
Home Equity Lending
Construction^, 12%
3,961,782 3,938,113 4% 4%
Indirect Lending
Business and Community
974,684 1,066,184 1% 1%
Direct Lending Alt-A, 3% Banking Loans, 17%
1,075,006 992,175 1% 1%
Other Consumer
First Quarter 2008
21,046,322 20,958,479 22% 22%
Total Other Consumer
Total Loans $ 96,385,431 $ 95,378,847 100% 100%
^ 20% owner occupied and 80% non-owner occupied as of 1Q08 and 4Q07
Net Charge-offs, Non-accrual and 90+ Days Past Due Loans
90+ Past Due % of Loans* Non-accrual loans % of Loans* Net Charge-offs % of Loans*
($ in thousands) 1Q08 4Q07 1Q08 4Q07 1Q08 4Q07 1Q08 4Q07 1Q08 4Q07 1Q08 4Q07
Commercial
$ 28,405 $ 5,984 0.16% 0.04% $ 89,412 $ 55,355 0.51% 0.33% $ 27,828 $ 24,784 0.67% 0.49%
Commercial and Industrial/Leases
2,475 1,112 0.05% 0.03% 110,579 105,494 2.43% 2.38% 4,433 2,643 0.40% 0.13%
Commercial Real Estate - Owner-Occupied
30,880 7,096 0.14% 0.03% 199,991 160,849 0.91% 0.77% 32,261 27,427 0.61% 0.39%
Total Commercial
Commercial Real Estate
17,732 7,625 0.20% 0.09% 207,907 148,539 2.29% 1.84% 5,247 9,903 0.24% 0.73%
CRE - Non-Owner-Occupied Mortgages
10,782 18,535 0.09% 0.14% 446,861 304,941 3.90% 2.37% 12,666 16,111 0.44% 0.48%
Construction
28,514 26,160 0.14% 0.12% 654,768 453,480 3.19% 2.16% 17,913 26,014 0.35% 0.55%
Total Commercial Real Estate
Business and Community Banking Loans 19,960 10,638 0.12% 0.07% 100,991 75,930 0.63% 0.49% 23,568 10,313 0.59% 0.39%
Residential First Mortgage
67,275 41,125 2.45% 1.45% 14,271 8,534 0.52% 0.30% 2,106 1,822 0.31% 0.26%
Alt-A
118,654 113,281 0.85% 0.80% 41,750 38,177 0.30% 0.27% 7,356 5,611 0.21% 0.16%
Residential First Mortgage
185,929 154,406 1.11% 0.91% 56,021 46,711 0.33% 0.28% 9,462 7,433 0.23% 0.18%
Total Residential First Mortgage
Consumer
192,836 146,808 1.28% 0.98% 12,428 6,611 0.08% 0.04% 21,072 11,513 0.57% 0.31%
Home Equity Lending
4,233 6,002 0.11% 0.15% 1 8 0.00% 0.00% 8,381 7,752 0.85% 0.77%
Indirect Lending
2,971 2,997 0.30% 0.28% 1 - 0.00% 0.00% 2,361 2,911 0.94% 1.09%
Direct Lending
2,052 2,578 0.19% 0.26% - - 0.00% 0.00% 10,740 14,109 3.74% 5.21%
Other Consumer
202,092 158,385 0.96% 0.76% 12,430 6,619 0.06% 0.03% 42,554 36,285 0.81% 0.69%
Total Other Consumer , ,
Total Loans $ 467,375 $ 356,685 0.48% 0.37% $ 1,024,201 $ 743,589 1.06% 0.78% $ 125,758 $ 107,472 0.53% 0.45%
* Percentage of related loan category outstandings
* 1Q08 loan classifications reflect an approximate $722 million reclassification of balances from real estate - construction to real estate - mortgage, effective 1/1/08 (note that quot;Past due, non-accrual and net charge-off also impacted by reclass)
14. FINANCIAL SUPPLEMENT TO
FIRST QUARTER 2008 EARNINGS RELEASE
PAGE 14
Commercial Real Estate - $20.5 billion
• Portfolio well-diversified by product type
• $6.2 billion residential homebuilder portfolio is a subset of the Commercial Real Estate portfolio with the majority of the residential
homebuilder portfolio found in land and single family sectors
Condo
Land
Multi-Family
6%
• Proactively reducing certain concentrations
24%
13%
• Land balances down $1.2 billion since December 2006
• Condominium balances down $891 million since December 2006
Other
8%
Hotel
Single Family Office
Retail
3%
17% 9%
16%
Industrial
4%
Consumer Real Estate - $31.8 billion
Wgtd Avg. Wgtd Avg. Avg. Loan % in 1st
Total Loan Portfolio Outstandings* LTV FICO Size Lien
Home Equity Lending $ 15,034,850 74% 733 $ 76,946 40%
Residential 1st Mortgage 14,019,883 67% 725 175,149 99%
Residential 1st
Alt-A 2,743,467 72% 711 175,886 100%
Mortgage, 14%
$ 31,798,200 71% 728 $ 122,882 71%
Total Consumer RE Portfolio
Alt-A, 3%
* $ in thousands
Home Equity,
16%
Remaining Total
Loan Portfolio,
67%
15. FINANCIAL SUPPLEMENT TO
FIRST QUARTER 2008 EARNINGS RELEASE
PAGE 15
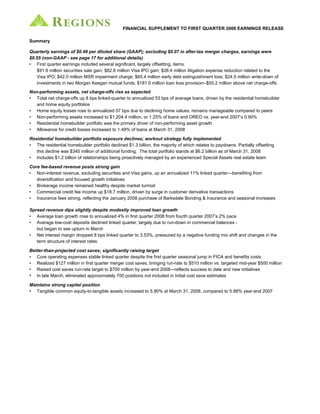
Residential Homebuilder Portfolio - $6.2 billion
Portfolio Breakout by Category Geographic Breakout
($ in millions)
2,400,000
National
1,800,000
($ in thousands)
Homebuilders,
$258
1,200,000
Land, $2,093
Lots, $1,417
600,000
0
Central Florida Midsouth Midwest Southwest Other
$2,153,823 $1,535,909 $1,377,197 $678,468 $337,889 $147,878
Total Outstanding
142,728 138,572 58,102 59,137 8,226 11,466
Non-accruing
2,011,095 1,397,337 1,319,095 619,331 329,663 136,412
Residential Spec, Accruing
Residential
$1,875 Presold, $588
1
Central consists of Alabama, Georgia, and South Carolina
2
Midsouth consists of North Carolina, Virginia and Tennessee
3
Midwest consists of Arkansas, Illinois, Indiana, Iowa, Kentucky, Missouri, and Texas
4
Southwest consists of Louisiana and Mississippi
Product Breakout
($ in thousands)
National
Lots Residential Presold Residential Spec Land Homebuilders Total Portfolio
$ %* $ %* $ %* $ %* $ %* $ %*
2,883 0.17 428 0.07 6,596 0.35 3,764 0.18 102 0.04 13,273 0.21
90+ Past Due
103,294 7.29 33,245 5.65 160,343 8.55 94,319 4.51 27,030 10.47 418,231 6.71
Non-Accruing Loans
Average Note Size:
250 - 416 - 245 - 673 - 521 - 340 -
Total Portfolio
270 - 213 - 214 - 513 - 221 - 270 -
Central
577 - 1,026 - 470 - 2,137 - 5,003 - 907 -
Florida
$ 1,416,909 $ 588,163 $ 1,874,700 $ 2,093,181 $ 258,211 $ 6,231,164
Outstandings
* Percentage of related product outstandings
• Average note size of the homebuilder portfolio is $304,000
• Non-accruing loans represent 6.71 percent of the total homebuilder portfolio with the highest concentrations in the Florida and Central (mainly Atlanta) regions
• 1Q08 net charge-offs (individually exceeding $1 million) in the homebuilder portfolio were $15 million
• At 1Q08 approximately $1.2 billion of the $6.2 billion homebuilder portfolio is being managed within the Special Assets department
16. FINANCIAL SUPPLEMENT TO
FIRST QUARTER 2008 EARNINGS RELEASE
PAGE 16
Additional Financial and Operational Data
3/31/08 12/31/07 9/30/07 6/30/07 3/31/07
Associate headcount 32,143 33,161 33,630 34,293 34,138
Authorized shares remaining under
buyback program (see note below) 23.1MM 23.1MM 27.6MM 34.2MM 53.9 MM
Total branch outlets 1,938 1,965 2,022 2,081 2,088
ATMs 2,464 2,490 2,549 2,581 2,590
Morgan Keegan offices 397 416 430 446 453
Merger-Related Items
(Pre-tax dollars in thousands)
Income Statement Excess Purchase
Effect Price Total
Year ended December 31, 2006 $ 88,658 $ 185,378 $ 274,036
First Quarter 2007 48,993 3,537 52,530
Second Quarter 2007 59,927 4,090 64,017
Third Quarter 2007 91,785 118 91,903
Fourth Quarter 2007 150,162 (10,648) 139,514
First Quarter 2008 75,598 - 75,598
Total $ 515,123 $ 182,475 $ 697,598
17. FINANCIAL SUPPLEMENT TO
FIRST QUARTER 2008 EARNINGS RELEASE
PAGE 17
Reconciliation to GAAP Financial Measures
The table below presents computations of earnings and certain other financial measures excluding discontinued operations and merger charges (non-GAAP). Merger charges and discontinued operations are included in financial
results presented in accordance with generally accepted accounting principles (GAAP). Regions believes the exclusion of merger charges in expressing earnings and certain other financial measures, including quot;earnings per
share from continuing operations, excluding merger chargesquot; and quot;return on average tangible equity, excluding discontinued operations and merger chargesquot;, provides a meaningful base for period-to-period comparisons, which
management believes will assist investors in analyzing the operating results of the Company and predicting future performance. These non-GAAP financial measures are also used by management to assess the performance of
Regions' business, because management does not consider merger charges to be relevant to ongoing operating results. Management and the Board of Directors utilize these non-GAAP financial measures for the following
purposes: Preparation of Regions' operating budgets; calculation of performance-based annual incentive bonuses for certain executives; calculation of performance-based multi-year incentive bonuses for certain executives;
monthly financial performance reporting, including segment reporting; monthly close-out quot;flashquot; reporting of consolidated results (management only); and presentations to investors of company performance. Regions believes
that presenting these non-GAAP financial measures will permit investors to assess the performance of the Company on the same basis as that applied by management and the Board of Directors. Non-GAAP financial
measures have inherent limitations, are not required to be uniformly applied and are not audited. To mitigate these limitations, Regions has policies in place to address expenses that qualify as merger charges and procedures in
place to approve and segregate merger charges from other normal operating expenses to ensure that the Company's operating results are properly reflected for period-to-period comparisons. Although these non-GAAP
financial measures are frequently used by stakeholders in the evaluation of a company, they have limitations as analytical tools, and should not be considered in isolation, or as a substitute for analyses of results as reported
under GAAP. In particular, a measure of earnings that excludes merger charges does not represent the amount that effectively accrues directly to stockholders (i.e., merger charges are a reduction in earnings and stockholders'
equity).
As of and for Quarter Ended
03/31/08 12/31/07 9/30/07 6/30/07 3/31/07
($ amounts in thousands, except per share data)
INCOME
Income from continuing operations (GAAP) $ 336,710 $ 71,115 $ 394,240 $ 453,732 $ 474,076
Loss from discontinued operations, net of tax (42) (474) (76) (423) (141,095)
Net income (GAAP) A $ 336,668 $ 70,641 $ 394,164 $ 453,309 $ 332,981
Income from continuing operations (GAAP) $ 336,710 $ 71,115 $ 394,240 $ 453,732 $ 474,076
Merger-related charges, pre-tax
Salaries and employee benefits 62,089 97,224 14,811 23,047 23,531
Net occupancy expense 1,399 3,891 21,428 4,685 3,830
Furniture and equipment expense (144) 1,677 1,942 992 245
Other 12,254 47,370 53,604 31,203 21,387
Total merger-related charges, pre-tax 75,598 150,162 91,785 59,927 48,993
Merger-related charges, net of tax 46,871 93,505 56,501 37,155 30,376
Income excluding discontinued operations and merger charges (non-GAAP) B $ 383,581 $ 164,620 $ 450,741 $ 490,887 $ 504,452
Weighted-average shares outstanding - diluted C 695,548 696,895 704,485 715,564 734,534
Earnings per share, excluding discontinued operations and merger charges -diluted B/C $ 0.55 $ 0.24 $ 0.64 $ 0.69 $ 0.69
RETURN ON AVERAGE TANGIBLE EQUITY
Average equity (GAAP) D $ 19,843,914 $ 19,868,796 $ 19,793,123 $ 20,040,276 $ 20,452,731
Average intangible assets (GAAP) 12,254,861 12,232,365 12,026,887 12,097,753 12,165,061
Average tangible equity E $ 7,589,053 $ 7,636,431 $ 7,766,236 $ 7,942,523 $ 8,287,670
Average equity, excluding discontinued operations F $ 19,843,914 $ 19,868,796 $ 19,793,123 $ 20,040,276 $ 20,360,732
Average intangible assets, excluding discontinued operations 12,254,861 12,232,365 12,026,887 12,097,753 12,165,061
G $ 7,589,053 $ 7,636,431 $ 7,766,236 $ 7,942,523 $ 8,195,671
Return on average tangible equity* A/E 17.84% 3.67% 20.14% 22.89% 16.29%
Return on average tangible equity, ex. discontinued operations and merger charges (non-GAAP)* B/G 20.33% 8.55% 23.03% 24.79% 24.96%
* Income statement amounts have been annualized in calculation
18. FINANCIAL SUPPLEMENT TO
FIRST QUARTER 2008 EARNINGS RELEASE
PAGE 18
Forward-Looking Statements
This financial supplement to Regions’ first quarter 2008 earnings release may include forward-looking statements about Regions
Financial Corporation within the meaning of the Private Securities Litigation Reform Act of 1995. Statements that are not historical or
current facts, including statements about beliefs and expectations, are forward-looking statements. The words “believe,” “expect,”
“anticipate,” “project,” and similar expressions often signify forward-looking statements. Such statements involve inherent risks and
uncertainties. Regions cautions that actual results and events could differ materially from expectations expressed in forward-looking
statements as a result of factors such as possible changes in economic and business conditions and interest rates; the current
stresses in the financial markets; Regions’ ability to attract and retain customers; the effects of geopolitical instability and risks such as
terrorist attacks; the effects of weather and natural disasters such as droughts and hurricanes; possible changes in laws and
regulations and governmental monetary and fiscal policies; the cost and other effects of legal and administrative cases and similar
contingencies; possible changes in the creditworthiness of customers and the possible impairment of collectibility of loans; increased
competition from both banks and non-banks; and effects of critical accounting policies and judgments. For discussion of these and other
risks that may cause actual results to differ from expectations, please look under the caption “Forward-Looking Statements” in Regions’
Annual Report on Form 10-K for the year ended December 31, 2007 as on file with the Securities and Exchange Commission. You
should not place undue reliance on any forward-looking statements, which speak only as of the date made. Regions assumes no
obligation to update or revise any forward-looking statements that are made from time to time.
Regions’ Investor Relations contact is List Underwood at (205) 801-0265; Regions’ Media contact is Tim Deighton at (205) 264-4551