5. Day 5 Box Plots.notebook March 12, 2013
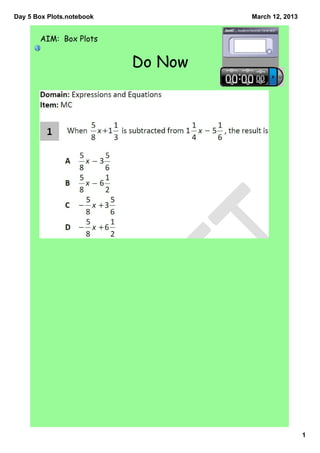
Anticipatory Set
1.) What information is being displayed in the box plot above?
2.) How do you think the Box Plot was created from a set of data?
5
11. Day 5 Box Plots.notebook March 12, 2013
1.) Create a dot plot of the high temperatures below.
10 12 14 16 18 20 22 24 26 28 30 32 34 36 38 40 42 44 46 48 50
11
12. Day 5 Box Plots.notebook March 12, 2013
2.) Create a box plot of the high temperatures below.
10 12 14 16 18 20 22 24 26 28 30 32 34 36 38 40 42 44 46 48 50
12
13. Day 5 Box Plots.notebook March 12, 2013
3.) Find the mean of the high temperatures.
4.) Find the Mean Absolute Deviation of the high temperatures.
13
14. Day 5 Box Plots.notebook March 12, 2013
5.) Create a dot plot of the low temperatures below.
10 12 14 16 18 20 22 24 26 28 30 32 34 36 38 40 42 44 46 48 50
14
15. Day 5 Box Plots.notebook March 12, 2013
SMART Document Camera
6.) Create a box plot of the low temperatures below.
10 12 14 16 18 20 22 24 26 28 30 32 34 36 38 40 42 44 46 48 50
15
16. Day 5 Box Plots.notebook March 12, 2013
7.) Find the mean of the low temperatures.
8.) Find the Mean Absolute Deviation of the low temperatures.
16
17. Day 5 Box Plots.notebook March 12, 2013
Critical Questions:
1.) How is the dot plot and box plot of the high temperature similar?
2.) How is the dot plot and box plot of the high temperature different?
3.) How are the box plots for the high temperature and the low temperature
different?
4.) Which of the data sets, the high temperature data or the low temperature
data, had a greater variation?
5.) How did you determine your answer for question 4?
17