
Recommended
More Related Content
Viewers also liked
Similar to Graphing Unit Rates From Proportional Relationships
Similar to Graphing Unit Rates From Proportional Relationships (8)
More from Erik Tjersland
More from Erik Tjersland (20)
Graphing Unit Rates From Proportional Relationships
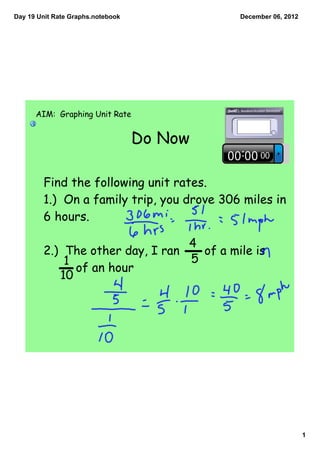
- 1. Day 19 Unit Rate Graphs.notebook December 06, 2012 AIM: Graphing Unit Rate Do Now Find the following unit rates. 1.) On a family trip, you drove 306 miles in 6 hours. 4 2.) The other day, I ran of a mile is 1 5 of an hour 10 1
- 2. Day 19 Unit Rate Graphs.notebook December 06, 2012 2
- 3. Day 19 Unit Rate Graphs.notebook December 06, 2012 3
- 4. Day 19 Unit Rate Graphs.notebook December 06, 2012 Anticipatory Set The following is a graph of the total price, y, for a number of bottles of soda, x. y 10 9 8 Total Price 7 6 5 4 3 2 1 x 0 1 2 3 4 5 6 7 8 9 10 Bottles of Soda 1.) What is the price for one bottle of soda? 2.) What coordinate pair represents the cost of one bottle? 4
- 5. Day 19 Unit Rate Graphs.notebook December 06, 2012 Big Idea In a proportional relationship, the unit rate is located at point (1,r), where r is the unit rate. 5
- 6. Day 19 Unit Rate Graphs.notebook December 06, 2012 1.) A store has two different deals on quarts of paint. One deal is 3 quarts for $21 and the other is 4 quarts for $24. Graph these two points using x as number of quarts and y as price. a.) Connect the points to the origin. b.) What is the better unit rate? c.) How did you determine that? d.) Where is unit rate located on the graph of the lines? y 24 23 22 21 20 19 18 17 16 15 14 13 12 11 10 9 8 7 6 5 4 3 2 1 x 0 1 2 3 4 5 6
- 7. Day 19 Unit Rate Graphs.notebook December 06, 2012 2.) A different store has two deals on quarts of primer. One deal is 3 quarts for $20 and the other is 4 quarts for $27. Graph these two points using x as number of quarts and y as price. a.) Connect the points to the origin. b.) What is the better unit rate? c.) How did you determine that? d.) Where is unit rate located on the graph of the lines? y 30 28 26 24 22 20 18 16 14 12 10 8 6 4 2 x 0 1 2 3 4 5 7
- 8. Day 19 Unit Rate Graphs.notebook December 06, 2012 3.) Two sailboats are competing in the America’s Cup race. One boat travels 155 miles in 5 hours and the other travels 198 miles in 6 hours. Graph these points using x as time and y as distance. a.) Connect the points to the origin. b.) Which boat is going faster? c.) How did you determine that? d.) Where is unit rate located on the graph of the lines? y 200 190 180 170 160 150 140 130 120 110 100 90 80 70 60 50 40 30 20 10 x 0 1 2 3 4 5 6 8
- 9. Day 19 Unit Rate Graphs.notebook December 06, 2012 Illustrative Mathematics 7.RP Buying Coffee Alignment 1: 7.RP.A.2 Coffee costs $18.96 for 3 pounds. a. What is the cost per pound of coffee? b. Let x be the number of pounds of coffee and y be the total cost of x pounds. Draw a graph of the proportional relationship between the number of pounds of coffee and the total cost. c. Where can you see the cost per pound of coffee in the graph? What is it? 9
- 10. Day 19 Unit Rate Graphs.notebook December 06, 2012 y x 10
- 11. Day 19 Unit Rate Graphs.notebook December 06, 2012 Before You Leave Write an equation to represent the Buying Coffee situation. 11
- 12. Day 19 Unit Rate Graphs.notebook December 06, 2012 Homework Homework Sheet 12