SlideShare a Scribd company logo
1 of 12
AIM: Circle Graphs


                     Do Now


                              1
Homework: 1.) Pages 314-315 #5-9 all
           2.) Pages 318-319 #10-15 all, 22, 23


                                                  2
3
Anticipatory Set: Answer the following question in a
complete sentence.


1.) How are circle graphs used in real life? Where have
you seen them used?


                                                          4
FINDING CENTRAL ANGLES OF A CIRCLE GRAPH:
There are 360° in a circle. Use the following proportion to the central
angle of a sector, if the data is given as percents.

        Percent = Central Angle
          100         360


                                                                          5
540
720
1980

360


       6
FINDING CENTRAL ANGLES OF A CIRCLE GRAPH:
There are 360° in a circle. Use the following proportion to the central
angle of a sector, if the data is given as part of a total number.

             Part = Central Angle
              Whole      360


                                                                          7
1620
900
720
360


       8
BEFORE YOU LEAVE
Describe the similarities and differences in the
proportions used today.


    Similarities                Differences


                                                   9
Mr. Tjersland's Math 7


Homework: Page 1, 2, and 3 of Midterm Review Packet 2


                                                        10
AIM: Circle Graphs


FINDING CENTRAL ANGLES OF A CIRCLE GRAPH:
There are 360° in a circle. Use the following proportion to the central
angle of a sector, if the data is given as percents.

        Percent = Central Angle
          100         360


                                                                          11
540
720
1980

360


       12

More Related Content

Viewers also liked

Day 3 laws of exponents mult
Day 3 laws of exponents multDay 3 laws of exponents mult
Day 3 laws of exponents multErik Tjersland
 
Day 5 combining like terms equations
Day 5 combining like terms equationsDay 5 combining like terms equations
Day 5 combining like terms equationsErik Tjersland
 
Day 15 multi step equations
Day 15 multi step equationsDay 15 multi step equations
Day 15 multi step equationsErik Tjersland
 
Day 11 mid unit stations
Day 11 mid unit stationsDay 11 mid unit stations
Day 11 mid unit stationsErik Tjersland
 
Day 2 Graphing Linear Equations
Day 2 Graphing Linear EquationsDay 2 Graphing Linear Equations
Day 2 Graphing Linear EquationsErik Tjersland
 
Day 8 dividing polynomials by monomials
Day 8 dividing polynomials by monomialsDay 8 dividing polynomials by monomials
Day 8 dividing polynomials by monomialsErik Tjersland
 
Day 6 combining like terms equations day 2
Day 6 combining like terms equations day 2Day 6 combining like terms equations day 2
Day 6 combining like terms equations day 2Erik Tjersland
 

Viewers also liked (11)

Day 3 laws of exponents mult
Day 3 laws of exponents multDay 3 laws of exponents mult
Day 3 laws of exponents mult
 
Day 5 combining like terms equations
Day 5 combining like terms equationsDay 5 combining like terms equations
Day 5 combining like terms equations
 
Day 9 shaded region
Day 9 shaded regionDay 9 shaded region
Day 9 shaded region
 
Day 15 multi step equations
Day 15 multi step equationsDay 15 multi step equations
Day 15 multi step equations
 
Day 11 mid unit stations
Day 11 mid unit stationsDay 11 mid unit stations
Day 11 mid unit stations
 
Day 8 scale
Day 8 scaleDay 8 scale
Day 8 scale
 
Day 2 Graphing Linear Equations
Day 2 Graphing Linear EquationsDay 2 Graphing Linear Equations
Day 2 Graphing Linear Equations
 
Module 2 lesson 2
Module 2 lesson 2Module 2 lesson 2
Module 2 lesson 2
 
Day 8 dividing polynomials by monomials
Day 8 dividing polynomials by monomialsDay 8 dividing polynomials by monomials
Day 8 dividing polynomials by monomials
 
Day 6 combining like terms equations day 2
Day 6 combining like terms equations day 2Day 6 combining like terms equations day 2
Day 6 combining like terms equations day 2
 
Polynomial stations
Polynomial stationsPolynomial stations
Polynomial stations
 

More from Erik Tjersland

Linear equations lesson 8 day 2 graphing linear equations
Linear equations lesson 8 day 2 graphing linear equationsLinear equations lesson 8 day 2 graphing linear equations
Linear equations lesson 8 day 2 graphing linear equationsErik Tjersland
 
Linear equations lesson 8 day 1 graphing linear equations
Linear equations lesson 8 day 1 graphing linear equationsLinear equations lesson 8 day 1 graphing linear equations
Linear equations lesson 8 day 1 graphing linear equationsErik Tjersland
 
Linear equations lesson 7 slope formula
Linear equations lesson 7 slope formulaLinear equations lesson 7 slope formula
Linear equations lesson 7 slope formulaErik Tjersland
 
Module 4.5 lesson 10 scale area
Module 4.5 lesson 10 scale areaModule 4.5 lesson 10 scale area
Module 4.5 lesson 10 scale areaErik Tjersland
 
Module 4.5 lesson 9 computing actual lengths
Module 4.5 lesson 9 computing actual lengthsModule 4.5 lesson 9 computing actual lengths
Module 4.5 lesson 9 computing actual lengthsErik Tjersland
 
Linear equations lesson 6 slope
Linear equations lesson 6 slopeLinear equations lesson 6 slope
Linear equations lesson 6 slopeErik Tjersland
 
Module 4.5 lesson 7 scale factor as a percent
Module 4.5 lesson 7 scale factor as a percentModule 4.5 lesson 7 scale factor as a percent
Module 4.5 lesson 7 scale factor as a percentErik Tjersland
 
Module 4.5 lesson 6 scale map
Module 4.5 lesson 6 scale mapModule 4.5 lesson 6 scale map
Module 4.5 lesson 6 scale mapErik Tjersland
 
Linear equations lesson 5 horizontal and vertical lines
Linear equations lesson 5 horizontal and vertical linesLinear equations lesson 5 horizontal and vertical lines
Linear equations lesson 5 horizontal and vertical linesErik Tjersland
 
Module 4.5 lesson 4 scale area problems
Module 4.5 lesson 4 scale area problemsModule 4.5 lesson 4 scale area problems
Module 4.5 lesson 4 scale area problemsErik Tjersland
 
Module 4.5 lesson 3 computing actual lengths from scale drawings
Module 4.5 lesson 3 computing actual lengths from scale drawingsModule 4.5 lesson 3 computing actual lengths from scale drawings
Module 4.5 lesson 3 computing actual lengths from scale drawingsErik Tjersland
 
Module 4.5 lesson 2 unit rate as the scale factor
Module 4.5 lesson 2 unit rate as the scale factorModule 4.5 lesson 2 unit rate as the scale factor
Module 4.5 lesson 2 unit rate as the scale factorErik Tjersland
 
Linear equations lesson 4 graphing linear equations
Linear equations lesson 4 graphing linear equationsLinear equations lesson 4 graphing linear equations
Linear equations lesson 4 graphing linear equationsErik Tjersland
 
Module 4.5 lesson 1 scale drawings
Module 4.5 lesson 1 scale drawingsModule 4.5 lesson 1 scale drawings
Module 4.5 lesson 1 scale drawingsErik Tjersland
 
Review for module 4 exam
Review for module 4 examReview for module 4 exam
Review for module 4 examErik Tjersland
 
Linear equations lesson 3 consecutive integers
Linear equations lesson 3 consecutive integersLinear equations lesson 3 consecutive integers
Linear equations lesson 3 consecutive integersErik Tjersland
 
14 mixed review with percents with answers
14   mixed review with percents with answers14   mixed review with percents with answers
14 mixed review with percents with answersErik Tjersland
 
Module 4 lesson 12 relative error
Module 4 lesson 12 relative errorModule 4 lesson 12 relative error
Module 4 lesson 12 relative errorErik Tjersland
 
Linear equations lesson 2 geometric word problems
Linear equations lesson 2 geometric word problemsLinear equations lesson 2 geometric word problems
Linear equations lesson 2 geometric word problemsErik Tjersland
 

More from Erik Tjersland (20)

Linear equations lesson 8 day 2 graphing linear equations
Linear equations lesson 8 day 2 graphing linear equationsLinear equations lesson 8 day 2 graphing linear equations
Linear equations lesson 8 day 2 graphing linear equations
 
Linear equations lesson 8 day 1 graphing linear equations
Linear equations lesson 8 day 1 graphing linear equationsLinear equations lesson 8 day 1 graphing linear equations
Linear equations lesson 8 day 1 graphing linear equations
 
Linear equations lesson 7 slope formula
Linear equations lesson 7 slope formulaLinear equations lesson 7 slope formula
Linear equations lesson 7 slope formula
 
Module 4.5 lesson 10 scale area
Module 4.5 lesson 10 scale areaModule 4.5 lesson 10 scale area
Module 4.5 lesson 10 scale area
 
Module 4.5 lesson 9 computing actual lengths
Module 4.5 lesson 9 computing actual lengthsModule 4.5 lesson 9 computing actual lengths
Module 4.5 lesson 9 computing actual lengths
 
Linear equations lesson 6 slope
Linear equations lesson 6 slopeLinear equations lesson 6 slope
Linear equations lesson 6 slope
 
Module 4.5 lesson 7 scale factor as a percent
Module 4.5 lesson 7 scale factor as a percentModule 4.5 lesson 7 scale factor as a percent
Module 4.5 lesson 7 scale factor as a percent
 
Module 4.5 lesson 6 scale map
Module 4.5 lesson 6 scale mapModule 4.5 lesson 6 scale map
Module 4.5 lesson 6 scale map
 
Linear equations lesson 5 horizontal and vertical lines
Linear equations lesson 5 horizontal and vertical linesLinear equations lesson 5 horizontal and vertical lines
Linear equations lesson 5 horizontal and vertical lines
 
Module 4.5 lesson 4 scale area problems
Module 4.5 lesson 4 scale area problemsModule 4.5 lesson 4 scale area problems
Module 4.5 lesson 4 scale area problems
 
Module 4.5 lesson 3 computing actual lengths from scale drawings
Module 4.5 lesson 3 computing actual lengths from scale drawingsModule 4.5 lesson 3 computing actual lengths from scale drawings
Module 4.5 lesson 3 computing actual lengths from scale drawings
 
Module 4.5 lesson 2 unit rate as the scale factor
Module 4.5 lesson 2 unit rate as the scale factorModule 4.5 lesson 2 unit rate as the scale factor
Module 4.5 lesson 2 unit rate as the scale factor
 
Linear equations lesson 4 graphing linear equations
Linear equations lesson 4 graphing linear equationsLinear equations lesson 4 graphing linear equations
Linear equations lesson 4 graphing linear equations
 
Module 4.5 lesson 1 scale drawings
Module 4.5 lesson 1 scale drawingsModule 4.5 lesson 1 scale drawings
Module 4.5 lesson 1 scale drawings
 
Review for module 4 exam
Review for module 4 examReview for module 4 exam
Review for module 4 exam
 
Linear equations lesson 3 consecutive integers
Linear equations lesson 3 consecutive integersLinear equations lesson 3 consecutive integers
Linear equations lesson 3 consecutive integers
 
14 mixed review with percents with answers
14   mixed review with percents with answers14   mixed review with percents with answers
14 mixed review with percents with answers
 
Module 4 lesson 13
Module 4 lesson 13Module 4 lesson 13
Module 4 lesson 13
 
Module 4 lesson 12 relative error
Module 4 lesson 12 relative errorModule 4 lesson 12 relative error
Module 4 lesson 12 relative error
 
Linear equations lesson 2 geometric word problems
Linear equations lesson 2 geometric word problemsLinear equations lesson 2 geometric word problems
Linear equations lesson 2 geometric word problems
 

Day 10 circle graph

  • 2. Homework: 1.) Pages 314-315 #5-9 all 2.) Pages 318-319 #10-15 all, 22, 23 2
  • 3. 3
  • 4. Anticipatory Set: Answer the following question in a complete sentence. 1.) How are circle graphs used in real life? Where have you seen them used? 4
  • 5. FINDING CENTRAL ANGLES OF A CIRCLE GRAPH: There are 360° in a circle. Use the following proportion to the central angle of a sector, if the data is given as percents. Percent = Central Angle 100 360 5
  • 7. FINDING CENTRAL ANGLES OF A CIRCLE GRAPH: There are 360° in a circle. Use the following proportion to the central angle of a sector, if the data is given as part of a total number. Part = Central Angle Whole 360 7
  • 9. BEFORE YOU LEAVE Describe the similarities and differences in the proportions used today. Similarities Differences 9
  • 10. Mr. Tjersland's Math 7 Homework: Page 1, 2, and 3 of Midterm Review Packet 2 10
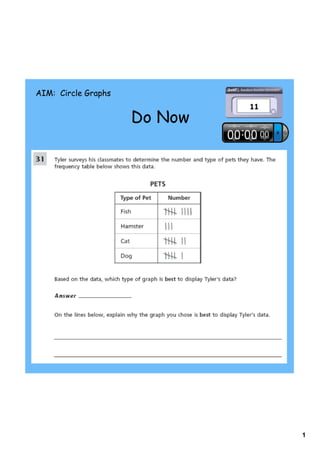
  • 11. AIM: Circle Graphs FINDING CENTRAL ANGLES OF A CIRCLE GRAPH: There are 360° in a circle. Use the following proportion to the central angle of a sector, if the data is given as percents. Percent = Central Angle 100 360 11