Delayed Data Show September Was a Quiet Month for US Inflation
•Download as PPTX, PDF•
14 likes•5,787 views

Various measures of CPI inflation remained near or below the 2 percent inflation target during September

Recommended
Recommended
More Related Content
More from Ed Dolan
More from Ed Dolan (20)
Recently uploaded
Recently uploaded (20)
Delayed Data Show September Was a Quiet Month for US Inflation
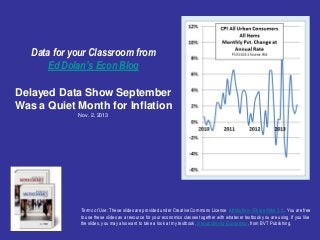
- 1. Data for your Classroom from Ed Dolan’s Econ Blog Delayed Data Show September Was a Quiet Month for Inflation Nov. 2, 2013 Terms of Use: These slides are provided under Creative Commons License Attribution—Share Alike 3.0 . You are free to use these slides as a resource for your economics classes together with whatever textbook you are using. If you like the slides, you may also want to take a look at my textbook, Introduction to Economics, from BVT Publishing.
- 2. Consumer Price Inflation Rises Slightly in September The seasonally adjusted all-items U.S. consumer price index rose at a seasonally adjusted 2.18% annual rate in September. The data was released late due to the government shutdown Almost all of the variability in the CPI since the start of the year has come from energy prices, especially the price of gasoline. Energy prices have a weight of 9.5% in the CPI Posted Nov. 2, 2013 on Ed Dolan’s Econ Blog http://dolanecon.blogspot.com
- 3. Core Inflation Remains Below 2 Percent Food and energy prices are volatile and usually account for much of the month-to-month change in the CPI Their effect can be removed by taking food and energy out of the CPI. The result is called the core inflation rate. The annualized core inflation rate for September was just 1.45 percent Posted Nov. 2, 2013 on Ed Dolan’s Econ Blog http://dolanecon.blogspot.com
- 4. Trimmed Mean Inflation Rises Slightly Another way to remove volatility is the 16% trimmed mean CPI published by the Federal Reserve Bank of Cleveland. It removes the 8% of prices that increase most and the 8% that increase least in each month (or decrease most), whatever they are The 16 percent trimmed mean CPI rose at a 2.21 percent annual rate in September, up slightly from August Posted Nov. 2, 2013 on Ed Dolan’s Econ Blog http://dolanecon.blogspot.com
- 5. Which Measure is Best? The CPI for all items gives the most accurate measure of current changes in the cost of living Economists at the Fed look closely at the core and trimmed mean CPIs, and at other inflation indicators derived from the GDP accounts, to judge the effect of monetary policy on underlying inflationary trends Posted Nov. 2, 2013 on Ed Dolan’s Econ Blog http://dolanecon.blogspot.com
- 6. Year-on-Year Inflation Continues Downward Trend Still another way to remove monthto-month volatility is to look an yearon-year changes in the CPI Year-on-year data also avoid any distortions due to seasonal adjustment This chart shows the change in the CPI from the same month a year earlier The trend of inflation has clearly been downward over the past two years Posted Nov. 2, 2013 on Ed Dolan’s Econ Blog http://dolanecon.blogspot.com
- 7. The Bottom Line The bottom line is that inflation remains quiet, with a downward trend If we take 2 percent as a reasonable target rate of inflation, the latest data give little reason to with draw fiscal or monetary stimulus at this time Posted Nov. 2, 2013 on Ed Dolan’s Econ Blog http://dolanecon.blogspot.com
- 8. For more slideshows, follow Ed Dolan’s Econ Blog Follow @DolanEcon on Twitter Click here to learn more about Ed Dolan’s Econ texts or visit www.bvtpublishing.com