Tmd12112008 Evening Edition
•
0 likes•30 views

The market detective is a Chartered Market Technician (CMT). He uses technical analysis to identify market turning points and opportunities. He is primarily an Elliottician, he uses the Elliott wave principle and Fibonacci ratio analysis to uncover clues about the direction of the market. He uses other forms of technical analysis to corroborate his findings in such a way as to assign a probability factor to them.

Recommended
More Related Content
More from David Waggoner
Recently uploaded
Recently uploaded (20)
Tmd12112008 Evening Edition
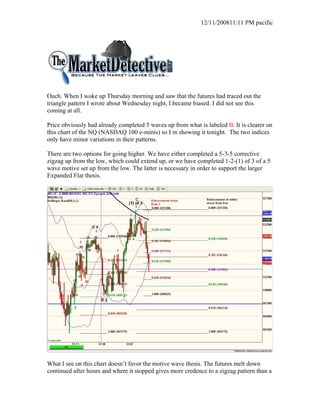
- 1. 12/11/200811:11 PM pacific Ouch. When I woke up Thursday morning and saw that the futures had traced out the triangle pattern I wrote about Wednesday night, I became biased. I did not see this coming at all. Price obviously had already completed 5 waves up from what is labeled B. It is clearer on this chart of the NQ (NASDAQ 100 e-minis) so I m showing it tonight. The two indices only have minor variations in their patterns. There are two options for going higher. We have either completed a 5-3-5 corrective zigzag up from the low, which could extend up, or we have completed 1-2-(1) of 3 of a 5 wave motive set up from the low. The latter is necessary in order to support the larger Expanded Flat thesis. What I see on this chart doesn’t favor the motive wave thesis. The futures melt down continued after hours and where it stopped gives more credence to a zigzag pattern than a
- 2. 12/11/200811:11 PM pacific motive pattern. Looking at the two retracement zones I have labeled, price stopped at a 50% retracement of the entire move off the low. It would have been better for price to stop at one of the retracement levels down from (1) of 3, if this was wave (2) of 3, and a motive wave. The possible good news is that zigzags that become double zigzags are mostly connected together by .500 Fibonacci retracements. Fibonacci .618 retracements are not uncommon, as you can see by the B wave that was a .618 retracement of A. Both options for more upside are still on the table, but the retracement level tagged provides a subtle bias. If it is a zigzag, the question becomes whether we are done or does it extend into a double zigzag. If we start retracing back up, 1194 is the toughest hurdle. That coincides with 874 in the S&P (the not as hard as I thought deck). Continued downside should bounce big or turn at 807 S&P, and 1107 NDX, the .618 level retracements. Beyond that the probability for a turn back up before heading lower fades. However, I cannot identify any good pattern for a move to take out the lows from here. If we get higher, I can, but not from here. I guess that is my weekend project. TMD/DW The market detective provides personal market opinion based on sound technical analysis and research. However, no warranty is given or implied as to its true reliability. The market detective will make errors and mistakes. The market detective is not an investment adviser and is not making recommendations to buy, sell, or place orders relating to the futures contracts, ETFs, or stocks that he writes about. The responsibility for decisions made from information contained in this service are solely that of the individual subscriber. The individual must fully research and make his/her own decisions before acting on any information provided by the market detective. The market detective assumes no responsibility for subscriber investment or trading results.