Download as PDF, PPTX


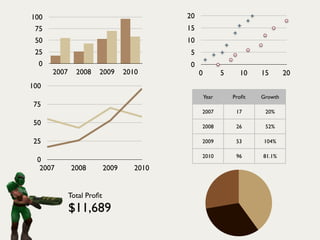
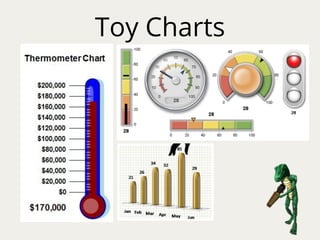
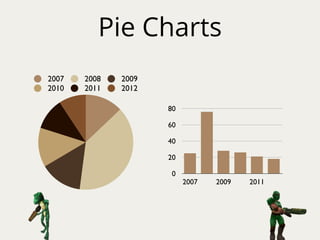

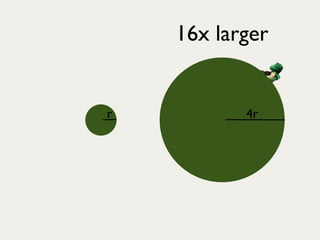
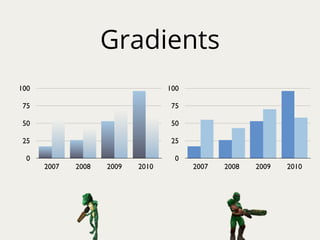

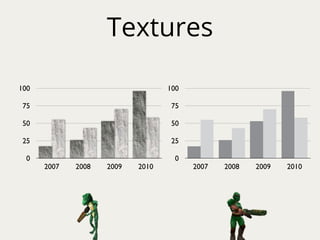
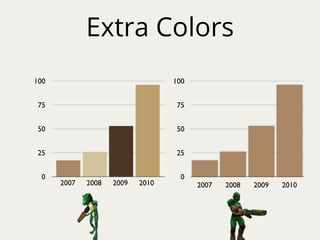
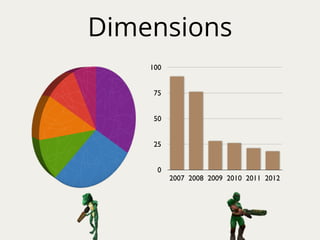
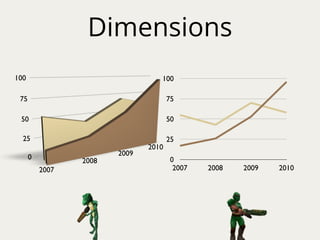

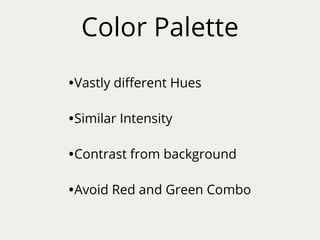
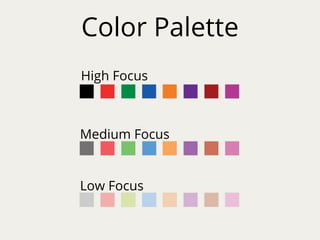
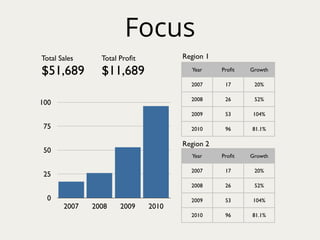

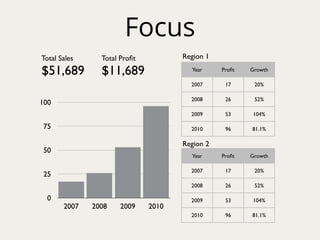
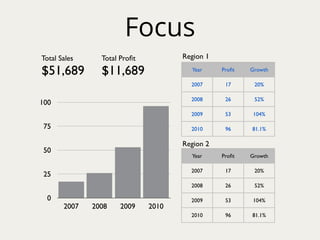


The document provides best practices for charting data, discussing topics such as focusing on clearly showing the data rather than aesthetic features, using consistent color palettes and scales, and prioritizing the most important metrics. It also recommends avoiding unnecessary elements that can distract from the data, like textures, gradients, and extra dimensions. The goal is to design charts that effectively convey the essential information and insights from the data.


