SlideShare a Scribd company logo
1 of 56
Week 5 Project
For each of the 2 majors consider the ‘School Type’ column.
Assuming the requirements are met, construct a 90% confidence
interval for the proportion of the schools that are ‘Private’. Be
sure to interpret your results.
Business
Sample Size
20
Response of Interest
Private
Count for Response
16
Sample Proportion
0.8
Confidence Coefficient
0.9
Z values
1.644853627
Standard Error
0.871779789
Margin error
1.433950147
Point Estimate
0.08
Lower Limit
-1.353950147
Upper Limit
1.513950147
Engineering
Interval Confidence for Proportion
Sample Size
20
Response of Interest
Private
Count for Response
10
Sample Proportion
0.5
Confidence Coefficient
0.9
Z values
1.644854
Standard Error
0.689202
Margin error
1.133637
Point Estimate
0.05
Lower Limit
-1.08364
Upper Limit
1.183637
For each of the 2 majors construct a 95% confidence interval for
the mean of the column ‘Annual % ROI’. Be sure to interpret
your results.
Business
30 Year ROI
Mean
1477800
Standard Error
29727.05661
Median
1441500
Mode
#N/A
Standard Deviation
132943.4387
Sample Variance
17673957895
Kurtosis
1.059973389
Skewness
1.313262635
Range
465000
Minimum
1321000
Maximum
1786000
Sum
29556000
Count
20
Confidence Level (95.0%)
62219.44455
Lower Limit
Upper Limit
Confidence Interval
$1,415,580.56
$1,540,019.44
Engineering
30 Year ROI
Mean
1838000
Standard Error
40204.22
Median
1777500
Mode
#N/A
Standard Deviation
179798.7
Sample Variance
3.23E+10
Kurtosis
4.44257
Skewness
1.811239
Range
744000
Minimum
1668000
Maximum
2412000
Sum
36760000
Count
20
Confidence Level (95.0%)
84148.39
Lower Limit
Upper Limit
Confidence Interval
$1,753,851.61
$1,922,148.39
In this article, Jeffrey J. Williams argues that, contrary to
college standing as an open
thoroughfare for Americans wanting to improve their lives, it
has become a gated toll road
primarily available to those from middle-class and upper-class
families. Williams is a
professor of English and of literary and cultural studies at
Carnegie Mellon University. The
article was originally published in “Inside Higher Ed” in July of
2016.
College and the New Class Divide
by Jeffrey J. Williams
We usually think of college as providing a boost up the class
ladder. That is what it did for a
generation or more of Americans, particularly from the 1950s
through the 1970s. But since
around 1980, college has actually calcified class in America.
That’s one upshot of Tamara Draut’s new book, Sleeping Giant:
How the New Working
Class Will Transform America (Doubleday, 2016). She explains
how the central divide between
the working class and the middle class now is college. Not that
things are entirely rosy for those
with bachelor’s degrees, but those without degrees have
experienced a more severe pinch, with
proportionately shrinking wages, degraded conditions, few job
protections and general
insecurity.
Moreover, contrary to college standing as an open thoroughfare
for Americans wanting to
rise, it has become a gated toll road primarily available to those
from middle-class and upper-
class families. Those who have gone to college beget those who
go to college: if your parents
didn’t go to college, you are much more likely to work at or
near minimum wage. Only about
9 percent of those from the lowest quartile of wealth complete
college degrees, whereas about
three-quarters from the top quartile do.
A key impediment has been the exponential rise of tuition
prices since the 1970s, at
several times the rate of inflation, correlated with the reduction
of public support, which in turn
has brought the steep increase in student debt and student work
hours.
This has produced what Draut called in an earlier essay “The
Growing College Gap,” in
Inequality Matters: The Growing Economic Divide in America
and Its Poisonous Consequences.
We usually think that we have seen great progress if not solved
the problem of racial inequality,
but the enrollment gap between white students and black
students was about 5 percent in 1970,
whereas it had more than doubled, to 11 percent, in 2000.
Similarly, Hispanic students have seen
the gap widen from 5 to 13 percent. Affirmative action gets
headlines, but we have actually gone
backward in attaining racial equality in higher education.
One of Draut’s key insights is that the class divide is not just a
matter of money but also
one of culture. As she remarks, “When once a steelworker and
an accountant could live on the
same block, drive the same car, vacation at the same place and
eat at the same restaurants, over
the course of the 1980s, 1990s and the first decade of the
2000s” those from higher classes have
little substantive contact with those from the working class
except when they ring up their
groceries or take care of their elderly relatives.
That has precipitated a public and political blindness to the new
working class, even
though it constitutes 60 percent of Americans. Rather than a
silent majority, it is an invisible
majority.
The cultural divide has two daunting consequences. Because
those who work in
journalism and other news media come from the upper, college-
degreed cohort—as Draut
adduces, in 1971 only about half of journalists had B.A.s,
whereas 92 percent do now—they
have little direct sense of the working class. Nor is there a
strong interest to represent it in the
main news organs, like The New York Times or The
Washington Post, whose audiences are
largely college educated.
In Draut’s analysis, after the 2008 crash, about half of the news
focused on the banks, a
third on the federal response, a fifth on businesses and only a
smattering on working-class people
who might have lost jobs or their houses. Rather, the Post ran a
feature on a banker getting by on
a reduction of her salary—to $300,000 a year. Hard times
indeed.
Similarly, those who work as congressional staffers come
almost entirely from college
backgrounds. Of high-level staffers, about half “attended
private colleges for their undergraduate
degree, including 10 percent who went to an Ivy League
school.” They are typically the ones
who get the internships inside the D.C. beltway, as well as can
afford to carry the expenses of
internships.
That has effectively shut the working class out of public
representation or political power,
even though it constitutes a majority. For Draut, the key is to
change the narrative, popping what
she calls the “class bubble.” One corrective is simply that we
are not all middle class: most
Americans are working class.
In addition, Sleeping Giant shows that the present working class
no longer fits the iconic
image of the construction worker in hard hat who had a union to
speak for him. Instead, it is
largely female, about half Latino and African-American, usually
nonunionized, and struggling to
make ends meet at or near minimum wage while laboring in
home health care, fast food and
retail, which have gained the bulk of new jobs.
Since college is a key class marker, it’s easy to blame higher
education itself as the
problem. But for Draut the problem lies in the policies that have
drained equal opportunity from
it and segregated it, and in turn she advocates policies to
enhance public higher education,
notably reducing tuition fees and eliminating student debt. [As
Draut has said], “Debt-free
college is now a real idea and part of the political debate.”
That’s one salutary reminder we can
take from Draut: it might be a long road, but good ideas that
seem unrealistic at one moment can
win their day.
In academic scholarship, we typically focus on conceptual
problems, commenting on one
and moving onto the next, and in fact we are continually
looking for what’s new or next. But in
politics, change sometimes seems glacial, and one has to be
dogged. It’s useful to keep in mind
that massive student debt is only a recent development, arising
since the 1980s, and 10 years ago,
the idea of abolishing it or enacting free public higher education
were considered pie-in-the-sky
proposals. But they’re on the agenda now, and we have to keep
working to accrue the data, build
the narratives and devise policies that aim toward more
equality.
This article explores how higher education has come to
reinforce inequality rather than
correcting it. The author, Suzanne Mettler, is a professor of
government at Cornell University
and the author of “Degrees of Inequality: How the Politics of
Higher Education Sabotaged the
American Dream.” This article was originally published in The
New York Times on March 1,
2014.
College, the Great Unleveler
By Suzanne Mettler
When the G.I. Bill of Rights of 1944 made colleges accessible
to veterans regardless of
socioeconomic background, Robert Maynard Hutchins, the
president of the University of
Chicago, worried that it would transform elite institutions into
“educational hobo jungles.” But
the G.I. Bill was only the first of several federal student aid
laws that, along with increasing state
investment in public universities and colleges, transformed
American higher education over the
course of three decades from a bastion of privilege into a path
toward the American dream.
Something else began to happen around 1980. College
graduation rates kept soaring for
the affluent, but for those in the bottom half, a four-year degree
is scarcely more attainable today
than it was in the 1970s. And because some colleges actually
hinder social mobility, what
increasingly matters is not just whether you go to college but
where.
The demise of opportunity through higher education is,
fundamentally, a political failure.
Our landmark higher education policies have ceased to function
effectively, and lawmakers —
consumed by partisan polarization and plutocracy — have
neglected to maintain and update
them.
More Americans than ever enroll in college, but the graduates
who emerge a few years
later indicate that instead of reducing inequality, our system of
higher education reinforces it.
Three out of four adults who grow up in the top quarter of the
income spectrum earn
baccalaureate degrees by age 24, but it’s only one out of three
in the next quarter down. In the
bottom half of the economic distribution, it’s less than one out
of five for those in the third
bracket and fewer than one out of 10 in the poorest.
That’s before we even begin differentiating by type of college.
Higher education is
becoming a caste system, separate and unequal for students with
different family incomes.
Where students attend college affects their chances of
graduating and how indebted they will
become in the process.
Private nonprofits, schools like Stanford or Vassar, list the
highest “sticker prices,” but
the average student pays less than half of full fare. Some
nonprofits provide generous need-based
aid to low- and middle-income students, supplementing their
federal aid. Others devote their
resources instead to merit-based aid, courting students with high
SAT scores, typically from
higher-income backgrounds. These colleges rise in the rankings,
but they also provide a
disadvantage to poorer students who would benefit from more
need-based aid, who struggle
financially to stay enrolled and who take out more student loans
to do so.
Nearly three-quarters of American college students attend
public universities and
colleges, historically the nation’s primary channels to
educational opportunity. These institutions
still offer the best bargain around, yet even there, tuition
increases have bred inequality. For
those from the richest fifth, the annual cost of attending a
public four-year college has inched up
from 6 percent of family income in 1971 to 9 percent in 2011.
For everyone else, the change is
formidable. For those in the poorest fifth, costs at State U have
skyrocketed from 42 percent of
family income to 114 percent.
The worst problems, though, occur at for-profit schools like
those run by the Apollo
Group (which owns the University of Phoenix), the Education
Management Corporation or
Corinthian Colleges. These schools cater to low-income
students and veterans, but too often they
turn hopes for a better life into the despair of financial ruin.
Nearly all of their students take out loans to attend, and the
amounts are staggering.
Among holders of bachelor’s degrees, 94 percent borrow. They
take on median debt of $33,000
per student, compared with just $18,000 at the nonprofits and
$22,000 at the publics. The for-
profit graduates have trouble finding jobs that pay enough to
afford their debts, and 23 percent of
borrowers default within three years, compared with just 7
percent from nonprofits and 8 percent
from publics.
Just when having a highly educated citizenry is more important
than ever, how could we
be failing so miserably at achieving it? It’s not as simple as
politicians’ terminating laws or
gutting funding. Federal student aid has actually increased
considerably since 2007. But
government has abdicated its leadership role.
First, federal student aid has become less effective in promoting
opportunity. In the
1970s, the maximum Pell grants for low-income students
covered nearly 80 percent of costs at
the average four-year public university, but by 2013-14 they
covered just 31 percent. Presidents
beginning with Bill Clinton introduced costly new tax policies
to help with tuition, but these
have failed to improve access for the less well off.
Second, state governments, burdened by the growing cost of
Medicaid, K-12 education
and prisons, let higher education funding dwindle. Spending per
full-time public student fell by
an average of 26 percent in real terms between 1990-91 and
2009-10. Besides raising tuition,
public colleges have had to squeeze resources at the schools
themselves. For poorer students,
graduating becomes all the harder as class sizes grow, online
courses proliferate and support
services are cut.
Third, Congress, by loosening regulations, permitted for-profit
colleges to thrive on the
government’s dime. These schools, which enroll nearly a tenth
of college students, use nearly a
quarter of federal student aid dollars allocated through Title IV
of the Higher Education Act of
1965, and they account for nearly half of all student loan
defaults. A 1998 rule allows them to
gain up to 90 percent of their revenues from Title IV alone — a
figure that does not include their
substantial use of military education money. Even during the
2008 financial downturn, the top
publicly traded for-profits enjoyed growth. Their upper
management and shareholders benefit at
the expense of American taxpayers and students.
Ordinary young Americans who hoped college could be their
route to a better future are
the victims of a perfect storm of political winds. It began with
existing public policies that
required routine maintenance being left to wither. As Nancy
Kassebaum, a former Republican
senator from Kansas, told me, “Public programs, just like any
other programs, need to be
managed.” She remembers when bipartisanship functioned well
enough to do so on higher
education issues.
Now Congress is more polarized than at any point in modern
history, and it’s not just
decisions on nominations and the debt ceiling that suffer. I
examined votes on amendments to
higher education bills and found that between the 1970s and
1995-2008 the partisan split doubled
in the House and quadrupled in the Senate. Such division on
minor adjustments to policies
indicates why Congress has failed to address larger issues.
That’s not the whole story, either. Plutocratic governance
intensifies the dysfunction, as
powerful industries still have the strength to bring politicians
together across the aisle in a parody
of true bipartisanship.
The effect of polarized plutocracy is epitomized by Congress’s
support for the for-profit
colleges. By the late 1990s, Republican leaders championed the
for-profits as the “private
sector,” never mind that 15 of the large publicly traded for-
profits receive on average 86 percent
of their revenues from federal student aid. Plutocracy helped
bring House Democrats onboard, as
the industry wooed them through strategic lobbying and
campaign contributions. The result? In
the House of Representatives, where Democrats and
Republicans agree on almost nothing, they
have united to protect $32 billion taxpayer dollars for the for-
profit college industry.
Most of us were raised to believe that going to college was the
surest path to a better life,
but for many today that belief can be perilous. Unless we can
claw back polarization and
plutocracy enough to restore opportunity in higher education,
the United States will become a
society in which rank is fixed and our ideal of upward mobility
but a memory.
The following article explores the often overlooked benefits of
a higher education. It was
originally published in “The Huffington Post” in 2013, and
draws its conclusions from a
reputable study conducted by the College Board. The author,
Lizzie Wann, is the Content
Director for Bridgepoint Education, overseeing all website
content and working closely with
New Media, Career Services, and Student Services for Ashford
University.
Why Your College Degree Has More Value Than You Think
By Lizzie Wann
We all know about the obvious benefits to having a college
degree — namely, a steady job and
financial security. But we often overlook other benefits to
higher education: quality of life
improvements that deserve to be brought into focus, whether
you’re on the fence about going
back to school or are just having a hard time appreciating the
degree you already have.
Here are just a few of the benefits you should take into account
to start giving college credit
where it’s due, according to the College Board’s newly updated
study “Education Pays: The
Benefits of Higher Education for Individuals and Society.”
Improved Self-Esteem
There’s just something about a college grad that makes her
stand a little bit straighter and
a little bit taller. It likely has to do with the boost to one’s self-
esteem and confidence that comes
with making it through a higher education program.
Studies conducted by the College Board and others like it have
found that those who have
completed additional schooling are not only more well-equipped
to handle mental challenges,
but also report a higher level of satisfaction when doing so.
Since earning a college degree has long been considered a rite
of passage, there’s an extra
http://www.ashford.edu/
http://blog.brazencareerist.com/2011/09/14/how-useful-is-a-
college-degree-these-days/
http://trends.collegeboard.org/education-pays
http://blog.brazencareerist.com/2013/03/14/the-real-secret-to-
career-success-confidence/
sense of accomplishment when you reach the finish line. You’ve
accomplished something that
no one can ever take away from you.
Sure, you can lose the physical piece of paper, and you may
move on from the job your
degree helped you attain, but you’ll never lose the work behind
the journey you undertook to get
your diploma. Even when tough times fall, you know you have
what it takes to start something
and finish it successfully, and that is priceless.
Healthy Choices
In addition to the mental boost that comes with higher
education, college grads are
healthier overall. Higher socioeconomic status (measured by
total family income, level of
education attained and professional career status) is directly
correlated with better physical health
and life expectancy.
This correlation seems obvious when you consider that those
who earn more money have
greater access to health care and healthier food options. But
what you may not have considered is
that higher education means the ability and desire to make
better choices when it comes to habits
— eating and otherwise.
For example, those with extended educations are less likely to
smoke and more likely to
exercise. When you put greater emphasis on taking care of your
mind with additional schooling,
you naturally put greater emphasis on taking care of your body,
too. It’s truly as simple as when
you know better, you do better.
Higher Job Satisfaction
While we’re on the subject of bettering ourselves, one common
reason people seek higher
education is to get out of a dead-end job. Having a degree often
means having an actual career
rather than punching the clock to pay the bills.
That’s all fine and good, you may say, but having a career
means nothing if you can’t
keep it — a task many are finding difficult as of late.
Fortunately, a diploma gives you the upper
hand when it comes to economy-driven layoffs.
Graduates not only have higher job retention rates during a
recession, but also an easier
time finding re-employment due to higher marketability than
their non-graduate colleagues. That
means less stress overall during tough economic times.
Passing on the Legacy
Finally, one of the greatest benefits to having a college
education is passing on the legacy
to your children. Children of a college grad are more likely to
have a better quality of life and
pursue extended education themselves. Those children also have
a much easier time getting into
good schools because their parents have emphasized the
importance of an education to them.
They also tend to have better grades and test scores.
As experts often state, children of college grads — even those
who don’t attend college
themselves — are more motivated to reach for their dreams.
They know that their parents pushed
through adversity to earn their degrees, and they apply that
same philosophy to going after what
they want in life — a bar that is placed that much higher by
having college-educated parents.
Although financial enrichment is one of the main reasons people
choose to pursue higher
education, there are many other benefits to obtaining that
degree. You better yourself through
improved self-confidence and enhanced decision-making ability,
which also betters the lives of
your family members and others around you.
http://blog.brazencareerist.com/2013/01/24/why-english-majors-
dont-have-to-finish-last/
https://www.luminafoundation.org/about_us/president/speeches/
2008-05-08.html
This article was originally published in the January/February
issues of The Atlantic, a very
highly regarded magazine. The author of the article, Bryan
Caplan is an economics professor
at George Mason University and the author of The Case Against
Education.
The World Might Be Better Off Without College for Everyone
by Brian Caplan
I have been in school for more than 40 years. First preschool,
kindergarten, elementary school,
junior high, and high school. Then a bachelor’s degree at UC
Berkeley, followed by a doctoral
program at Princeton. The next step was what you could call my
first “real” job— as an
economics professor at George Mason University.
Thanks to tenure, I have a dream job for life. Personally, I have
no reason to lash out at
our system of higher education. Yet a lifetime of experience,
plus a quarter century of reading
and reflection, has convinced me that it is a big waste of time
and money. When politicians vow
to send more Americans to college, I can’t help gasping, “Why?
You want us to waste even
more?”
How, you may ask, can anyone call higher education wasteful in
an age when its
financial payoff is greater than ever? The earnings premium for
college graduates has rocketed to
73 percent—that is, those with a bachelor’s degree earn, on
average, 73 percent more than those
who have only a high-school diploma, up from about 50 percent
in the late 1970s. The key issue,
however, isn’t whether college pays, but why. The simple,
popular answer is that schools teach
students useful job skills. But this dodges puzzling questions.
First and foremost: From kindergarten on, students spend
thousands of hours studying
subjects irrelevant to the modern labor market. Why do English
classes focus on literature and
poetry instead of business and technical writing? Why do
advanced-math classes bother with
proofs almost no student can follow? When will the typical
student use history? Trigonometry?
Art? Music? Physics? Latin? The class clown who snarks “What
does this have to do with real
life?” is onto something.
The disconnect between college curricula and the job market
has a banal explanation:
Educators teach what they know—and most have as little
firsthand knowledge of the modern
workplace as I do. Yet this merely complicates the puzzle. If
schools aim to boost students’
future income by teaching job skills, why do they entrust
students’ education to people so
detached from the real world? Because, despite the chasm
between what students learn and what
workers do, academic success is a strong signal of worker
productivity.
Suppose your law firm wants a summer associate. A law student
with a doctorate in
philosophy from Stanford applies. What do you infer? The
applicant is probably brilliant,
diligent, and willing to tolerate serious boredom. If you’re
looking for that kind of worker—and
what employer isn’t?—you’ll make an offer, knowing full well
that nothing the philosopher
learned at Stanford will be relevant to this job.
The labor market doesn’t pay you for the useless subjects you
master; it pays you for the
preexisting traits you signal by mastering them. This is not a
fringe idea. Michael Spence,
Kenneth Arrow, and Joseph Stiglitz—all Nobel laureates in
economics—made seminal
contributions to the theory of educational signaling. Every
college student who does the least
work required to get good grades silently endorses the theory.
But signaling plays almost no role
in public discourse or policy making. As a society, we continue
to push ever larger numbers of
students into ever higher levels of education. The main effect is
not better jobs or greater skill
levels, but a credentialist arms race.
Lest I be misinterpreted, I emphatically affirm that education
confers some marketable
skills, namely literacy and numeracy. Nonetheless, I believe
that signaling accounts for at least
half of college’s financial reward, and probably more.
Most of the salary payoff for college comes from crossing the
graduation finish line.
Suppose you drop out after a year. You’ll receive a salary bump
compared with someone who’s
attended no college, but it won’t be anywhere near 25 percent of
the salary premium you’d get
for a four-year degree. Similarly, the premium for sophomore
year is nowhere near 50 percent of
the return on a bachelor’s degree, and the premium for junior
year is nowhere near 75 percent of
that return. Indeed, in the average study, senior year of college
brings more than twice the pay
increase of freshman, sophomore, and junior years combined.
Unless colleges delay job training
until the very end, signaling is practically the only explanation.
This in turn implies a mountain
of wasted resources—time and money that would be better spent
preparing students for the jobs
they’re likely to do.
***
The conventional view—that education pays because students
learn—assumes that the typical
student acquires, and retains, a lot of knowledge. She doesn’t.
Teachers often lament summer
learning loss: Students know less at the end of summer than
they did at the beginning. But
summer learning loss is only a special case of the problem of
fade-out: Human beings have
trouble retaining knowledge they rarely use. Of course, some
college graduates use what they’ve
learned and thus hold on to it—engineers and other quantitative
types, for example, retain a lot of
math. But when we measure what the average college graduate
recalls years later, the results are
discouraging, to say the least.
In 2003, the United States Department of Education gave about
18,000 Americans the
National Assessment of Adult Literacy. The ignorance it
revealed is mind-numbing. Fewer than
a third of college graduates received a composite score of
“proficient”—and about a fifth were at
the “basic” or “below basic” level. You could blame the
difficulty of the questions—until you
read them. Plenty of college graduates couldn’t make sense of a
table explaining how an
employee’s annual health-insurance costs varied with income
and family size, or summarize the
work-experience requirements in a job ad, or even use a
newspaper schedule to find when a
television program ended. Tests of college graduates’
knowledge of history, civics, and science
have had similarly dismal results.
Of course, college students aren’t supposed to just download
facts; they’re supposed to
learn how to think in real life. How do they fare on this count?
The most focused study of
education’s effect on applied reasoning, conducted by Harvard’s
David Perkins in the mid-
1980s, assessed students’ oral responses to questions designed
to measure informal reasoning,
such as “Would a proposed law in Massachusetts requiring a
five-cent deposit on bottles and
cans significantly reduce litter?” The benefit of college seemed
to be zero: Fourth-year students
did no better than first-year students.
Other evidence is equally discouraging. One researcher tested
Arizona State University
students’ ability to “apply statistical and methodological
concepts to reasoning about everyday-
life events.” In the researcher’s words:
Of the several hundred students tested, many of whom had taken
more than six years of
laboratory science … and advanced mathematics through
calculus, almost none
demonstrated even a semblance of acceptable methodological
reasoning.
Those who believe that college is about learning how to learn
should expect students who study
science to absorb the scientific method, then habitually use it to
analyze the world. This scarcely
occurs.
College students do hone some kinds of reasoning that are
specific to their major. One
ambitious study at the University of Michigan tested natural-
science, humanities, and
psychology and other social-science majors on verbal reasoning,
statistical reasoning, and
conditional reasoning during the first semester of their first
year. When the same students were
retested the second semester of their fourth year, each group
had sharply improved in precisely
one area. Psychology and other social-science majors had
become much better at statistical
reasoning. Natural-science and humanities majors had become
much better at conditional
reasoning—analyzing “if … then” and “if and only if”
problems. In the remaining areas,
however, gains after three and a half years of college were
modest or nonexistent. The takeaway:
Psychology students use statistics, so they improve in statistics;
chemistry students rarely
encounter statistics, so they don’t improve in statistics. If all
goes well, students learn what they
study and practice.
Actually, that’s optimistic. Educational psychologists have
discovered that much of our
knowledge is “inert.” Students who excel on exams frequently
fail to apply their knowledge to
the real world. Take physics. As the Harvard psychologist
Howard Gardner writes,
Students who receive honor grades in college-level physics
courses are frequently unable
to solve basic problems and questions encountered in a form
slightly different from that
on which they have been formally instructed and tested.
The same goes for students of biology, mathematics, statistics,
and, I’m embarrassed to say,
economics. I try to teach my students to connect lectures to the
real world and daily life. My
exams are designed to measure comprehension, not
memorization. Yet in a good class, four test-
takers out of 40 demonstrate true economic understanding.
***
Economists’ educational bean counting can come off as
annoyingly narrow. Non-economists—
also known as normal human beings—lean holistic: We can’t
measure education’s social
benefits solely with test scores or salary premiums. Instead we
must ask ourselves what kind of
society we want to live in—an educated one or an ignorant one?
Normal human beings make a solid point: We can and should
investigate education’s
broad social implications. When humanists consider my
calculations of education’s returns, they
assume I’m being a typical cynical economist, oblivious to the
ideals so many educators hold
dear. I am an economist and I am a cynic, but I’m not a typical
cynical economist. I’m a cynical
idealist. I embrace the ideal of transformative education. I
believe wholeheartedly in the life of
the mind. What I’m cynical about is people.
I’m cynical about students. The vast majority are philistines.
I’m cynical about teachers.
The vast majority are uninspiring. I’m cynical about
“deciders”—the school officials who
control what students study. The vast majority think they’ve
done their job as long as students
comply.
Those who search their memory will find noble exceptions to
these sad rules. I have
known plenty of eager students and passionate educators, and a
few wise deciders. Still, my 40
years in the education industry leave no doubt that they are
hopelessly outnumbered. Meritorious
education survives but does not thrive.
Indeed, today’s college students are less willing than those of
previous generations to do
the bare minimum of showing up for class and temporarily
learning whatever’s on the test. Fifty
years ago, college was a full-time job. The typical student spent
40 hours a week in class or
studying. Effort has since collapsed across the board. “Full
time” college students now average
27 hours of academic work a week—including just 14 hours
spent studying.
What are students doing with their extra free time? Having fun.
As Richard Arum and
Josipa Roksa frostily remark in their 2011 book, Academically
Adrift,
If we presume that students are sleeping eight hours a night,
which is a generous
assumption given their tardiness and at times disheveled
appearance in early morning
classes, that leaves 85 hours a week for other activities.
Arum and Roksa cite a study finding that students at one typical
college spent 13 hours a week
studying, 12 hours “socializing with friends,” 11 hours “using
computers for fun,” eight hours
working for pay, six hours watching TV, six hours exercising,
five hours on “hobbies,” and three
hours on “other forms of entertainment.” Grade inflation
completes the idyllic package by
shielding students from negative feedback. The average GPA is
now 3.2.
***
What does this mean for the individual student? Would I advise
an academically well-prepared
18-year-old to skip college because she won’t learn much of
value? Absolutely not. Studying
irrelevancies for the next four years will impress future
employers and raise her income
potential. If she tried to leap straight into her first white-collar
job, insisting, “I have the right
stuff to graduate, I just choose not to,” employers wouldn’t
believe her. To unilaterally curtail
your education is to relegate yourself to a lower-quality pool of
workers. For the individual,
college pays.
This does not mean, however, that higher education paves the
way to general prosperity
or social justice. When we look at countries around the world, a
year of education appears to
raise an individual’s income by 8 to 11 percent. By contrast,
increasing education across a
country’s population by an average of one year per person
raises the national income by only 1
to 3 percent. In other words, education enriches individuals
much more than it enriches nations.
How is this possible? Credential inflation: As the average level
of education rises, you need more
education to convince employers you’re worthy of any specific
job. One research team found
that from the early 1970s through the mid‑1990s, the average
education level within 500
occupational categories rose by 1.2 years. But most of the jobs
didn’t change much over that
span—there’s no reason, except credential inflation, why people
should have needed more
education to do them in 1995 than in 1975. What’s more, all
American workers’ education rose
by 1.5 years in that same span—which is to say that a great
majority of the extra education
workers received was deployed not to get better jobs, but to get
jobs that had recently been held
by people with less education.
As credentials proliferate, so do failed efforts to acquire them.
Students can and do pay
tuition, kill a year, and flunk their finals. Any respectable
verdict on the value of education must
account for these academic bankruptcies. Failure rates are high,
particularly for students with
low high-school grades and test scores; all told, about 60
percent of full-time college students fail
to finish in four years. Simply put, the push for broader college
education has steered too many
students who aren’t cut out for academic success onto the
college track.
The college-for-all mentality has fostered neglect of a realistic
substitute: vocational
education. It takes many guises—classroom training,
apprenticeships and other types of on-the-
job training, and straight-up work experience—but they have
much in common. All vocational
education teaches specific job skills, and all vocational
education revolves around learning by
doing, not learning by listening. Research, though a bit sparse,
suggests that vocational education
raises pay, reduces unemployment, and increases the rate of
high-school completion.
Defenders of traditional education often appeal to the obscurity
of the future. What’s the
point of prepping students for the economy of 2018, when
they’ll be employed in the economy
of 2025 or 2050? But ignorance of the future is no reason to
prepare students for occupations
they almost surely won’t have—and if we know anything about
the future of work, we know that
the demand for authors, historians, political scientists,
physicists, and mathematicians will stay
low. It’s tempting to say that students on the college track can
always turn to vocational
education as a Plan B, but this ignores the disturbing possibility
that after they crash, they’ll be
too embittered to go back and learn a trade. The vast American
underclass shows that this
disturbing possibility is already our reality.
Education is so integral to modern life that we take it for
granted. Young people have to
leap through interminable academic hoops to secure their place
in the adult world. My thesis, in a
single sentence: Civilized societies revolve around education
now, but there is a better—indeed,
more civilized—way. If everyone had a college degree, the
result would be not great jobs for all,
but runaway credential inflation. Trying to spread success with
education spreads education but
not success.
Midterm Exam: Summary & Response
*Take-home exam: 100 Homework Points
*Required length: About 750 Words.
Topic: Higher Education
Background: You have spent the past three weeks developing a
deeply informed opinion about the purpose of higher education.
You’ve explored your own experiences, interviewed college
graduates, read a variety of texts, debated the purpose of higher
education in class, and constructed an argument about higher
education based on a synthesis of these wide-ranging sources.
In short, you know what you’re talking about. You have a
certain amount of expertise on this topic. You are going to use
that expertise to respond to the arguments of a published author.
Main Task:First, summarize the argument made in either "The
Value of a College Degree" or "The Case Against College."
Then in a clear, arguable thesis statement, state your response
to that argument. Explain and support your response with 2-3
proof paragraphs. Finally, conclude the essay with a paragraph
exploring the broader significance of your argument.
Important Notes
* You are taking advantage of the hard work you’ve already
done in this unit in order to respond to the writer’s argument
with cogency and force. Therefore, do not worry if there is
some redundancy between the essay you just completed and this
in-class essay.
* Notice that this assignment is asking you to write the exact
same type of essay as Essay #1—summary and response. Use
what you learned writing that essay to make this one excellent.
Also, apply my feedback on your first essay to this essay.
* You are bringing in evidence from the other readings, your
experience, your interview, etc. in order to prove the writer of
“The Value of a College Degree” or “The Case Against
College” right or wrong.
Structure
Introduction (1 paragraph): Set up the conversation, and
thoroughly summarize the main points from the text you will be
responding to. (Use the strategies described in Ch. 2 of TSIS.)
Thesis (1-2 sentences): State your response to the arguments
summarized in the introduction—agree, disagree, or both. (Use
the templates in Ch. 4 of TSIS.)
Proof (2-3 paragraphs):Back up your response with reasoning
and evidence.
· Point: State one reason you agree/disagree with one of the
writer’s ideas. ("I agree with the point that_____ because
____.")
· Information, part 1: Briefly review the specific idea from the
text you’re responding to.
· Information, part 2: Provide evidence from your experience,
your interview, the previous readings from this unit, etc. that
proves the writer is wrong or right.
· Explanation: Explain why your evidence proves the writer
right or wrong.
Conclusion (1 paragraph):What is significant about what you’ve
covered in this essay? How does this argument affect the
reader? What bigger issues or problems do your points in this
essay shed light on?
Essay Goals: These goals will be incorporated into the grading
criteria for the essay.
1. The introduction includes a summary that accurately
represents the writer's ideas and demonstrates your
comprehension of the text.
2. The introduction's summary is relevant to the response that
follows. The summary highlights the features of the text that the
rest of the essay responds to.
3. The thesisclearly communicates your response to the writer’s
ideas.
4. The thesis prepares the reader, previewing the full scope and
content of the essay.
5. All of the proof paragraphs have a clear connection to the
thesis, creating a unified essay.
6. All of the proof paragraphs have topic sentences that preview
the content of the paragraph and evidence that proves the claim
made in the topic sentence.
7. The conclusion answers the question, “so what?” It explains
the “big picture” implications of your essay.
8. The essay is carefully proofread. Itis mostly free of
grammatical and mechanical errors.
9. The response, as a whole, "joins the conversation," engages
directly and meaningfully with the writer's ideas while also
bringing something new to the debate.
PAGE
43
Business MajorSchool TypeCost30 Year ROIAnnual
ROIPrivate$222,700.00$1,786,000.007.70%SUMMARY
OUTPUTPrivate$176,400.00$1,758,000.008.40%Private$212,20
0.00$1,714,000.007.80%Regression
StatisticsPublic$125,100.00$1,535,000.009.10%Multiple
R0.9787209512Private$212,700.00$1,529,000.007.40%R
Square0.9578947004Public$92,910.00$1,501,000.0010.10%Adj
usted R
Square0.955417918Private$214,900.00$1,485,000.007.30%Stan
dard
Error0.0023845146Private$217,800.00$1,483,000.007.20%Obse
rvations19Private$225,600.00$1,444,000.007.00%Private$217,3
00.00$1,442,000.007.10%ANOVAPrivate$226,500.00$1,441,00
0.007.00%dfSSMSFSignificance
FPrivate$215,500.00$1,438,000.007.20%Regression10.0021990
2370.0021990237386.74965023190Private$223,500.00$1,428,0
00.007.00%Residual170.00009666050.0000056859Private$226,
600.00$1,414,000.007.00%Total180.0022956842Private$189,30
0.00$1,397,000.007.50%Public$89,700.00$1,382,000.009.90%C
oefficientsStandard Errort StatP-valueLower 95%Upper
95%Lower 95.0%Upper
95.0%Public$87,030.00$1,376,000.0010.00%Intercept0.118574
67940.00212155455.89048346911.03615220115437E-
200.11409859170.12305076710.11409859170.1230507671Priva
te$218,200.00$1,343,000.006.90%222700-
0.00000021580.000000011-19.66595154660-0.0000002389-
0.0000001926-0.0000002389-
0.0000001926Private$229,900.00$1,339,000.006.70%Private$1
48,800.00$1,321,000.008.10%Best College ROI by Majo 2013:
Payscale.comRESIDUAL OUTPUTObservationPredicted
0.077Residuals10.08051541770.003484582320.07279137250.00
5208627530.0915836724-
0.000583672440.07268349480.001316505250.09852884040.002
471159660.07220883280.000791167270.0715831420.00041685
880.06990024950.000099750590.0716910197-
0.0006910197100.06970606960.0002939304110.0720793795-
0.0000793795120.0703533359-
0.0003533359130.0696844940.000315506140.0777321724-
0.0027321724150.0992214154-
0.0002214154160.09979748240.0002025176170.0714968398-
0.0024968398180.068972501-0.001972501190.0864702682-
0.0054702682
222700 Line Fit Plot
176400 212200 125100 212700 92910 214900
217800 225600 217300 226500 215500 223500
226600 189300 89700 87030 218200 229900
148800 8.4000000000000005E-2 7.8E-2
9.0999999999999998E-2 7.3999999999999996E-2
0.10100000000000001 7.2999999999999995E-2
7.1999999999999995E-2 7.0000000000000007E-2
7.0999999999999994E-2 7.0000000000000007E-2
7.1999999999999995E-2 7.0000000000000007E-2
7.0000000000000007E-2 7.4999999999999997E-2
9.9000000000000005E-2 0.1 6.9000000000000006E-2
6.7000000000000004E-2 8.1000000000000003E-2
Predicted 0.077 176400 212200 125100 212700
92910 214900 217800 225600 217300 226500
215 500 223500 226600 189300 89700 87030
218200 229900 148800 8.051541770169697E-2
7.2791372523244413E-2 9.1583672384786791E-2
7.2683494797288389E-2 9.8528840381836708E-2
7.2208832803081796E-2 7.1583141992536764E-2
6.9900249467622522E-2 7.1691019718492802E-2
6.970606956090164E-2 7.2079379531934551E-2
7.0353335916637894E-2 6.9684494015710446E-2
7.7732172372031103E-2 9.9221415382474504E-2
9.9797482439079765E-2 7.1496839811771934E-2
6.8972501024400557E-2 8.6470268174470427E-2
222700
0.077
Engineering MajorSchool TypeCost30 Year ROIAnnual
ROIPrivate$221,700.00$2,412,000.008.70%SUMMARY
OUTPUTPrivate$213,000.00$2,064,000.008.30%Private$230,10
0.00$1,949,000.007.90%Regression
StatisticsPrivate$222,600.00$1,947,000.008.00%Multiple
R0.9837243039Private$225,800.00$1,938,000.008.00%R
Square0.9677135062Public$87,660.00$1,937,000.0011.20%Adj
usted R
Square0.9658143007Private$224,900.00$1,915,000.007.90%Sta
ndard
Error0.002766586Private$221,600.00$1,878,000.007.90%Obser
vations19Public$125,100.00$1,854,000.009.80%Private$215,70
0.00$1,794,000.007.90%ANOVAPublic$92,530.00$1,761,000.0
010.60%dfSSMSFSignificance
FPrivate$217,800.00$1,752,000.007.70%Regression10.0038999
8730.0038999873509.53595942710Public$89,700.00$1,727,000
.0010.70%Residual170.0001301180.000007654Private$229,600.
00$1,716,000.007.50%Total180.0040301053Public$101,500.00$
1,703,000.0010.20%Public$115,500.00$1,694,000.009.70%Coef
ficientsStandard Errort StatP-valueLower 95%Upper 95%Lower
95.0%Upper
95.0%Public$104,500.00$1,690,000.0010.10%Intercept0.12731
286620.001701214474.83645998097.3896489481079E-
230.12372361750.13090211490.12372361750.1309021149Publi
c$69,980.00$1,685,000.0011.50%221700-
0.00000022040.0000000098-22.57290321220-0.000000241-
0.0000001998-0.000000241-
0.0000001998Private$219,400.00$1,676,000.007.60%Public$64
,930.00$1,668,000.0011.70%RESIDUAL
OUTPUTObservationPredicted
0.087Residuals10.08037475970.002625240320.07660648910.00
2393510930.07825923940.001740760640.07755406590.002445
934150.10799552150.004004478560.0777523960.00124760470.
07847960610.000520393980.0997449923-
0.001744992390.0797797696-0.0007797696100.1069223357-
0.0009223357110.0793169995-0.0023169995120.1075459734-
0.0005459734130.0767166725-0.0017166725140.1049456464-
0.0029456464150.1018605126-0.0048605126160.1042845463-
0.0032845463170.11189160470.0031083953180.0789644128-
0.0029644128190.11300445650.0039955435
213000 230100 222600 225800 87660 224900
221600 125100 215700 92530 217800 89700
229600 101500 115500 104500 69980 219400
64930 8.3000000000000004E-2
7.9000000000000001E-2 0.08 0.08 0.112
7.9000000000000001E-2 7.9000000000000001E-2
9.8000000000000004E-2 7.9000000000000001E-2 0.106
7.6999999999999999E-2 0.107
7.4999999999999997E-2 0.10199999999999999
9.7000000000000003E-2 0.10100000000000001 0.115
7.5999999999999998E-2 0.11700000000000001
Predicted 0.087 213000 230100 222600 225800
87660 224900 221600 125100 215700 92530
217800 89700 229600 101500 115500 104500
69980 219400 64930 8.0374759655289965E-2
7.6606489131244959E-2 7.825923936108925E-2
7.7554065929689026E-2 0.10799552149644798
7.7752395957270348E-2 7.8479606058401832E-2
9.9744992349065198E-2 7.9779769572546011E-2
0.10692233568053573 7.9316999508189615E-2
0.10754597343393033 7.6716672479901243E-2
0.10494564640564194 0.10186051264326591
0.10428454631370423 0.11189160470493427
7.8964412792489502E-2 0.11300445652636278
Week 6 Project
Engineering
Hypothesis Test
Sample Size 21
Sample Mean $164,680.00
Sample Standard Deviation 66385.12191
Hypothesized Value 160000
Standard Error 14486.42125
Test Statistics t 0.323061156
Degree of Freedom 20
p-value (lower tail) 0.624998872 0.5
p-value (upper tail) 0.375001128
p-value (two tail) 0.750002255
The level of 0.05 does not reject the null hypothesis in
conclusion because the mean ‘Cost’ for a college for Business
Major is not any dissimilar than $160,000
Major
Hypothesis Test
Sample Size 20
Sample Mean $188,632.00
Sample standard Deviation 50503.42902
Hypothesized Value 160000
Standard Error 11292.91004
Test Statistic t 2.535396094
Degree of Freedom 19
p-value (lower tail) 0.98991306 0.05
p-value (upper tail) 0.01008694
p-value(two tail) 0.020173879
We should reject the null hypothesis, that is to say, the mean
‘Cost’ for Business major is not $160,000
t-Test: Two-Sample Assuming Unequal Variances
1786000
2412000
Mean
1461578.947
1807789.474
Variance
13101035088
14855953216
Observations
19
19
Hypothesized Mean Difference
0
df
36
t Stat
-9.025512588
P(T<=t) one-tail
4.46406E-11
t Critical one-tail
1.305513886
P(T<=t) two-tail
8.92812E-11
t Critical two-tail
1.688297714
The 30 year ROI for Business is less than the 30 year ROI for
engineering.
Sheet4Row LabelsCount of Annual ROI(blank)0.067-
0.077130.077-0.08730.087-0.09710.097-0.1073Grand Total20
Histogram
Total (blank) 0.067-0.077 0.077-0.087 0.087-0.097
0.097-0.107 13 3 1 3
Business MajorSchool TypeCost30 Year ROIAnnual
ROIPrivate$222,700.00$1,786,000.007.70%Private$176,400.00
$1,758,000.008.40%Private$212,200.00$1,714,000.007.80%Pub
lic$125,100.00$1,535,000.009.10%Private$212,700.00$1,529,0
00.007.40%Public$92,910.00$1,501,000.0010.10%Private$214,
900.00$1,485,000.007.30%Private$217,800.00$1,483,000.007.2
0%Private$225,600.00$1,444,000.007.00%Private$217,300.00$
1,442,000.007.10%Private$226,500.00$1,441,000.007.00%Priva
te$215,500.00$1,438,000.007.20%Private$223,500.00$1,428,00
0.007.00%Private$226,600.00$1,414,000.007.00%Private$189,3
00.00$1,397,000.007.50%Public$89,700.00$1,382,000.009.90%
Public$87,030.00$1,376,000.0010.00%Private$218,200.00$1,34
3,000.006.90%Private$229,900.00$1,339,000.006.70%Private$1
48,800.00$1,321,000.008.10%Best College ROI by Majo 2013:
Payscale.comMean7.82%Median7.35%
Sheet2Row LabelsCount of Annual ROI0.075-0.085100.085-
0.09510.095-0.10540.105-0.11530.115-0.1252Grand Total20
Histogram
Total 0.075-0.085 0.085-0.095 0.095-0.105 0.105-
0.115 0.115-0.125 10 1 4 3 2
Engineering MajorSchool TypeCost30 Year ROIAnnual
ROIPrivate$221,700.00$2,412,000.008.70%Private$213,000.00
$2,064,000.008.30%Private$230,100.00$1,949,000.007.90%Priv
ate$222,600.00$1,947,000.008.00%Private$225,800.00$1,938,0
00.008.00%Public$87,660.00$1,937,000.0011.20%Private$224,
900.00$1,915,000.007.90%Private$221,600.00$1,878,000.007.9
0%Public$125,100.00$1,854,000.009.80%Private$215,700.00$1
,794,000.007.90%Public$92,530.00$1,761,000.0010.60%Private
$217,800.00$1,752,000.007.70%Public$89,700.00$1,727,000.00
10.70%Private$229,600.00$1,716,000.007.50%Public$101,500.
00$1,703,000.0010.20%Public$115,500.00$1,694,000.009.70%P
ublic$104,500.00$1,690,000.0010.10%Public$69,980.00$1,685,
000.0011.50%Private$219,400.00$1,676,000.007.60%Public$64
,930.00$1,668,000.0011.70%Mean9.15%Median8.50%
Week 2
For each of the 2 majors calculate the mean, median, minimum,
maximum, range, and standard deviation for the columns ‘Cost’
and ’30-Year ROI
Engineering Major
Minimum $64,930.00
Maximum $230,100.00
Mean $164,680.00
Median $214,350.00
Standard Dev $66,385.12
Range $165,170.00
Business Major
Minimum $87,030.00
Maximum $229,900.00
Mean $188,632.00
Median $215,200.00
Standard Dev $50,503.43
Range $142,870.00
By hand or with Excel, for each of the 2 majors calculate the
probability that a college picked from the column for ‘School
Type’ is ‘Private’.
Engineering
11÷20=0.55=55
Business
16÷20=0.80=80
By hand or with Excel, for each of the 2 majors find the
probability that a college with the ‘School Type’ ‘Private’ has a
’30-Year ROI’ between $1,500,000 and $1,800,000.
Engineering
4÷11=0.36=36
Business
4÷16=.025=25

More Related Content

Similar to College Inequality: How Higher Education Has Reinforced Class Divides

TU 1Huayou TuInstructor Danielle SchleicherENGL 11215 Fe.docx
TU 1Huayou TuInstructor Danielle SchleicherENGL 11215 Fe.docxTU 1Huayou TuInstructor Danielle SchleicherENGL 11215 Fe.docx
TU 1Huayou TuInstructor Danielle SchleicherENGL 11215 Fe.docxwillcoxjanay
 
The Future We Want Radical Ideas for the New Century R·A..docx
The Future We Want Radical Ideas for the New Century R·A..docxThe Future We Want Radical Ideas for the New Century R·A..docx
The Future We Want Radical Ideas for the New Century R·A..docxarnoldmeredith47041
 
The Future We Want Radical Ideas for the New Century R·A..docx
The Future We Want Radical Ideas for the New Century R·A..docxThe Future We Want Radical Ideas for the New Century R·A..docx
The Future We Want Radical Ideas for the New Century R·A..docxrtodd194
 
The Red Balloon Project Re-Imagining Undergraduate Education
The Red Balloon Project Re-Imagining Undergraduate EducationThe Red Balloon Project Re-Imagining Undergraduate Education
The Red Balloon Project Re-Imagining Undergraduate Educationleadchangeagent
 
RTI Overview 20.0 Includes an RTI overview that is comprehensi.docx
RTI Overview 20.0 Includes an RTI overview that is comprehensi.docxRTI Overview 20.0 Includes an RTI overview that is comprehensi.docx
RTI Overview 20.0 Includes an RTI overview that is comprehensi.docxdaniely50
 
1NameThe Precarious State of the American DreamSince th
1NameThe Precarious State of the American DreamSince th1NameThe Precarious State of the American DreamSince th
1NameThe Precarious State of the American DreamSince thTatianaMajor22
 
Adulthood, Delayed What Has the Recession Done to Millennials.docx
Adulthood, Delayed What Has the Recession Done to Millennials.docxAdulthood, Delayed What Has the Recession Done to Millennials.docx
Adulthood, Delayed What Has the Recession Done to Millennials.docxnettletondevon
 
How To Write An Opinion Essay In French
How To Write An Opinion Essay In FrenchHow To Write An Opinion Essay In French
How To Write An Opinion Essay In FrenchCarolyn Smith
 
American Jobs - 2 Problems.docx
American Jobs - 2 Problems.docxAmerican Jobs - 2 Problems.docx
American Jobs - 2 Problems.docxPRA USA
 

Similar to College Inequality: How Higher Education Has Reinforced Class Divides (13)

TU 1Huayou TuInstructor Danielle SchleicherENGL 11215 Fe.docx
TU 1Huayou TuInstructor Danielle SchleicherENGL 11215 Fe.docxTU 1Huayou TuInstructor Danielle SchleicherENGL 11215 Fe.docx
TU 1Huayou TuInstructor Danielle SchleicherENGL 11215 Fe.docx
 
Sociology artifact 2
Sociology artifact 2Sociology artifact 2
Sociology artifact 2
 
The Future We Want Radical Ideas for the New Century R·A..docx
The Future We Want Radical Ideas for the New Century R·A..docxThe Future We Want Radical Ideas for the New Century R·A..docx
The Future We Want Radical Ideas for the New Century R·A..docx
 
The Future We Want Radical Ideas for the New Century R·A..docx
The Future We Want Radical Ideas for the New Century R·A..docxThe Future We Want Radical Ideas for the New Century R·A..docx
The Future We Want Radical Ideas for the New Century R·A..docx
 
M is for Michigan
M is for Michigan M is for Michigan
M is for Michigan
 
The Red Balloon Project Re-Imagining Undergraduate Education
The Red Balloon Project Re-Imagining Undergraduate EducationThe Red Balloon Project Re-Imagining Undergraduate Education
The Red Balloon Project Re-Imagining Undergraduate Education
 
RTI Overview 20.0 Includes an RTI overview that is comprehensi.docx
RTI Overview 20.0 Includes an RTI overview that is comprehensi.docxRTI Overview 20.0 Includes an RTI overview that is comprehensi.docx
RTI Overview 20.0 Includes an RTI overview that is comprehensi.docx
 
1NameThe Precarious State of the American DreamSince th
1NameThe Precarious State of the American DreamSince th1NameThe Precarious State of the American DreamSince th
1NameThe Precarious State of the American DreamSince th
 
Adulthood, Delayed What Has the Recession Done to Millennials.docx
Adulthood, Delayed What Has the Recession Done to Millennials.docxAdulthood, Delayed What Has the Recession Done to Millennials.docx
Adulthood, Delayed What Has the Recession Done to Millennials.docx
 
SmartShoppersPDF
SmartShoppersPDFSmartShoppersPDF
SmartShoppersPDF
 
How To Write An Opinion Essay In French
How To Write An Opinion Essay In FrenchHow To Write An Opinion Essay In French
How To Write An Opinion Essay In French
 
Sociology artifact 2
Sociology artifact 2Sociology artifact 2
Sociology artifact 2
 
American Jobs - 2 Problems.docx
American Jobs - 2 Problems.docxAmerican Jobs - 2 Problems.docx
American Jobs - 2 Problems.docx
 

More from cockekeshia

at least 2 references in each peer responses! I noticed .docx
at least 2 references in each peer responses! I noticed .docxat least 2 references in each peer responses! I noticed .docx
at least 2 references in each peer responses! I noticed .docxcockekeshia
 
At least 2 pages longMarilyn Lysohir, an internationally celebra.docx
At least 2 pages longMarilyn Lysohir, an internationally celebra.docxAt least 2 pages longMarilyn Lysohir, an internationally celebra.docx
At least 2 pages longMarilyn Lysohir, an internationally celebra.docxcockekeshia
 
At least 2 citations. APA 7TH EditionResponse 1. TITop.docx
At least 2 citations. APA 7TH EditionResponse 1. TITop.docxAt least 2 citations. APA 7TH EditionResponse 1. TITop.docx
At least 2 citations. APA 7TH EditionResponse 1. TITop.docxcockekeshia
 
At each decision point, you should evaluate all options before selec.docx
At each decision point, you should evaluate all options before selec.docxAt each decision point, you should evaluate all options before selec.docx
At each decision point, you should evaluate all options before selec.docxcockekeshia
 
At an elevation of nearly four thousand metres above sea.docx
At an elevation of nearly four thousand metres above sea.docxAt an elevation of nearly four thousand metres above sea.docx
At an elevation of nearly four thousand metres above sea.docxcockekeshia
 
At a minimum, your outline should include the followingIntroducti.docx
At a minimum, your outline should include the followingIntroducti.docxAt a minimum, your outline should include the followingIntroducti.docx
At a minimum, your outline should include the followingIntroducti.docxcockekeshia
 
At least 500 wordsPay attention to the required length of these.docx
At  least 500 wordsPay attention to the required length of these.docxAt  least 500 wordsPay attention to the required length of these.docx
At least 500 wordsPay attention to the required length of these.docxcockekeshia
 
At a generic level, innovation is a core business process concerned .docx
At a generic level, innovation is a core business process concerned .docxAt a generic level, innovation is a core business process concerned .docx
At a generic level, innovation is a core business process concerned .docxcockekeshia
 
Asymmetric Cryptography•Description of each algorithm•Types•Encrypt.docx
Asymmetric Cryptography•Description of each algorithm•Types•Encrypt.docxAsymmetric Cryptography•Description of each algorithm•Types•Encrypt.docx
Asymmetric Cryptography•Description of each algorithm•Types•Encrypt.docxcockekeshia
 
Astronomy HWIn 250-300 words,What was Aristarchus idea of the.docx
Astronomy HWIn 250-300 words,What was Aristarchus idea of the.docxAstronomy HWIn 250-300 words,What was Aristarchus idea of the.docx
Astronomy HWIn 250-300 words,What was Aristarchus idea of the.docxcockekeshia
 
Astronomy ASTA01The Sun and PlanetsDepartment of Physic.docx
Astronomy ASTA01The Sun and PlanetsDepartment of Physic.docxAstronomy ASTA01The Sun and PlanetsDepartment of Physic.docx
Astronomy ASTA01The Sun and PlanetsDepartment of Physic.docxcockekeshia
 
Astronomers have been reflecting laser beams off the Moon since refl.docx
Astronomers have been reflecting laser beams off the Moon since refl.docxAstronomers have been reflecting laser beams off the Moon since refl.docx
Astronomers have been reflecting laser beams off the Moon since refl.docxcockekeshia
 
Astrategicplantoinformemergingfashionretailers.docx
Astrategicplantoinformemergingfashionretailers.docxAstrategicplantoinformemergingfashionretailers.docx
Astrategicplantoinformemergingfashionretailers.docxcockekeshia
 
Asthma, Sleep, and Sun-SafetyPercentage of High School S.docx
Asthma, Sleep, and Sun-SafetyPercentage of High School S.docxAsthma, Sleep, and Sun-SafetyPercentage of High School S.docx
Asthma, Sleep, and Sun-SafetyPercentage of High School S.docxcockekeshia
 
Asthma DataSchoolNumStudentIDGenderZipDOBAsthmaRADBronchitisWheezi.docx
Asthma DataSchoolNumStudentIDGenderZipDOBAsthmaRADBronchitisWheezi.docxAsthma DataSchoolNumStudentIDGenderZipDOBAsthmaRADBronchitisWheezi.docx
Asthma DataSchoolNumStudentIDGenderZipDOBAsthmaRADBronchitisWheezi.docxcockekeshia
 
Assumption-Busting1. What assumption do you have that is in s.docx
Assumption-Busting1.  What assumption do you have that is in s.docxAssumption-Busting1.  What assumption do you have that is in s.docx
Assumption-Busting1. What assumption do you have that is in s.docxcockekeshia
 
Assuming you have the results of the Business Impact Analysis and ri.docx
Assuming you have the results of the Business Impact Analysis and ri.docxAssuming you have the results of the Business Impact Analysis and ri.docx
Assuming you have the results of the Business Impact Analysis and ri.docxcockekeshia
 
Assuming you are hired by a corporation to assess the market potenti.docx
Assuming you are hired by a corporation to assess the market potenti.docxAssuming you are hired by a corporation to assess the market potenti.docx
Assuming you are hired by a corporation to assess the market potenti.docxcockekeshia
 
Assuming that you are in your chosen criminal justice professi.docx
Assuming that you are in your chosen criminal justice professi.docxAssuming that you are in your chosen criminal justice professi.docx
Assuming that you are in your chosen criminal justice professi.docxcockekeshia
 
assuming that Nietzsche is correct that conventional morality is aga.docx
assuming that Nietzsche is correct that conventional morality is aga.docxassuming that Nietzsche is correct that conventional morality is aga.docx
assuming that Nietzsche is correct that conventional morality is aga.docxcockekeshia
 

More from cockekeshia (20)

at least 2 references in each peer responses! I noticed .docx
at least 2 references in each peer responses! I noticed .docxat least 2 references in each peer responses! I noticed .docx
at least 2 references in each peer responses! I noticed .docx
 
At least 2 pages longMarilyn Lysohir, an internationally celebra.docx
At least 2 pages longMarilyn Lysohir, an internationally celebra.docxAt least 2 pages longMarilyn Lysohir, an internationally celebra.docx
At least 2 pages longMarilyn Lysohir, an internationally celebra.docx
 
At least 2 citations. APA 7TH EditionResponse 1. TITop.docx
At least 2 citations. APA 7TH EditionResponse 1. TITop.docxAt least 2 citations. APA 7TH EditionResponse 1. TITop.docx
At least 2 citations. APA 7TH EditionResponse 1. TITop.docx
 
At each decision point, you should evaluate all options before selec.docx
At each decision point, you should evaluate all options before selec.docxAt each decision point, you should evaluate all options before selec.docx
At each decision point, you should evaluate all options before selec.docx
 
At an elevation of nearly four thousand metres above sea.docx
At an elevation of nearly four thousand metres above sea.docxAt an elevation of nearly four thousand metres above sea.docx
At an elevation of nearly four thousand metres above sea.docx
 
At a minimum, your outline should include the followingIntroducti.docx
At a minimum, your outline should include the followingIntroducti.docxAt a minimum, your outline should include the followingIntroducti.docx
At a minimum, your outline should include the followingIntroducti.docx
 
At least 500 wordsPay attention to the required length of these.docx
At  least 500 wordsPay attention to the required length of these.docxAt  least 500 wordsPay attention to the required length of these.docx
At least 500 wordsPay attention to the required length of these.docx
 
At a generic level, innovation is a core business process concerned .docx
At a generic level, innovation is a core business process concerned .docxAt a generic level, innovation is a core business process concerned .docx
At a generic level, innovation is a core business process concerned .docx
 
Asymmetric Cryptography•Description of each algorithm•Types•Encrypt.docx
Asymmetric Cryptography•Description of each algorithm•Types•Encrypt.docxAsymmetric Cryptography•Description of each algorithm•Types•Encrypt.docx
Asymmetric Cryptography•Description of each algorithm•Types•Encrypt.docx
 
Astronomy HWIn 250-300 words,What was Aristarchus idea of the.docx
Astronomy HWIn 250-300 words,What was Aristarchus idea of the.docxAstronomy HWIn 250-300 words,What was Aristarchus idea of the.docx
Astronomy HWIn 250-300 words,What was Aristarchus idea of the.docx
 
Astronomy ASTA01The Sun and PlanetsDepartment of Physic.docx
Astronomy ASTA01The Sun and PlanetsDepartment of Physic.docxAstronomy ASTA01The Sun and PlanetsDepartment of Physic.docx
Astronomy ASTA01The Sun and PlanetsDepartment of Physic.docx
 
Astronomers have been reflecting laser beams off the Moon since refl.docx
Astronomers have been reflecting laser beams off the Moon since refl.docxAstronomers have been reflecting laser beams off the Moon since refl.docx
Astronomers have been reflecting laser beams off the Moon since refl.docx
 
Astrategicplantoinformemergingfashionretailers.docx
Astrategicplantoinformemergingfashionretailers.docxAstrategicplantoinformemergingfashionretailers.docx
Astrategicplantoinformemergingfashionretailers.docx
 
Asthma, Sleep, and Sun-SafetyPercentage of High School S.docx
Asthma, Sleep, and Sun-SafetyPercentage of High School S.docxAsthma, Sleep, and Sun-SafetyPercentage of High School S.docx
Asthma, Sleep, and Sun-SafetyPercentage of High School S.docx
 
Asthma DataSchoolNumStudentIDGenderZipDOBAsthmaRADBronchitisWheezi.docx
Asthma DataSchoolNumStudentIDGenderZipDOBAsthmaRADBronchitisWheezi.docxAsthma DataSchoolNumStudentIDGenderZipDOBAsthmaRADBronchitisWheezi.docx
Asthma DataSchoolNumStudentIDGenderZipDOBAsthmaRADBronchitisWheezi.docx
 
Assumption-Busting1. What assumption do you have that is in s.docx
Assumption-Busting1.  What assumption do you have that is in s.docxAssumption-Busting1.  What assumption do you have that is in s.docx
Assumption-Busting1. What assumption do you have that is in s.docx
 
Assuming you have the results of the Business Impact Analysis and ri.docx
Assuming you have the results of the Business Impact Analysis and ri.docxAssuming you have the results of the Business Impact Analysis and ri.docx
Assuming you have the results of the Business Impact Analysis and ri.docx
 
Assuming you are hired by a corporation to assess the market potenti.docx
Assuming you are hired by a corporation to assess the market potenti.docxAssuming you are hired by a corporation to assess the market potenti.docx
Assuming you are hired by a corporation to assess the market potenti.docx
 
Assuming that you are in your chosen criminal justice professi.docx
Assuming that you are in your chosen criminal justice professi.docxAssuming that you are in your chosen criminal justice professi.docx
Assuming that you are in your chosen criminal justice professi.docx
 
assuming that Nietzsche is correct that conventional morality is aga.docx
assuming that Nietzsche is correct that conventional morality is aga.docxassuming that Nietzsche is correct that conventional morality is aga.docx
assuming that Nietzsche is correct that conventional morality is aga.docx
 

Recently uploaded

Paris 2024 Olympic Geographies - an activity
Paris 2024 Olympic Geographies - an activityParis 2024 Olympic Geographies - an activity
Paris 2024 Olympic Geographies - an activityGeoBlogs
 
Blooming Together_ Growing a Community Garden Worksheet.docx
Blooming Together_ Growing a Community Garden Worksheet.docxBlooming Together_ Growing a Community Garden Worksheet.docx
Blooming Together_ Growing a Community Garden Worksheet.docxUnboundStockton
 
Biting mechanism of poisonous snakes.pdf
Biting mechanism of poisonous snakes.pdfBiting mechanism of poisonous snakes.pdf
Biting mechanism of poisonous snakes.pdfadityarao40181
 
Employee wellbeing at the workplace.pptx
Employee wellbeing at the workplace.pptxEmployee wellbeing at the workplace.pptx
Employee wellbeing at the workplace.pptxNirmalaLoungPoorunde1
 
Kisan Call Centre - To harness potential of ICT in Agriculture by answer farm...
Kisan Call Centre - To harness potential of ICT in Agriculture by answer farm...Kisan Call Centre - To harness potential of ICT in Agriculture by answer farm...
Kisan Call Centre - To harness potential of ICT in Agriculture by answer farm...Krashi Coaching
 
Hybridoma Technology ( Production , Purification , and Application )
Hybridoma Technology  ( Production , Purification , and Application  ) Hybridoma Technology  ( Production , Purification , and Application  )
Hybridoma Technology ( Production , Purification , and Application ) Sakshi Ghasle
 
Painted Grey Ware.pptx, PGW Culture of India
Painted Grey Ware.pptx, PGW Culture of IndiaPainted Grey Ware.pptx, PGW Culture of India
Painted Grey Ware.pptx, PGW Culture of IndiaVirag Sontakke
 
EPANDING THE CONTENT OF AN OUTLINE using notes.pptx
EPANDING THE CONTENT OF AN OUTLINE using notes.pptxEPANDING THE CONTENT OF AN OUTLINE using notes.pptx
EPANDING THE CONTENT OF AN OUTLINE using notes.pptxRaymartEstabillo3
 
POINT- BIOCHEMISTRY SEM 2 ENZYMES UNIT 5.pptx
POINT- BIOCHEMISTRY SEM 2 ENZYMES UNIT 5.pptxPOINT- BIOCHEMISTRY SEM 2 ENZYMES UNIT 5.pptx
POINT- BIOCHEMISTRY SEM 2 ENZYMES UNIT 5.pptxSayali Powar
 
Enzyme, Pharmaceutical Aids, Miscellaneous Last Part of Chapter no 5th.pdf
Enzyme, Pharmaceutical Aids, Miscellaneous Last Part of Chapter no 5th.pdfEnzyme, Pharmaceutical Aids, Miscellaneous Last Part of Chapter no 5th.pdf
Enzyme, Pharmaceutical Aids, Miscellaneous Last Part of Chapter no 5th.pdfSumit Tiwari
 
भारत-रोम व्यापार.pptx, Indo-Roman Trade,
भारत-रोम व्यापार.pptx, Indo-Roman Trade,भारत-रोम व्यापार.pptx, Indo-Roman Trade,
भारत-रोम व्यापार.pptx, Indo-Roman Trade,Virag Sontakke
 
Software Engineering Methodologies (overview)
Software Engineering Methodologies (overview)Software Engineering Methodologies (overview)
Software Engineering Methodologies (overview)eniolaolutunde
 
Crayon Activity Handout For the Crayon A
Crayon Activity Handout For the Crayon ACrayon Activity Handout For the Crayon A
Crayon Activity Handout For the Crayon AUnboundStockton
 
A Critique of the Proposed National Education Policy Reform
A Critique of the Proposed National Education Policy ReformA Critique of the Proposed National Education Policy Reform
A Critique of the Proposed National Education Policy ReformChameera Dedduwage
 
The Most Excellent Way | 1 Corinthians 13
The Most Excellent Way | 1 Corinthians 13The Most Excellent Way | 1 Corinthians 13
The Most Excellent Way | 1 Corinthians 13Steve Thomason
 
How to Make a Pirate ship Primary Education.pptx
How to Make a Pirate ship Primary Education.pptxHow to Make a Pirate ship Primary Education.pptx
How to Make a Pirate ship Primary Education.pptxmanuelaromero2013
 
Science lesson Moon for 4th quarter lesson
Science lesson Moon for 4th quarter lessonScience lesson Moon for 4th quarter lesson
Science lesson Moon for 4th quarter lessonJericReyAuditor
 
Introduction to ArtificiaI Intelligence in Higher Education
Introduction to ArtificiaI Intelligence in Higher EducationIntroduction to ArtificiaI Intelligence in Higher Education
Introduction to ArtificiaI Intelligence in Higher Educationpboyjonauth
 

Recently uploaded (20)

Paris 2024 Olympic Geographies - an activity
Paris 2024 Olympic Geographies - an activityParis 2024 Olympic Geographies - an activity
Paris 2024 Olympic Geographies - an activity
 
Blooming Together_ Growing a Community Garden Worksheet.docx
Blooming Together_ Growing a Community Garden Worksheet.docxBlooming Together_ Growing a Community Garden Worksheet.docx
Blooming Together_ Growing a Community Garden Worksheet.docx
 
Biting mechanism of poisonous snakes.pdf
Biting mechanism of poisonous snakes.pdfBiting mechanism of poisonous snakes.pdf
Biting mechanism of poisonous snakes.pdf
 
Employee wellbeing at the workplace.pptx
Employee wellbeing at the workplace.pptxEmployee wellbeing at the workplace.pptx
Employee wellbeing at the workplace.pptx
 
Kisan Call Centre - To harness potential of ICT in Agriculture by answer farm...
Kisan Call Centre - To harness potential of ICT in Agriculture by answer farm...Kisan Call Centre - To harness potential of ICT in Agriculture by answer farm...
Kisan Call Centre - To harness potential of ICT in Agriculture by answer farm...
 
Hybridoma Technology ( Production , Purification , and Application )
Hybridoma Technology  ( Production , Purification , and Application  ) Hybridoma Technology  ( Production , Purification , and Application  )
Hybridoma Technology ( Production , Purification , and Application )
 
Painted Grey Ware.pptx, PGW Culture of India
Painted Grey Ware.pptx, PGW Culture of IndiaPainted Grey Ware.pptx, PGW Culture of India
Painted Grey Ware.pptx, PGW Culture of India
 
Model Call Girl in Bikash Puri Delhi reach out to us at 🔝9953056974🔝
Model Call Girl in Bikash Puri  Delhi reach out to us at 🔝9953056974🔝Model Call Girl in Bikash Puri  Delhi reach out to us at 🔝9953056974🔝
Model Call Girl in Bikash Puri Delhi reach out to us at 🔝9953056974🔝
 
EPANDING THE CONTENT OF AN OUTLINE using notes.pptx
EPANDING THE CONTENT OF AN OUTLINE using notes.pptxEPANDING THE CONTENT OF AN OUTLINE using notes.pptx
EPANDING THE CONTENT OF AN OUTLINE using notes.pptx
 
POINT- BIOCHEMISTRY SEM 2 ENZYMES UNIT 5.pptx
POINT- BIOCHEMISTRY SEM 2 ENZYMES UNIT 5.pptxPOINT- BIOCHEMISTRY SEM 2 ENZYMES UNIT 5.pptx
POINT- BIOCHEMISTRY SEM 2 ENZYMES UNIT 5.pptx
 
Enzyme, Pharmaceutical Aids, Miscellaneous Last Part of Chapter no 5th.pdf
Enzyme, Pharmaceutical Aids, Miscellaneous Last Part of Chapter no 5th.pdfEnzyme, Pharmaceutical Aids, Miscellaneous Last Part of Chapter no 5th.pdf
Enzyme, Pharmaceutical Aids, Miscellaneous Last Part of Chapter no 5th.pdf
 
भारत-रोम व्यापार.pptx, Indo-Roman Trade,
भारत-रोम व्यापार.pptx, Indo-Roman Trade,भारत-रोम व्यापार.pptx, Indo-Roman Trade,
भारत-रोम व्यापार.pptx, Indo-Roman Trade,
 
Software Engineering Methodologies (overview)
Software Engineering Methodologies (overview)Software Engineering Methodologies (overview)
Software Engineering Methodologies (overview)
 
Crayon Activity Handout For the Crayon A
Crayon Activity Handout For the Crayon ACrayon Activity Handout For the Crayon A
Crayon Activity Handout For the Crayon A
 
A Critique of the Proposed National Education Policy Reform
A Critique of the Proposed National Education Policy ReformA Critique of the Proposed National Education Policy Reform
A Critique of the Proposed National Education Policy Reform
 
The Most Excellent Way | 1 Corinthians 13
The Most Excellent Way | 1 Corinthians 13The Most Excellent Way | 1 Corinthians 13
The Most Excellent Way | 1 Corinthians 13
 
How to Make a Pirate ship Primary Education.pptx
How to Make a Pirate ship Primary Education.pptxHow to Make a Pirate ship Primary Education.pptx
How to Make a Pirate ship Primary Education.pptx
 
TataKelola dan KamSiber Kecerdasan Buatan v022.pdf
TataKelola dan KamSiber Kecerdasan Buatan v022.pdfTataKelola dan KamSiber Kecerdasan Buatan v022.pdf
TataKelola dan KamSiber Kecerdasan Buatan v022.pdf
 
Science lesson Moon for 4th quarter lesson
Science lesson Moon for 4th quarter lessonScience lesson Moon for 4th quarter lesson
Science lesson Moon for 4th quarter lesson
 
Introduction to ArtificiaI Intelligence in Higher Education
Introduction to ArtificiaI Intelligence in Higher EducationIntroduction to ArtificiaI Intelligence in Higher Education
Introduction to ArtificiaI Intelligence in Higher Education
 

College Inequality: How Higher Education Has Reinforced Class Divides

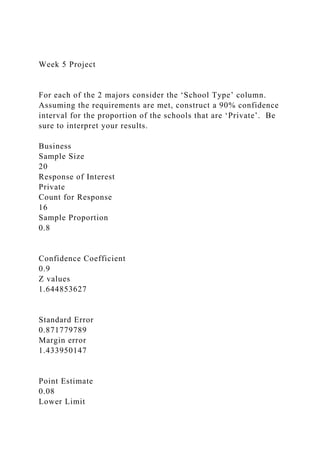
  • 1. Week 5 Project For each of the 2 majors consider the ‘School Type’ column. Assuming the requirements are met, construct a 90% confidence interval for the proportion of the schools that are ‘Private’. Be sure to interpret your results. Business Sample Size 20 Response of Interest Private Count for Response 16 Sample Proportion 0.8 Confidence Coefficient 0.9 Z values 1.644853627 Standard Error 0.871779789 Margin error 1.433950147 Point Estimate 0.08 Lower Limit
  • 2. -1.353950147 Upper Limit 1.513950147 Engineering Interval Confidence for Proportion Sample Size 20 Response of Interest Private Count for Response 10 Sample Proportion 0.5 Confidence Coefficient 0.9 Z values 1.644854 Standard Error
  • 3. 0.689202 Margin error 1.133637 Point Estimate 0.05 Lower Limit -1.08364 Upper Limit 1.183637 For each of the 2 majors construct a 95% confidence interval for the mean of the column ‘Annual % ROI’. Be sure to interpret your results. Business 30 Year ROI Mean 1477800 Standard Error 29727.05661
  • 5. Lower Limit Upper Limit Confidence Interval $1,415,580.56 $1,540,019.44 Engineering 30 Year ROI Mean 1838000 Standard Error 40204.22
  • 8. Lower Limit Upper Limit Confidence Interval $1,753,851.61 $1,922,148.39 In this article, Jeffrey J. Williams argues that, contrary to college standing as an open thoroughfare for Americans wanting to improve their lives, it has become a gated toll road primarily available to those from middle-class and upper-class families. Williams is a professor of English and of literary and cultural studies at Carnegie Mellon University. The article was originally published in “Inside Higher Ed” in July of 2016. College and the New Class Divide by Jeffrey J. Williams We usually think of college as providing a boost up the class ladder. That is what it did for a
  • 9. generation or more of Americans, particularly from the 1950s through the 1970s. But since around 1980, college has actually calcified class in America. That’s one upshot of Tamara Draut’s new book, Sleeping Giant: How the New Working Class Will Transform America (Doubleday, 2016). She explains how the central divide between the working class and the middle class now is college. Not that things are entirely rosy for those with bachelor’s degrees, but those without degrees have experienced a more severe pinch, with proportionately shrinking wages, degraded conditions, few job protections and general insecurity. Moreover, contrary to college standing as an open thoroughfare for Americans wanting to rise, it has become a gated toll road primarily available to those from middle-class and upper- class families. Those who have gone to college beget those who go to college: if your parents didn’t go to college, you are much more likely to work at or near minimum wage. Only about 9 percent of those from the lowest quartile of wealth complete college degrees, whereas about
  • 10. three-quarters from the top quartile do. A key impediment has been the exponential rise of tuition prices since the 1970s, at several times the rate of inflation, correlated with the reduction of public support, which in turn has brought the steep increase in student debt and student work hours. This has produced what Draut called in an earlier essay “The Growing College Gap,” in Inequality Matters: The Growing Economic Divide in America and Its Poisonous Consequences. We usually think that we have seen great progress if not solved the problem of racial inequality, but the enrollment gap between white students and black students was about 5 percent in 1970, whereas it had more than doubled, to 11 percent, in 2000. Similarly, Hispanic students have seen the gap widen from 5 to 13 percent. Affirmative action gets headlines, but we have actually gone backward in attaining racial equality in higher education. One of Draut’s key insights is that the class divide is not just a matter of money but also
  • 11. one of culture. As she remarks, “When once a steelworker and an accountant could live on the same block, drive the same car, vacation at the same place and eat at the same restaurants, over the course of the 1980s, 1990s and the first decade of the 2000s” those from higher classes have little substantive contact with those from the working class except when they ring up their groceries or take care of their elderly relatives. That has precipitated a public and political blindness to the new working class, even though it constitutes 60 percent of Americans. Rather than a silent majority, it is an invisible majority. The cultural divide has two daunting consequences. Because those who work in journalism and other news media come from the upper, college- degreed cohort—as Draut adduces, in 1971 only about half of journalists had B.A.s, whereas 92 percent do now—they have little direct sense of the working class. Nor is there a strong interest to represent it in the main news organs, like The New York Times or The
  • 12. Washington Post, whose audiences are largely college educated. In Draut’s analysis, after the 2008 crash, about half of the news focused on the banks, a third on the federal response, a fifth on businesses and only a smattering on working-class people who might have lost jobs or their houses. Rather, the Post ran a feature on a banker getting by on a reduction of her salary—to $300,000 a year. Hard times indeed. Similarly, those who work as congressional staffers come almost entirely from college backgrounds. Of high-level staffers, about half “attended private colleges for their undergraduate degree, including 10 percent who went to an Ivy League school.” They are typically the ones who get the internships inside the D.C. beltway, as well as can afford to carry the expenses of internships. That has effectively shut the working class out of public representation or political power, even though it constitutes a majority. For Draut, the key is to
  • 13. change the narrative, popping what she calls the “class bubble.” One corrective is simply that we are not all middle class: most Americans are working class. In addition, Sleeping Giant shows that the present working class no longer fits the iconic image of the construction worker in hard hat who had a union to speak for him. Instead, it is largely female, about half Latino and African-American, usually nonunionized, and struggling to make ends meet at or near minimum wage while laboring in home health care, fast food and retail, which have gained the bulk of new jobs. Since college is a key class marker, it’s easy to blame higher education itself as the problem. But for Draut the problem lies in the policies that have drained equal opportunity from it and segregated it, and in turn she advocates policies to enhance public higher education, notably reducing tuition fees and eliminating student debt. [As Draut has said], “Debt-free college is now a real idea and part of the political debate.”
  • 14. That’s one salutary reminder we can take from Draut: it might be a long road, but good ideas that seem unrealistic at one moment can win their day. In academic scholarship, we typically focus on conceptual problems, commenting on one and moving onto the next, and in fact we are continually looking for what’s new or next. But in politics, change sometimes seems glacial, and one has to be dogged. It’s useful to keep in mind that massive student debt is only a recent development, arising since the 1980s, and 10 years ago, the idea of abolishing it or enacting free public higher education were considered pie-in-the-sky proposals. But they’re on the agenda now, and we have to keep working to accrue the data, build the narratives and devise policies that aim toward more equality. This article explores how higher education has come to reinforce inequality rather than
  • 15. correcting it. The author, Suzanne Mettler, is a professor of government at Cornell University and the author of “Degrees of Inequality: How the Politics of Higher Education Sabotaged the American Dream.” This article was originally published in The New York Times on March 1, 2014. College, the Great Unleveler By Suzanne Mettler When the G.I. Bill of Rights of 1944 made colleges accessible to veterans regardless of socioeconomic background, Robert Maynard Hutchins, the president of the University of Chicago, worried that it would transform elite institutions into “educational hobo jungles.” But the G.I. Bill was only the first of several federal student aid laws that, along with increasing state investment in public universities and colleges, transformed American higher education over the course of three decades from a bastion of privilege into a path toward the American dream.
  • 16. Something else began to happen around 1980. College graduation rates kept soaring for the affluent, but for those in the bottom half, a four-year degree is scarcely more attainable today than it was in the 1970s. And because some colleges actually hinder social mobility, what increasingly matters is not just whether you go to college but where. The demise of opportunity through higher education is, fundamentally, a political failure. Our landmark higher education policies have ceased to function effectively, and lawmakers — consumed by partisan polarization and plutocracy — have neglected to maintain and update them. More Americans than ever enroll in college, but the graduates who emerge a few years later indicate that instead of reducing inequality, our system of higher education reinforces it. Three out of four adults who grow up in the top quarter of the income spectrum earn baccalaureate degrees by age 24, but it’s only one out of three in the next quarter down. In the
  • 17. bottom half of the economic distribution, it’s less than one out of five for those in the third bracket and fewer than one out of 10 in the poorest. That’s before we even begin differentiating by type of college. Higher education is becoming a caste system, separate and unequal for students with different family incomes. Where students attend college affects their chances of graduating and how indebted they will become in the process. Private nonprofits, schools like Stanford or Vassar, list the highest “sticker prices,” but the average student pays less than half of full fare. Some nonprofits provide generous need-based aid to low- and middle-income students, supplementing their federal aid. Others devote their resources instead to merit-based aid, courting students with high SAT scores, typically from higher-income backgrounds. These colleges rise in the rankings, but they also provide a disadvantage to poorer students who would benefit from more need-based aid, who struggle financially to stay enrolled and who take out more student loans
  • 18. to do so. Nearly three-quarters of American college students attend public universities and colleges, historically the nation’s primary channels to educational opportunity. These institutions still offer the best bargain around, yet even there, tuition increases have bred inequality. For those from the richest fifth, the annual cost of attending a public four-year college has inched up from 6 percent of family income in 1971 to 9 percent in 2011. For everyone else, the change is formidable. For those in the poorest fifth, costs at State U have skyrocketed from 42 percent of family income to 114 percent. The worst problems, though, occur at for-profit schools like those run by the Apollo Group (which owns the University of Phoenix), the Education Management Corporation or Corinthian Colleges. These schools cater to low-income students and veterans, but too often they turn hopes for a better life into the despair of financial ruin. Nearly all of their students take out loans to attend, and the
  • 19. amounts are staggering. Among holders of bachelor’s degrees, 94 percent borrow. They take on median debt of $33,000 per student, compared with just $18,000 at the nonprofits and $22,000 at the publics. The for- profit graduates have trouble finding jobs that pay enough to afford their debts, and 23 percent of borrowers default within three years, compared with just 7 percent from nonprofits and 8 percent from publics. Just when having a highly educated citizenry is more important than ever, how could we be failing so miserably at achieving it? It’s not as simple as politicians’ terminating laws or gutting funding. Federal student aid has actually increased considerably since 2007. But government has abdicated its leadership role. First, federal student aid has become less effective in promoting opportunity. In the 1970s, the maximum Pell grants for low-income students covered nearly 80 percent of costs at the average four-year public university, but by 2013-14 they covered just 31 percent. Presidents
  • 20. beginning with Bill Clinton introduced costly new tax policies to help with tuition, but these have failed to improve access for the less well off. Second, state governments, burdened by the growing cost of Medicaid, K-12 education and prisons, let higher education funding dwindle. Spending per full-time public student fell by an average of 26 percent in real terms between 1990-91 and 2009-10. Besides raising tuition, public colleges have had to squeeze resources at the schools themselves. For poorer students, graduating becomes all the harder as class sizes grow, online courses proliferate and support services are cut. Third, Congress, by loosening regulations, permitted for-profit colleges to thrive on the government’s dime. These schools, which enroll nearly a tenth of college students, use nearly a quarter of federal student aid dollars allocated through Title IV of the Higher Education Act of 1965, and they account for nearly half of all student loan defaults. A 1998 rule allows them to
  • 21. gain up to 90 percent of their revenues from Title IV alone — a figure that does not include their substantial use of military education money. Even during the 2008 financial downturn, the top publicly traded for-profits enjoyed growth. Their upper management and shareholders benefit at the expense of American taxpayers and students. Ordinary young Americans who hoped college could be their route to a better future are the victims of a perfect storm of political winds. It began with existing public policies that required routine maintenance being left to wither. As Nancy Kassebaum, a former Republican senator from Kansas, told me, “Public programs, just like any other programs, need to be managed.” She remembers when bipartisanship functioned well enough to do so on higher education issues. Now Congress is more polarized than at any point in modern history, and it’s not just decisions on nominations and the debt ceiling that suffer. I examined votes on amendments to higher education bills and found that between the 1970s and 1995-2008 the partisan split doubled
  • 22. in the House and quadrupled in the Senate. Such division on minor adjustments to policies indicates why Congress has failed to address larger issues. That’s not the whole story, either. Plutocratic governance intensifies the dysfunction, as powerful industries still have the strength to bring politicians together across the aisle in a parody of true bipartisanship. The effect of polarized plutocracy is epitomized by Congress’s support for the for-profit colleges. By the late 1990s, Republican leaders championed the for-profits as the “private sector,” never mind that 15 of the large publicly traded for- profits receive on average 86 percent of their revenues from federal student aid. Plutocracy helped bring House Democrats onboard, as the industry wooed them through strategic lobbying and campaign contributions. The result? In the House of Representatives, where Democrats and Republicans agree on almost nothing, they have united to protect $32 billion taxpayer dollars for the for- profit college industry.
  • 23. Most of us were raised to believe that going to college was the surest path to a better life, but for many today that belief can be perilous. Unless we can claw back polarization and plutocracy enough to restore opportunity in higher education, the United States will become a society in which rank is fixed and our ideal of upward mobility but a memory. The following article explores the often overlooked benefits of a higher education. It was originally published in “The Huffington Post” in 2013, and draws its conclusions from a reputable study conducted by the College Board. The author, Lizzie Wann, is the Content Director for Bridgepoint Education, overseeing all website content and working closely with New Media, Career Services, and Student Services for Ashford University. Why Your College Degree Has More Value Than You Think
  • 24. By Lizzie Wann We all know about the obvious benefits to having a college degree — namely, a steady job and financial security. But we often overlook other benefits to higher education: quality of life improvements that deserve to be brought into focus, whether you’re on the fence about going back to school or are just having a hard time appreciating the degree you already have. Here are just a few of the benefits you should take into account to start giving college credit where it’s due, according to the College Board’s newly updated study “Education Pays: The Benefits of Higher Education for Individuals and Society.” Improved Self-Esteem There’s just something about a college grad that makes her stand a little bit straighter and a little bit taller. It likely has to do with the boost to one’s self- esteem and confidence that comes with making it through a higher education program. Studies conducted by the College Board and others like it have
  • 25. found that those who have completed additional schooling are not only more well-equipped to handle mental challenges, but also report a higher level of satisfaction when doing so. Since earning a college degree has long been considered a rite of passage, there’s an extra http://www.ashford.edu/ http://blog.brazencareerist.com/2011/09/14/how-useful-is-a- college-degree-these-days/ http://trends.collegeboard.org/education-pays http://trends.collegeboard.org/education-pays http://blog.brazencareerist.com/2013/03/14/the-real-secret-to- career-success-confidence/ sense of accomplishment when you reach the finish line. You’ve accomplished something that no one can ever take away from you. Sure, you can lose the physical piece of paper, and you may move on from the job your degree helped you attain, but you’ll never lose the work behind the journey you undertook to get your diploma. Even when tough times fall, you know you have what it takes to start something and finish it successfully, and that is priceless.
  • 26. Healthy Choices In addition to the mental boost that comes with higher education, college grads are healthier overall. Higher socioeconomic status (measured by total family income, level of education attained and professional career status) is directly correlated with better physical health and life expectancy. This correlation seems obvious when you consider that those who earn more money have greater access to health care and healthier food options. But what you may not have considered is that higher education means the ability and desire to make better choices when it comes to habits — eating and otherwise. For example, those with extended educations are less likely to smoke and more likely to exercise. When you put greater emphasis on taking care of your mind with additional schooling, you naturally put greater emphasis on taking care of your body, too. It’s truly as simple as when you know better, you do better.
  • 27. Higher Job Satisfaction While we’re on the subject of bettering ourselves, one common reason people seek higher education is to get out of a dead-end job. Having a degree often means having an actual career rather than punching the clock to pay the bills. That’s all fine and good, you may say, but having a career means nothing if you can’t keep it — a task many are finding difficult as of late. Fortunately, a diploma gives you the upper hand when it comes to economy-driven layoffs. Graduates not only have higher job retention rates during a recession, but also an easier time finding re-employment due to higher marketability than their non-graduate colleagues. That means less stress overall during tough economic times. Passing on the Legacy Finally, one of the greatest benefits to having a college education is passing on the legacy to your children. Children of a college grad are more likely to have a better quality of life and
  • 28. pursue extended education themselves. Those children also have a much easier time getting into good schools because their parents have emphasized the importance of an education to them. They also tend to have better grades and test scores. As experts often state, children of college grads — even those who don’t attend college themselves — are more motivated to reach for their dreams. They know that their parents pushed through adversity to earn their degrees, and they apply that same philosophy to going after what they want in life — a bar that is placed that much higher by having college-educated parents. Although financial enrichment is one of the main reasons people choose to pursue higher education, there are many other benefits to obtaining that degree. You better yourself through improved self-confidence and enhanced decision-making ability, which also betters the lives of your family members and others around you. http://blog.brazencareerist.com/2013/01/24/why-english-majors- dont-have-to-finish-last/ https://www.luminafoundation.org/about_us/president/speeches/ 2008-05-08.html
  • 29. This article was originally published in the January/February issues of The Atlantic, a very highly regarded magazine. The author of the article, Bryan Caplan is an economics professor at George Mason University and the author of The Case Against Education. The World Might Be Better Off Without College for Everyone by Brian Caplan I have been in school for more than 40 years. First preschool, kindergarten, elementary school, junior high, and high school. Then a bachelor’s degree at UC Berkeley, followed by a doctoral program at Princeton. The next step was what you could call my first “real” job— as an economics professor at George Mason University. Thanks to tenure, I have a dream job for life. Personally, I have no reason to lash out at our system of higher education. Yet a lifetime of experience, plus a quarter century of reading and reflection, has convinced me that it is a big waste of time
  • 30. and money. When politicians vow to send more Americans to college, I can’t help gasping, “Why? You want us to waste even more?” How, you may ask, can anyone call higher education wasteful in an age when its financial payoff is greater than ever? The earnings premium for college graduates has rocketed to 73 percent—that is, those with a bachelor’s degree earn, on average, 73 percent more than those who have only a high-school diploma, up from about 50 percent in the late 1970s. The key issue, however, isn’t whether college pays, but why. The simple, popular answer is that schools teach students useful job skills. But this dodges puzzling questions. First and foremost: From kindergarten on, students spend thousands of hours studying subjects irrelevant to the modern labor market. Why do English classes focus on literature and poetry instead of business and technical writing? Why do advanced-math classes bother with proofs almost no student can follow? When will the typical student use history? Trigonometry?
  • 31. Art? Music? Physics? Latin? The class clown who snarks “What does this have to do with real life?” is onto something. The disconnect between college curricula and the job market has a banal explanation: Educators teach what they know—and most have as little firsthand knowledge of the modern workplace as I do. Yet this merely complicates the puzzle. If schools aim to boost students’ future income by teaching job skills, why do they entrust students’ education to people so detached from the real world? Because, despite the chasm between what students learn and what workers do, academic success is a strong signal of worker productivity. Suppose your law firm wants a summer associate. A law student with a doctorate in philosophy from Stanford applies. What do you infer? The applicant is probably brilliant, diligent, and willing to tolerate serious boredom. If you’re looking for that kind of worker—and what employer isn’t?—you’ll make an offer, knowing full well that nothing the philosopher
  • 32. learned at Stanford will be relevant to this job. The labor market doesn’t pay you for the useless subjects you master; it pays you for the preexisting traits you signal by mastering them. This is not a fringe idea. Michael Spence, Kenneth Arrow, and Joseph Stiglitz—all Nobel laureates in economics—made seminal contributions to the theory of educational signaling. Every college student who does the least work required to get good grades silently endorses the theory. But signaling plays almost no role in public discourse or policy making. As a society, we continue to push ever larger numbers of students into ever higher levels of education. The main effect is not better jobs or greater skill levels, but a credentialist arms race. Lest I be misinterpreted, I emphatically affirm that education confers some marketable skills, namely literacy and numeracy. Nonetheless, I believe that signaling accounts for at least half of college’s financial reward, and probably more. Most of the salary payoff for college comes from crossing the graduation finish line.
  • 33. Suppose you drop out after a year. You’ll receive a salary bump compared with someone who’s attended no college, but it won’t be anywhere near 25 percent of the salary premium you’d get for a four-year degree. Similarly, the premium for sophomore year is nowhere near 50 percent of the return on a bachelor’s degree, and the premium for junior year is nowhere near 75 percent of that return. Indeed, in the average study, senior year of college brings more than twice the pay increase of freshman, sophomore, and junior years combined. Unless colleges delay job training until the very end, signaling is practically the only explanation. This in turn implies a mountain of wasted resources—time and money that would be better spent preparing students for the jobs they’re likely to do. *** The conventional view—that education pays because students learn—assumes that the typical
  • 34. student acquires, and retains, a lot of knowledge. She doesn’t. Teachers often lament summer learning loss: Students know less at the end of summer than they did at the beginning. But summer learning loss is only a special case of the problem of fade-out: Human beings have trouble retaining knowledge they rarely use. Of course, some college graduates use what they’ve learned and thus hold on to it—engineers and other quantitative types, for example, retain a lot of math. But when we measure what the average college graduate recalls years later, the results are discouraging, to say the least. In 2003, the United States Department of Education gave about 18,000 Americans the National Assessment of Adult Literacy. The ignorance it revealed is mind-numbing. Fewer than a third of college graduates received a composite score of “proficient”—and about a fifth were at the “basic” or “below basic” level. You could blame the difficulty of the questions—until you read them. Plenty of college graduates couldn’t make sense of a table explaining how an
  • 35. employee’s annual health-insurance costs varied with income and family size, or summarize the work-experience requirements in a job ad, or even use a newspaper schedule to find when a television program ended. Tests of college graduates’ knowledge of history, civics, and science have had similarly dismal results. Of course, college students aren’t supposed to just download facts; they’re supposed to learn how to think in real life. How do they fare on this count? The most focused study of education’s effect on applied reasoning, conducted by Harvard’s David Perkins in the mid- 1980s, assessed students’ oral responses to questions designed to measure informal reasoning, such as “Would a proposed law in Massachusetts requiring a five-cent deposit on bottles and cans significantly reduce litter?” The benefit of college seemed to be zero: Fourth-year students did no better than first-year students. Other evidence is equally discouraging. One researcher tested Arizona State University students’ ability to “apply statistical and methodological concepts to reasoning about everyday-
  • 36. life events.” In the researcher’s words: Of the several hundred students tested, many of whom had taken more than six years of laboratory science … and advanced mathematics through calculus, almost none demonstrated even a semblance of acceptable methodological reasoning. Those who believe that college is about learning how to learn should expect students who study science to absorb the scientific method, then habitually use it to analyze the world. This scarcely occurs. College students do hone some kinds of reasoning that are specific to their major. One ambitious study at the University of Michigan tested natural- science, humanities, and psychology and other social-science majors on verbal reasoning, statistical reasoning, and conditional reasoning during the first semester of their first year. When the same students were retested the second semester of their fourth year, each group had sharply improved in precisely
  • 37. one area. Psychology and other social-science majors had become much better at statistical reasoning. Natural-science and humanities majors had become much better at conditional reasoning—analyzing “if … then” and “if and only if” problems. In the remaining areas, however, gains after three and a half years of college were modest or nonexistent. The takeaway: Psychology students use statistics, so they improve in statistics; chemistry students rarely encounter statistics, so they don’t improve in statistics. If all goes well, students learn what they study and practice. Actually, that’s optimistic. Educational psychologists have discovered that much of our knowledge is “inert.” Students who excel on exams frequently fail to apply their knowledge to the real world. Take physics. As the Harvard psychologist Howard Gardner writes, Students who receive honor grades in college-level physics courses are frequently unable to solve basic problems and questions encountered in a form slightly different from that
  • 38. on which they have been formally instructed and tested. The same goes for students of biology, mathematics, statistics, and, I’m embarrassed to say, economics. I try to teach my students to connect lectures to the real world and daily life. My exams are designed to measure comprehension, not memorization. Yet in a good class, four test- takers out of 40 demonstrate true economic understanding. *** Economists’ educational bean counting can come off as annoyingly narrow. Non-economists— also known as normal human beings—lean holistic: We can’t measure education’s social benefits solely with test scores or salary premiums. Instead we must ask ourselves what kind of society we want to live in—an educated one or an ignorant one? Normal human beings make a solid point: We can and should investigate education’s broad social implications. When humanists consider my calculations of education’s returns, they
  • 39. assume I’m being a typical cynical economist, oblivious to the ideals so many educators hold dear. I am an economist and I am a cynic, but I’m not a typical cynical economist. I’m a cynical idealist. I embrace the ideal of transformative education. I believe wholeheartedly in the life of the mind. What I’m cynical about is people. I’m cynical about students. The vast majority are philistines. I’m cynical about teachers. The vast majority are uninspiring. I’m cynical about “deciders”—the school officials who control what students study. The vast majority think they’ve done their job as long as students comply. Those who search their memory will find noble exceptions to these sad rules. I have known plenty of eager students and passionate educators, and a few wise deciders. Still, my 40 years in the education industry leave no doubt that they are hopelessly outnumbered. Meritorious education survives but does not thrive. Indeed, today’s college students are less willing than those of previous generations to do
  • 40. the bare minimum of showing up for class and temporarily learning whatever’s on the test. Fifty years ago, college was a full-time job. The typical student spent 40 hours a week in class or studying. Effort has since collapsed across the board. “Full time” college students now average 27 hours of academic work a week—including just 14 hours spent studying. What are students doing with their extra free time? Having fun. As Richard Arum and Josipa Roksa frostily remark in their 2011 book, Academically Adrift, If we presume that students are sleeping eight hours a night, which is a generous assumption given their tardiness and at times disheveled appearance in early morning classes, that leaves 85 hours a week for other activities. Arum and Roksa cite a study finding that students at one typical college spent 13 hours a week studying, 12 hours “socializing with friends,” 11 hours “using computers for fun,” eight hours working for pay, six hours watching TV, six hours exercising, five hours on “hobbies,” and three hours on “other forms of entertainment.” Grade inflation
  • 41. completes the idyllic package by shielding students from negative feedback. The average GPA is now 3.2. *** What does this mean for the individual student? Would I advise an academically well-prepared 18-year-old to skip college because she won’t learn much of value? Absolutely not. Studying irrelevancies for the next four years will impress future employers and raise her income potential. If she tried to leap straight into her first white-collar job, insisting, “I have the right stuff to graduate, I just choose not to,” employers wouldn’t believe her. To unilaterally curtail your education is to relegate yourself to a lower-quality pool of workers. For the individual, college pays. This does not mean, however, that higher education paves the way to general prosperity or social justice. When we look at countries around the world, a year of education appears to
  • 42. raise an individual’s income by 8 to 11 percent. By contrast, increasing education across a country’s population by an average of one year per person raises the national income by only 1 to 3 percent. In other words, education enriches individuals much more than it enriches nations. How is this possible? Credential inflation: As the average level of education rises, you need more education to convince employers you’re worthy of any specific job. One research team found that from the early 1970s through the mid‑1990s, the average education level within 500 occupational categories rose by 1.2 years. But most of the jobs didn’t change much over that span—there’s no reason, except credential inflation, why people should have needed more education to do them in 1995 than in 1975. What’s more, all American workers’ education rose by 1.5 years in that same span—which is to say that a great majority of the extra education workers received was deployed not to get better jobs, but to get jobs that had recently been held by people with less education.
  • 43. As credentials proliferate, so do failed efforts to acquire them. Students can and do pay tuition, kill a year, and flunk their finals. Any respectable verdict on the value of education must account for these academic bankruptcies. Failure rates are high, particularly for students with low high-school grades and test scores; all told, about 60 percent of full-time college students fail to finish in four years. Simply put, the push for broader college education has steered too many students who aren’t cut out for academic success onto the college track. The college-for-all mentality has fostered neglect of a realistic substitute: vocational education. It takes many guises—classroom training, apprenticeships and other types of on-the- job training, and straight-up work experience—but they have much in common. All vocational education teaches specific job skills, and all vocational education revolves around learning by doing, not learning by listening. Research, though a bit sparse, suggests that vocational education raises pay, reduces unemployment, and increases the rate of
  • 44. high-school completion. Defenders of traditional education often appeal to the obscurity of the future. What’s the point of prepping students for the economy of 2018, when they’ll be employed in the economy of 2025 or 2050? But ignorance of the future is no reason to prepare students for occupations they almost surely won’t have—and if we know anything about the future of work, we know that the demand for authors, historians, political scientists, physicists, and mathematicians will stay low. It’s tempting to say that students on the college track can always turn to vocational education as a Plan B, but this ignores the disturbing possibility that after they crash, they’ll be too embittered to go back and learn a trade. The vast American underclass shows that this disturbing possibility is already our reality. Education is so integral to modern life that we take it for granted. Young people have to leap through interminable academic hoops to secure their place in the adult world. My thesis, in a single sentence: Civilized societies revolve around education now, but there is a better—indeed,
  • 45. more civilized—way. If everyone had a college degree, the result would be not great jobs for all, but runaway credential inflation. Trying to spread success with education spreads education but not success. Midterm Exam: Summary & Response *Take-home exam: 100 Homework Points *Required length: About 750 Words. Topic: Higher Education Background: You have spent the past three weeks developing a deeply informed opinion about the purpose of higher education. You’ve explored your own experiences, interviewed college graduates, read a variety of texts, debated the purpose of higher education in class, and constructed an argument about higher education based on a synthesis of these wide-ranging sources. In short, you know what you’re talking about. You have a certain amount of expertise on this topic. You are going to use that expertise to respond to the arguments of a published author. Main Task:First, summarize the argument made in either "The Value of a College Degree" or "The Case Against College." Then in a clear, arguable thesis statement, state your response to that argument. Explain and support your response with 2-3 proof paragraphs. Finally, conclude the essay with a paragraph exploring the broader significance of your argument. Important Notes * You are taking advantage of the hard work you’ve already done in this unit in order to respond to the writer’s argument with cogency and force. Therefore, do not worry if there is some redundancy between the essay you just completed and this in-class essay.
  • 46. * Notice that this assignment is asking you to write the exact same type of essay as Essay #1—summary and response. Use what you learned writing that essay to make this one excellent. Also, apply my feedback on your first essay to this essay. * You are bringing in evidence from the other readings, your experience, your interview, etc. in order to prove the writer of “The Value of a College Degree” or “The Case Against College” right or wrong. Structure Introduction (1 paragraph): Set up the conversation, and thoroughly summarize the main points from the text you will be responding to. (Use the strategies described in Ch. 2 of TSIS.) Thesis (1-2 sentences): State your response to the arguments summarized in the introduction—agree, disagree, or both. (Use the templates in Ch. 4 of TSIS.) Proof (2-3 paragraphs):Back up your response with reasoning and evidence. · Point: State one reason you agree/disagree with one of the writer’s ideas. ("I agree with the point that_____ because ____.") · Information, part 1: Briefly review the specific idea from the text you’re responding to. · Information, part 2: Provide evidence from your experience, your interview, the previous readings from this unit, etc. that proves the writer is wrong or right. · Explanation: Explain why your evidence proves the writer right or wrong. Conclusion (1 paragraph):What is significant about what you’ve covered in this essay? How does this argument affect the reader? What bigger issues or problems do your points in this essay shed light on? Essay Goals: These goals will be incorporated into the grading
  • 47. criteria for the essay. 1. The introduction includes a summary that accurately represents the writer's ideas and demonstrates your comprehension of the text. 2. The introduction's summary is relevant to the response that follows. The summary highlights the features of the text that the rest of the essay responds to. 3. The thesisclearly communicates your response to the writer’s ideas. 4. The thesis prepares the reader, previewing the full scope and content of the essay. 5. All of the proof paragraphs have a clear connection to the thesis, creating a unified essay. 6. All of the proof paragraphs have topic sentences that preview the content of the paragraph and evidence that proves the claim made in the topic sentence. 7. The conclusion answers the question, “so what?” It explains the “big picture” implications of your essay. 8. The essay is carefully proofread. Itis mostly free of grammatical and mechanical errors. 9. The response, as a whole, "joins the conversation," engages directly and meaningfully with the writer's ideas while also bringing something new to the debate. PAGE 43
  • 48. Business MajorSchool TypeCost30 Year ROIAnnual ROIPrivate$222,700.00$1,786,000.007.70%SUMMARY OUTPUTPrivate$176,400.00$1,758,000.008.40%Private$212,20 0.00$1,714,000.007.80%Regression StatisticsPublic$125,100.00$1,535,000.009.10%Multiple R0.9787209512Private$212,700.00$1,529,000.007.40%R Square0.9578947004Public$92,910.00$1,501,000.0010.10%Adj usted R Square0.955417918Private$214,900.00$1,485,000.007.30%Stan dard Error0.0023845146Private$217,800.00$1,483,000.007.20%Obse rvations19Private$225,600.00$1,444,000.007.00%Private$217,3 00.00$1,442,000.007.10%ANOVAPrivate$226,500.00$1,441,00 0.007.00%dfSSMSFSignificance FPrivate$215,500.00$1,438,000.007.20%Regression10.0021990 2370.0021990237386.74965023190Private$223,500.00$1,428,0 00.007.00%Residual170.00009666050.0000056859Private$226, 600.00$1,414,000.007.00%Total180.0022956842Private$189,30 0.00$1,397,000.007.50%Public$89,700.00$1,382,000.009.90%C oefficientsStandard Errort StatP-valueLower 95%Upper 95%Lower 95.0%Upper 95.0%Public$87,030.00$1,376,000.0010.00%Intercept0.118574 67940.00212155455.89048346911.03615220115437E- 200.11409859170.12305076710.11409859170.1230507671Priva te$218,200.00$1,343,000.006.90%222700- 0.00000021580.000000011-19.66595154660-0.0000002389- 0.0000001926-0.0000002389- 0.0000001926Private$229,900.00$1,339,000.006.70%Private$1 48,800.00$1,321,000.008.10%Best College ROI by Majo 2013: Payscale.comRESIDUAL OUTPUTObservationPredicted 0.077Residuals10.08051541770.003484582320.07279137250.00 5208627530.0915836724- 0.000583672440.07268349480.001316505250.09852884040.002 471159660.07220883280.000791167270.0715831420.00041685 880.06990024950.000099750590.0716910197- 0.0006910197100.06970606960.0002939304110.0720793795-
  • 49. 0.0000793795120.0703533359- 0.0003533359130.0696844940.000315506140.0777321724- 0.0027321724150.0992214154- 0.0002214154160.09979748240.0002025176170.0714968398- 0.0024968398180.068972501-0.001972501190.0864702682- 0.0054702682 222700 Line Fit Plot 176400 212200 125100 212700 92910 214900 217800 225600 217300 226500 215500 223500 226600 189300 89700 87030 218200 229900 148800 8.4000000000000005E-2 7.8E-2 9.0999999999999998E-2 7.3999999999999996E-2 0.10100000000000001 7.2999999999999995E-2 7.1999999999999995E-2 7.0000000000000007E-2 7.0999999999999994E-2 7.0000000000000007E-2 7.1999999999999995E-2 7.0000000000000007E-2 7.0000000000000007E-2 7.4999999999999997E-2 9.9000000000000005E-2 0.1 6.9000000000000006E-2 6.7000000000000004E-2 8.1000000000000003E-2 Predicted 0.077 176400 212200 125100 212700 92910 214900 217800 225600 217300 226500 215 500 223500 226600 189300 89700 87030 218200 229900 148800 8.051541770169697E-2 7.2791372523244413E-2 9.1583672384786791E-2 7.2683494797288389E-2 9.8528840381836708E-2 7.2208832803081796E-2 7.1583141992536764E-2 6.9900249467622522E-2 7.1691019718492802E-2 6.970606956090164E-2 7.2079379531934551E-2 7.0353335916637894E-2 6.9684494015710446E-2 7.7732172372031103E-2 9.9221415382474504E-2 9.9797482439079765E-2 7.1496839811771934E-2 6.8972501024400557E-2 8.6470268174470427E-2 222700 0.077 Engineering MajorSchool TypeCost30 Year ROIAnnual ROIPrivate$221,700.00$2,412,000.008.70%SUMMARY
  • 50. OUTPUTPrivate$213,000.00$2,064,000.008.30%Private$230,10 0.00$1,949,000.007.90%Regression StatisticsPrivate$222,600.00$1,947,000.008.00%Multiple R0.9837243039Private$225,800.00$1,938,000.008.00%R Square0.9677135062Public$87,660.00$1,937,000.0011.20%Adj usted R Square0.9658143007Private$224,900.00$1,915,000.007.90%Sta ndard Error0.002766586Private$221,600.00$1,878,000.007.90%Obser vations19Public$125,100.00$1,854,000.009.80%Private$215,70 0.00$1,794,000.007.90%ANOVAPublic$92,530.00$1,761,000.0 010.60%dfSSMSFSignificance FPrivate$217,800.00$1,752,000.007.70%Regression10.0038999 8730.0038999873509.53595942710Public$89,700.00$1,727,000 .0010.70%Residual170.0001301180.000007654Private$229,600. 00$1,716,000.007.50%Total180.0040301053Public$101,500.00$ 1,703,000.0010.20%Public$115,500.00$1,694,000.009.70%Coef ficientsStandard Errort StatP-valueLower 95%Upper 95%Lower 95.0%Upper 95.0%Public$104,500.00$1,690,000.0010.10%Intercept0.12731 286620.001701214474.83645998097.3896489481079E- 230.12372361750.13090211490.12372361750.1309021149Publi c$69,980.00$1,685,000.0011.50%221700- 0.00000022040.0000000098-22.57290321220-0.000000241- 0.0000001998-0.000000241- 0.0000001998Private$219,400.00$1,676,000.007.60%Public$64 ,930.00$1,668,000.0011.70%RESIDUAL OUTPUTObservationPredicted 0.087Residuals10.08037475970.002625240320.07660648910.00 2393510930.07825923940.001740760640.07755406590.002445 934150.10799552150.004004478560.0777523960.00124760470. 07847960610.000520393980.0997449923- 0.001744992390.0797797696-0.0007797696100.1069223357- 0.0009223357110.0793169995-0.0023169995120.1075459734- 0.0005459734130.0767166725-0.0017166725140.1049456464- 0.0029456464150.1018605126-0.0048605126160.1042845463-
  • 51. 0.0032845463170.11189160470.0031083953180.0789644128- 0.0029644128190.11300445650.0039955435 213000 230100 222600 225800 87660 224900 221600 125100 215700 92530 217800 89700 229600 101500 115500 104500 69980 219400 64930 8.3000000000000004E-2 7.9000000000000001E-2 0.08 0.08 0.112 7.9000000000000001E-2 7.9000000000000001E-2 9.8000000000000004E-2 7.9000000000000001E-2 0.106 7.6999999999999999E-2 0.107 7.4999999999999997E-2 0.10199999999999999 9.7000000000000003E-2 0.10100000000000001 0.115 7.5999999999999998E-2 0.11700000000000001 Predicted 0.087 213000 230100 222600 225800 87660 224900 221600 125100 215700 92530 217800 89700 229600 101500 115500 104500 69980 219400 64930 8.0374759655289965E-2 7.6606489131244959E-2 7.825923936108925E-2 7.7554065929689026E-2 0.10799552149644798 7.7752395957270348E-2 7.8479606058401832E-2 9.9744992349065198E-2 7.9779769572546011E-2 0.10692233568053573 7.9316999508189615E-2 0.10754597343393033 7.6716672479901243E-2 0.10494564640564194 0.10186051264326591 0.10428454631370423 0.11189160470493427 7.8964412792489502E-2 0.11300445652636278 Week 6 Project Engineering Hypothesis Test Sample Size 21 Sample Mean $164,680.00 Sample Standard Deviation 66385.12191 Hypothesized Value 160000
  • 52. Standard Error 14486.42125 Test Statistics t 0.323061156 Degree of Freedom 20 p-value (lower tail) 0.624998872 0.5 p-value (upper tail) 0.375001128 p-value (two tail) 0.750002255 The level of 0.05 does not reject the null hypothesis in conclusion because the mean ‘Cost’ for a college for Business Major is not any dissimilar than $160,000 Major Hypothesis Test Sample Size 20 Sample Mean $188,632.00 Sample standard Deviation 50503.42902 Hypothesized Value 160000 Standard Error 11292.91004 Test Statistic t 2.535396094 Degree of Freedom 19 p-value (lower tail) 0.98991306 0.05 p-value (upper tail) 0.01008694 p-value(two tail) 0.020173879 We should reject the null hypothesis, that is to say, the mean ‘Cost’ for Business major is not $160,000 t-Test: Two-Sample Assuming Unequal Variances 1786000 2412000
  • 53. Mean 1461578.947 1807789.474 Variance 13101035088 14855953216 Observations 19 19 Hypothesized Mean Difference 0 df 36 t Stat -9.025512588 P(T<=t) one-tail 4.46406E-11 t Critical one-tail 1.305513886 P(T<=t) two-tail 8.92812E-11 t Critical two-tail 1.688297714 The 30 year ROI for Business is less than the 30 year ROI for engineering. Sheet4Row LabelsCount of Annual ROI(blank)0.067- 0.077130.077-0.08730.087-0.09710.097-0.1073Grand Total20 Histogram
  • 54. Total (blank) 0.067-0.077 0.077-0.087 0.087-0.097 0.097-0.107 13 3 1 3 Business MajorSchool TypeCost30 Year ROIAnnual ROIPrivate$222,700.00$1,786,000.007.70%Private$176,400.00 $1,758,000.008.40%Private$212,200.00$1,714,000.007.80%Pub lic$125,100.00$1,535,000.009.10%Private$212,700.00$1,529,0 00.007.40%Public$92,910.00$1,501,000.0010.10%Private$214, 900.00$1,485,000.007.30%Private$217,800.00$1,483,000.007.2 0%Private$225,600.00$1,444,000.007.00%Private$217,300.00$ 1,442,000.007.10%Private$226,500.00$1,441,000.007.00%Priva te$215,500.00$1,438,000.007.20%Private$223,500.00$1,428,00 0.007.00%Private$226,600.00$1,414,000.007.00%Private$189,3 00.00$1,397,000.007.50%Public$89,700.00$1,382,000.009.90% Public$87,030.00$1,376,000.0010.00%Private$218,200.00$1,34 3,000.006.90%Private$229,900.00$1,339,000.006.70%Private$1 48,800.00$1,321,000.008.10%Best College ROI by Majo 2013: Payscale.comMean7.82%Median7.35% Sheet2Row LabelsCount of Annual ROI0.075-0.085100.085- 0.09510.095-0.10540.105-0.11530.115-0.1252Grand Total20 Histogram Total 0.075-0.085 0.085-0.095 0.095-0.105 0.105- 0.115 0.115-0.125 10 1 4 3 2 Engineering MajorSchool TypeCost30 Year ROIAnnual ROIPrivate$221,700.00$2,412,000.008.70%Private$213,000.00 $2,064,000.008.30%Private$230,100.00$1,949,000.007.90%Priv ate$222,600.00$1,947,000.008.00%Private$225,800.00$1,938,0
  • 55. 00.008.00%Public$87,660.00$1,937,000.0011.20%Private$224, 900.00$1,915,000.007.90%Private$221,600.00$1,878,000.007.9 0%Public$125,100.00$1,854,000.009.80%Private$215,700.00$1 ,794,000.007.90%Public$92,530.00$1,761,000.0010.60%Private $217,800.00$1,752,000.007.70%Public$89,700.00$1,727,000.00 10.70%Private$229,600.00$1,716,000.007.50%Public$101,500. 00$1,703,000.0010.20%Public$115,500.00$1,694,000.009.70%P ublic$104,500.00$1,690,000.0010.10%Public$69,980.00$1,685, 000.0011.50%Private$219,400.00$1,676,000.007.60%Public$64 ,930.00$1,668,000.0011.70%Mean9.15%Median8.50% Week 2 For each of the 2 majors calculate the mean, median, minimum, maximum, range, and standard deviation for the columns ‘Cost’ and ’30-Year ROI Engineering Major Minimum $64,930.00 Maximum $230,100.00 Mean $164,680.00 Median $214,350.00 Standard Dev $66,385.12 Range $165,170.00 Business Major Minimum $87,030.00 Maximum $229,900.00 Mean $188,632.00 Median $215,200.00 Standard Dev $50,503.43 Range $142,870.00 By hand or with Excel, for each of the 2 majors calculate the probability that a college picked from the column for ‘School Type’ is ‘Private’.
  • 56. Engineering 11÷20=0.55=55 Business 16÷20=0.80=80 By hand or with Excel, for each of the 2 majors find the probability that a college with the ‘School Type’ ‘Private’ has a ’30-Year ROI’ between $1,500,000 and $1,800,000. Engineering 4÷11=0.36=36 Business 4÷16=.025=25