We at www.CapitalMind.in strive to give our readers a sense of what our Indian financial markets are and also offer a perspective not found anywhere else. The ever changing financial markets wait for no one. But, we do take the responisbility to churn the numbers and give our readers the gist to understand the markets much better.
As part of our efforts, here is the teaser of SparkPlug Report for the month of December 2015. The teaser holds a glimpse of what the actual SparkPlug report holds. The full report is more than a 100 pages of detailed analysis and is accessible to our Premium Members.
NOTE: Become a Capital Mind Premium Member and get access to our Premium content where we cover Macronomics, Optionalysis and several more financial areas. To get a glimpse of what we do, check this video at https://www.youtube.com/watch?v=vXbrt5zq0Qw
Our Premium Members have access to other reports like
1. Big Whales Report: Holds the details of where India's biggest financial investors are investing their money in. You can check out the sample of this report at
http://j.mp/bwhlesep15. While the teaser holds the financial investments of a few investors, our full fledged Big Whales report has the full financial investment information of 20 investors.
2. Insider Report: This report analyzes shareholding pattern for the period ending September 2015 for Indian listed companies. This report provides more information on Promoter, Public, Foreign Institutional Investors and Mutual Funds shareholding, with special details of big investors. This report is very helpful with any upcoming investment decisions. Access the sample report here: http://j.mp/inrprtsep15
If you are an investor in Indian stock markets or interested in Indian financial markets then you will love our detailed financial analytics and our in-depth analysis on Capital Markets, Macroeconomics and Trading. You can see our website at www.capitalmind.in
You can subscribe to our daily email newsletter at www.capitalmind.in and receive our in-depth articles on Macroeconomics, stock investigations, finance data visualizations, market metrics & analytics.
You can also subscribe to Capital Mind Premium wherein you can access our Premium Slack Channel where discussions on daily financial market conditions happen among our highly experienced investors and other members, our custom algorithms at Snap where you get to maintain your portfolio, exclusive access to our own Capital Mind Portfolio where we analyze the stocks we purchase based on our insights and you also get actionable insights on a daily basis.
You can also try our 30-Day FREE PREMIUM TRIAL through which you get access to our Premium content. This helps you in understanding our processes and help you in making a decision. Just visit www.capitalmind.in/subscribe and request a 30 Day Free Premium Trial. You will not be disappointed.
Visit us here: http://j.mp/capitalmindss
Beginners Guide to TikTok for Search - Rachel Pearson - We are Tilt __ Bright...
Sparkplug-Indian Automobile Sector Teaser Report for December 2015
1.
2. CAPITALMIND • (C) ALL RIGHTS RESERVED • capitalmind.in Dec'15 The SparkPlug Report 2
Capital Mind Premium: The Sparkplug Report
December 2015
A First Look at December's Auto Industry Sales Data
• Production stood at 1,829,148 units; a decline of –0.50% (YoY) or 9,199 units.
• Domestic Sales touched 1,502,314 units compared to 1,504,944 units during the same month of the previous year. This translated into a
decline of -0.17% (YoY) or 2,630 units.
• Exports had a massive impact with a decline of –7.49% (YoY). 311,007 units were exported in December compared to 336,178 units
during the same month of the previous year resulting in a decline of 25,171 units.
Here is what December looked like
4. CAPITALMIND • (C) ALL RIGHTS RESERVED • capitalmind.in Dec'15 The SparkPlug Report 4
Capital Mind Premium: The Sparkplug Report
December 2015
In The News
1. Ashok Leyland
• Due to heavy rains/floods in Chennai, the production activity was stopped at Company's Ennore manufacturing Unit, near Chennai, during
the following period:
s December 01, 2015 - Night shift only. December 02, 2015 to December 05, 2015 - All 3 shifts
s The Company has since started its regular operations from December 07, 2015 onwards
s The Company will be able to assess the insurance losses in due course, upon assessment done by the insurance Company
• The Company received an order for 680 Vehicles and Spare Parts, worth USD 50 Mn. (over Rs 330 crore) from the Ministry of Local
Government, Public Works and National Housing, Government of Republic of Zimbabwe.
2. Bajaj Auto
• The auto major has started undertaking test-runs of its proposed quadricycle 'Qute'.
s The vehicle has been well-received in other markets with a free-on-board (FoB) price tag of US$2,000 (around INR 1.35 lakh)
s The quadricycle is being exported to 13 countries
s The company has produced over 240 units during the current year (Apr-Jan) and exported 116 units
s Powered by a water-cooled DTSi 4 valve engine with a fuel efficiency of 36 km per litre, the quadricycle can reach a top speed of up
to 70 km an hour
s The definition of the quadricycle has got into a legal tangle with multiple petitions in various high courts and now in the Supreme
Court questioning the Centre’s process for creating a new vehicle segment
s The quadricycle has also drawn a lot of criticism, with many experts pointing out that it is not environment friendly and lacks safety
standards
5. CAPITALMIND • (C) ALL RIGHTS RESERVED • capitalmind.in Dec'15 The SparkPlug Report 5
Capital Mind Premium: The Sparkplug Report
December 2015
In The News
3. Hero MotoCorp
• The calendar year 2015 marked several milestones in Hero MotoCorp’s journey towards being a global two-wheeler powerhouse.
s Hero MotoCorp marked a historic milestone with the commencement of operations of its first overseas manufacturing facility at Villa
Rica, Colombia
s Hero MotoCorp, in Joint Venture with Magneti Marelli (MM), commenced operations at its first autonomous ‘Production and
Development Centre’ at Manesar, Haryana
s Hero MotoCorp launched two new scooters – the Maestro Edge & Duet – the first of its products developed by the inhouse R&D
team
s The company further strengthened its motorcycle portfolio with the launch of new Hero Xtreme Sports, Hero PassionPRO and Hero
SplendorPRO
s Hero HF Deluxe, the most popular commuter bike, became the third Hero product to join the million club by clocking 1 Million unit
sales in FY’15. The hugely popular Splendor and Passion have been million plus brands for many years.
s With the commencement of operations at the Hero Centre of Global Innovation and R&D at Jaipur in Rajasthan by Q3 FY’16, the
company is looking at fast-tracking the development of its innovation-led portfolio. The centre will house globally-renowned experts
who will be engaged in the development of Hero’s future product line-up.
4. Honda Motorcycle & Scooter India
• HMSI rounded-off a spectacular 2015 by announcing the start of sales of the new CB Hornet 160R in India. A faster, smarter, sportier
machine for Indian youth, the CB Hornet 160R was one of the most awaited motorcycles ever since it was first showcased in August’15 at
Honda RevFest.
6. CAPITALMIND • (C) ALL RIGHTS RESERVED • capitalmind.in Dec'15 The SparkPlug Report 6
Capital Mind Premium: The Sparkplug Report
December 2015
In The News
5. Mahindra & Mahindra
• Hit with the Supreme Court Ban order on sale of over 2000 cc Diesel vehicles, M&M is set to start using Petrol engines for all its vehicles
over the next 2-3 years.
• The company is all set to launch compact SUV the KUV-100 (Kool 1 double ‘oh’) launch on 15th January - the first mFalcon petrol
offering to take on Renault KWID & Maruti Swift. The company also launched the Imperio – a pick up SUV.
6. Maruti Suzuki India
• DZire, India’s best-selling sedan, now comes equipped with the celebrated Auto Gear Shift (AGS) technology. With this DZire becomes the
first diesel car - and the fourth model in Maruti Suzuki’s portfolio - to be offered with AGS technology.
s Auto Gear Shift (AGS) also known as Automated Manual Transmission is a revolutionary automobile transmission technology.
s The clutch-less or two-pedal technology makes driving very comfortable in the heavy city traffic conditions.
s Customers are free from changing gears and can enjoy the convenience of automatic driving at an affordable cost without
compromising on the fuel efficiency.
7. Royal Enfield (Unit of Eicher)
• Due to the rains, in November the company lost production of 4,000 motorcycles. Both the facilities in Thiruvottiyur and Oragadam were
shut between from 1-6 December due to which the company lost production of 7,200 motorcycles. Production of motorcycles resumed on
December 7, 2015 with the manufacturing facilities operating at 50% of the installed capacity. As of 14th of December, 2015, the plants
were back to normal and production was at 100% of the installed capacity.
7. CAPITALMIND • (C) ALL RIGHTS RESERVED • capitalmind.in Dec'15 The SparkPlug Report 7
Capital Mind Premium: The Sparkplug Report
December 2015
In The News
8. Tata Motors
• Launches new factory in Slovakia
s Jaguar Land Rover has confirmed that it will be the first British carmaker to open a manufacturing facility in Slovakia.
s The announcement follows an agreement between the company and the Government of the Slovak Republic to build a new plant in
the city of Nitra, western Slovakia.
s The new world-class £1 billion premium manufacturing facility will eventually employ around 2,800 people
• Here are the numbers for the Tata Group
s The Tata Motors Group global wholesales in December 2015, including Jaguar Land Rover, were at 91,762 nos., higher by 7%, over
December 2014. Cumulative wholesales for this fiscal were at 754,307 nos., higher by 6% over the last fiscal.
s Global wholesales of all Tata Motors’ commercial vehicles and Tata Daewoo range in December 2015 were 32,475 nos., higher by 6%,
compared to December 2014. Cumulative commercial vehicles wholesales for this fiscal declined by 1% over the last fiscal at 273,485
nos.
s Global wholesales for Jaguar Land Rover were 50,972 vehicles (Includes CJLR* wholesales). Jaguar wholesales for the month were
8,784 vehicles and cumulative wholesales were 69,913 vehicles, while Land Rover wholesales for the month were 42,188 vehicles and
cumulative wholesales were 3,11,745 vehicles. Cumulative wholesales for Jaguar Land Rover for the fiscal were 3,81,658 vehicles.
8. This is how the companies stack up!
(% change YoY)
CAPITALMIND • (C) ALL RIGHTS RESERVED • capitalmind.in Dec'15 The SparkPlug Report 8
Company Production Domestic Exports
Ashok Leyland
12,016
↑ 48.51%
11,299
↑ 43.53%
855
↓ -38.53%
Atul Auto
3,968
↑ 6.70%
3,950
↑ 11.42%
55
↓ -66.26%
Bajaj Auto
281,854
↓ -1.12%
143,526
↑ 16.58%
145,463
↓ -12.44%
Fiat India
312
↓ -16.80%
792
↓ -1.37%
0
↓ -100.00%
Force Motors
2,003
↑ 27.17%
1,768
↑ 10.57%
19
↓ 0.00%
Ford India
4,558
↓ -38.34%
5,924
↑ 55.44%
4,941
↓ -53.59%
General Motors
1,209
↓ -56.29%
2,515
↓ -19.80%
7,165
↑ 1383.44%
Hero MotoCorp
537,041
↑ 0.17%
476,012
↓ -6.04%
23,653
↑ 21.63%
Honda Cars
12,197
↓ -22.48%
12,379
↓ -14.20%
364
↓ -41.29%
Honda Motorcycle & Scooter India
302,439
↓ -15.08%
290,540
↓ -9.02%
16,067
↓ -5.16%
Hyundai Motor India
58,640
↑ 2.32%
41,861
↑ 28.79%
22,273
↓ -17.16%
India Yamaha Motor
56,722
↑ 14.05%
38,833
↓ -12.95%
12,516
↓ -15.63%
Mahindra & Mahindra
40,877
↑ 25.50%
34,839
↑ 1.10%
3,076
↑ 64.67%
Mahindra Two Wheelers
14,046
↑ 0.45%
10,488
↓ -18.29%
1,624
↑ 166.23%
Company Production Domestic Exports
Maruti Suzuki India
107,707
↑ 12.90%
111,333
↑ 13.48%
7,816
↓ -33.09%
Nissan Motor India
9,879
↓ -29.33%
3,066
↓ -2.85%
8,734
↓ -25.66%
Piaggio Vehicles
14,615
↓ -3.63%
13,500
↑ 0.20%
864
↓ -52.24%
Renault India
6,861
↑ 294.08%
10,292
↑ 160.16%
0
↓ -100.00%
Royal Enfield (Unit of Eicher)
42,367
↑ 45.32%
40,037
↑ 42.08%
416
↓ -8.57%
SML Isuzu
1,629
↑ 75.16%
786
↓ -22.49%
91
↑ 54.24%
Suzuki Motorcycle
28,895
↓ -12.48%
21,119
↓ -12.04%
5,779
↑ 12.94%
TVS Motor Company
217,677
↑ 3.77%
169,315
↑ 4.91%
32,771
↓ -0.60%
Tata Motors
37,000
↑ 7.85%
35,416
↓ -6.25%
4,557
↑ 15.13%
Toyota Kirloskar Motor
12,820
↓ -9.48%
10,446
↓ -11.02%
447
↓ -76.32%
VECVs - Eicher
4,672
↑ 82.71%
4,109
↑ 36.88%
837
↑ 117.40%
VECVs - Volvo
71
↓ -34.86%
117
↑ 2.63%
0
↓ 0.00%
Volkswagen India
23,572
↑ 9.92%
5,154
↓ -36.73%
18,514
↑ 88.11%
9. CAPITALMIND • (C) ALL RIGHTS RESERVED • capitalmind.in Dec'15 The SparkPlug Report 9
10. CAPITALMIND • (C) ALL RIGHTS RESERVED • capitalmind.in Dec'15 The SparkPlug Report 10
Capital Mind Premium: The Sparkplug Report
December 2015
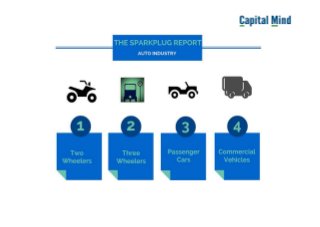
What Follows
What follows is charts of each company's production, domestic sales and exports, compared to last year, for the first nine months of the year.
We have divided this into sections for:
• Two wheelers
• Three wheelers
• Passenger vehicles (Cars, SUVs)
• Commercial vehicles (Trucks, Buses)
We summarize each section as a whole in the beginning and then provide charts for each company.
All data is sourced from SIAM. Charts are by Capital Mind.
Disclaimer: While we have made all efforts to ensure that the data is clean and correct, we cannot vouch for the authenticity of this data and
whether it will reflect accurately in company books, due to the secondary nature which involves company releases to SIAM and then onward
to us. These numbers are not audited. We do not recommend the use of this information for trading or speculation in stocks, and none of
this is investment advice.
12. TWO WHEELERS
CAPITALMIND • (C) ALL RIGHTS RESERVED • capitalmind.in Dec'15 The SparkPlug Report 12
1484187
1598895
1443861
1577334
1541304
1785560
1608220
1561587
1465439
1488509
1560164
1486580
1602348
1546310
1730992
1830239
1418592
1435482
Apr May Jun Jul Aug Sep Oct Nov Dec
0
500000
1000000
1500000
PRODUCTION
-2014 -2015
1289183
1398376
1262883
1298694
1345506
1553608
1461712
1301434
1204942
1287064
1380950
1307710
1300457
1305350
1537137
1656235
1320561
1167633
Apr May Jun Jul Aug Sep Oct Nov Dec
0
500000
1000000
1500000
DOMESTIC SALES
-2014 -2015
194931
213973
182232
222583
233551
229118
214911
228652
222184
184661
211820
231008
237708
251182
233302
189698
189490
214588
Apr May Jun Jul Aug Sep Oct Nov Dec
0
50000
100000
150000
200000
250000
EXPORTS
-2014 -2015
-5%
0%
5%
10%
0.29%
-2.42%
2.96%
1.59%
0.32%
-3.06%
13.81%
-9.16%
-2.04%
YoY GROWTH
Apr May Jun Jul Aug Sep Oct Nov Dec
0%
5%
10%
-0.16%
-1.25%
3.55%
0.14%
-2.98%
-1.06%
13.31%
1.47%
-3.10%
YoY GROWTH
Apr May Jun Jul Aug Sep Oct Nov Dec
-10%
0%
10%
20%
-5.27%
-1.01%
26.77%
6.80% 7.55%
1.83%
-11.73%
-17.13%
-3.42%
YoY GROWTH
Apr May Jun Jul Aug Sep Oct Nov Dec
13. CAPITALMIND • (C) ALL RIGHTS RESERVED • capitalmind.in Dec'15 The SparkPlug Report 13
Capital Mind Premium: The Sparkplug Report
December 2015
Two Wheelers
How did this segment fare? Let's take a look at the segment analysis; the sub-segment and each of the constituents:
Segment Analysis:
• Production increased from 1,465,439 units to 1,829,148 units resulting in a growth of +24.82% (YoY). This would be the best growth in
% terms for the complete year. December also was the month with the 2nd highest production – a shortfall of 1091 units compared to
the October production.
• Domestic Sales grew from 1,204,942 units to 1,502,314 units resulting in a growth of +24.68% (YoY
• Exports declined from 222,184 units to 214,588 units resulting in a decline of –3.42% (YoY). This is the 3rd month in a row that Exports
have declined.
• All this translated into an overall sales decline of –3.15% (YoY) – worst for the current year.
14. CAPITALMIND • (C) ALL RIGHTS RESERVED • capitalmind.in Dec'15 The SparkPlug Report 14
Capital Mind Premium: The Sparkplug Report
December 2015
Sub-Segment Analysis:
Scooters (Models include: Maestro, Hero Duet, Activa and others):
• Faring better than Motorcycles, Scooters brought in a growth of +4.85% (YoY) in Overall Sales by clocking in 413,628 units compared to
394,477 units from the previous year.
• Domestic Sales stood at 386,305 units with a growth of +3.12% (YoY).
• Exports also were in the green at 27,323 units compared to 19,876 units resulting in a massive growth of +37.47% (YoY). After 3
continuous months of decline in Exports, Scooters also had the highest exports in December during the whole year.
Motorcycles (Models include: Discover, Splendor, CB Twister and others):
• Motorcycles did not fare well as compared to Scooters. Overall Sales declined at -6.31% (YoY) – second worst month after July. 911,052
units were sold compared to 972,361 units; a fall of 61,309 units.
• Domestic Sales touched 724,807 units compared to 770,519 units translating into a decline of –5.93% (YoY).
• Exports were in the red for the third consecutive month with 186,245 units being exported compared to 201,842 units, thereby
registering a decline of –7.73% (YoY).
Note: The sub-segment - Mopeds is constituted by a single model i.e. TVS XL Super and hence the sub-segment analysis is not being
included here.
15. CAPITALMIND • (C) ALL RIGHTS RESERVED • capitalmind.in Dec'15 The SparkPlug Report 15
Capital Mind Premium: The Sparkplug Report
December 2015
Constituent Analysis:
• Outliers (manufacturer with the highest growth):
• Production: +45.32% (YoY) - Royal Enfield (Unit of Eicher)
• Domestic Sales: +42.08% (YoY) - Royal Enfield (Unit of Eicher)
• Exports: +2540.0% (YoY) – Piaggio Vehicles
• Total Overall Sales: +41.28% (YoY) - Royal Enfield (Unit of Eicher)
• Bajaj Auto continues to lose market share to other players. Production was at its lowest for the year at 242,785 units compared to
244,222 units a year ago during the same period. Domestic Sales stood at +12.54% (YoY) – the only manufacturer after Royal Enfield to
clock in double digit growth. Exports were down at –8.51% (YoY). Its market share remained the same. Bajaj currently dominates the
segment (Engine Capacity >125 cc but less than equal to 150 cc) with its iconic Boxer, Discover, and Pulsar and segment (Engine Capacity
>200 cc but less than equal to 250 cc) with its Pulsar, Avenger, Ninja, and KTM.
• Hero MotoCorp – clocking an Overall Sales of 499,665 units – third lowest for the year, sales declined by –5.02% (YoY). Domestic Sales
fell from 506,632 units 476,012 units. Exports made a huge comeback with a growth of +21.63% (YoY) ending the streak of 4
continuous months in the red. Hero continues to dominate the segment (Engine Capacity >75 cc but less than equal to 110 cc) – Over 3
lakh Splendors and Passions were sold while Bajaj managed to sell a little over 1.26 lakh units.
• Honda Motorcycle & Scooter India (HMSI) with all figures were in the red, Domestic Sales stood at –9.02% (YoY), and Exports stood at
–5.16% (YoY). December turned better than November but it was also the second worst month with an overall sales decline of –8.83%
(YoY). HMSI continues to dominate the segment (Engine capacity >90 cc but less than or equal to 125 cc) – Over 2 lakh Activa and Dios
were sold while Hero managed to sell a little over 93k units.
• Royal Enfield continued to outperform its estimates. Suffering a huge setback in targets due to the November and December rains. The
company lost over 11,000 units and for the most part of the first half of December, the factory was running at a 50% capacity. Overall
Sales stood at +41.28% (YoY) – lowest during the current year. Exports were down –8.57% (YoY). To compensate for the losses, the
company Exported 416 units compared to an avg. of 700 units (Apr-Nov). The company competes with Harley Davidson under the Engine
Capacity >500 cc but less than equal to 800 cc category.
16. Hero MotoCorp
(Number of Vehicles)
CAPITALMIND • (C) ALL RIGHTS RESERVED • capitalmind.in Dec'15 The SparkPlug Report - [TWO WHEELERS] 16
567949
602483
536122
554110
534037
620984
561612
554436
536140
548854
578094
510875
502847
476085
584944
661756
506361
537041
Apr May Jun Jul Aug Sep Oct Nov Dec
0
200000
400000
600000
PRODUCTION
-2014 -2015
558556
589360
530560
516661
535503
580882
550688
521001
506632
525051
560222
515279
465101
460557
589644
625031
538180
476012
Apr May Jun Jul Aug Sep Oct Nov Dec
0
200000
400000
600000
DOMESTIC SALES
-2014 -2015
12498
13123
11034
13201
23106
23170
24368
26412
19447
8240
9978
27083
22479
19980
17100
14771
12551
23653
Apr May Jun Jul Aug Sep Oct Nov Dec
0
5000
10000
15000
20000
25000
EXPORTS
-2014 -2015
-10%
-5%
0%
5%
10%
15%
-3.36%-4.05%-4.71%
-9.25%
-10.85%
-5.80%
17.83%
-8.67%
0.17%
YoY GROWTH
Apr May Jun Jul Aug Sep Oct Nov Dec
-10%
-5%
0%
5%
10%
-6.00%
-4.94%
-2.88%
-9.98%
-14.00%
1.51%
13.50%
3.30%
-6.04%
YoY GROWTH
Apr May Jun Jul Aug Sep Oct Nov Dec
-50%
0%
50%
100%
-34.07%
-23.97%
145.45%
70.28%
-13.53%
-26.20%
-39.38%
-52.48%
21.63%
YoY GROWTH
Apr May Jun Jul Aug Sep Oct Nov Dec
38.27 %
37.68 %
37.13 %
35.13 %
34.65 %
34.78 %
34.92 %
35.50 %
36.59 %
36.87 %
37.05 %
34.37 %
31.38 %
30.79 %
33.79 %
36.16 %
35.69 %
37.41 %
Apr'14
May'14
Jun'14
Jul'14
Aug'14
Sep'14
Oct'14
Nov'14
Dec'14
Apr'15
May'15
Jun'15
Jul'15
Aug'15
Sep'15
Oct'15
Nov'15
Dec'15
0 10 20 30
MARKET SHARE
43.33 %
42.15 %
42.01 %
39.78 %
39.80 %
37.39 %
37.67 %
40.03 %
42.05 %
40.79 %
40.57 %
39.40 %
35.76 %
35.28 %
38.36 %
37.74 %
40.75 %
40.77 %
Apr'14
May'14
Jun'14
Jul'14
Aug'14
Sep'14
Oct'14
Nov'14
Dec'14
Apr'15
May'15
Jun'15
Jul'15
Aug'15
Sep'15
Oct'15
Nov'15
Dec'15
0 10 20 30 40
MARKET SHARE
6.41 %
6.13 %
6.05 %
5.93 %
9.89 %
10.11 %
11.34 %
11.55 %
8.75 %
4.46 %
4.71 %
11.72 %
9.46 %
7.95 %
7.33 %
7.79 %
6.62 %
11.02 %
Apr'14
May'14
Jun'14
Jul'14
Aug'14
Sep'14
Oct'14
Nov'14
Dec'14
Apr'15
May'15
Jun'15
Jul'15
Aug'15
Sep'15
Oct'15
Nov'15
Dec'15
0 2 4 6 8 10
MARKET SHARE
17. Honda Motorcycle & Scooter India
(Number of Vehicles)
CAPITALMIND • (C) ALL RIGHTS RESERVED • capitalmind.in Dec'15 The SparkPlug Report - [TWO WHEELERS] 17
323138
350809
325777
395712
380913
426151
363397
370074
356161
366645
353277
321881
413067
396801
420828
405309
319179
302439
Apr May Jun Jul Aug Sep Oct Nov Dec
0
100000
200000
300000
400000
PRODUCTION
-2014 -2015
301978
342136
309387
363977
370871
420600
361670
353743
319349
328994
353409
331859
371349
373169
411645
431887
311946
290540
Apr May Jun Jul Aug Sep Oct Nov Dec
0
100000
200000
300000
400000
DOMESTIC SALES
-2014 -2015
11928
13403
13765
17435
17152
17900
15359
18027
16942
11699
13787
17015
18257
22060
19089
16975
14391
16067
Apr May Jun Jul Aug Sep Oct Nov Dec
0
5000
10000
15000
20000
EXPORTS
-2014 -2015
-15%
-10%
-5%
0%
5%
10%
13.46%
0.70%
-1.20%
4.39% 4.17%
-1.25%
11.53%
-13.75%
-15.08%
YoY GROWTH
Apr May Jun Jul Aug Sep Oct Nov Dec
-10%
0%
10%
8.95%
3.29%
7.26%
2.03%
0.62%
-2.13%
19.41%
-11.82%
-9.02%
YoY GROWTH
Apr May Jun Jul Aug Sep Oct Nov Dec
-20%
-10%
0%
10%
20%
-1.92%
2.87%
23.61%
4.71%
28.61%
6.64%
10.52%
-20.17%
-5.16%
YoY GROWTH
Apr May Jun Jul Aug Sep Oct Nov Dec
21.77 %
21.94 %
22.56 %
25.09 %
24.71 %
23.87 %
22.60 %
23.70 %
24.30 %
24.63 %
22.64 %
21.65 %
25.78 %
25.66 %
24.31 %
22.15 %
22.50 %
21.07 %
Apr'14
May'14
Jun'14
Jul'14
Aug'14
Sep'14
Oct'14
Nov'14
Dec'14
Apr'15
May'15
Jun'15
Jul'15
Aug'15
Sep'15
Oct'15
Nov'15
Dec'15
0 5 10 15 20 25
MARKET SHARE
23.42 %
24.47 %
24.50 %
28.03 %
27.56 %
27.07 %
24.74 %
27.18 %
26.50 %
25.56 %
25.59 %
25.38 %
28.56 %
28.59 %
26.78 %
26.08 %
23.62 %
24.88 %
Apr'14
May'14
Jun'14
Jul'14
Aug'14
Sep'14
Oct'14
Nov'14
Dec'14
Apr'15
May'15
Jun'15
Jul'15
Aug'15
Sep'15
Oct'15
Nov'15
Dec'15
0 5 10 15 20 25
MARKET SHARE
6.12 %
6.26 %
7.55 %
7.83 %
7.34 %
7.81 %
7.15 %
7.88 %
7.63 %
6.34 %
6.51 %
7.37 %
7.68 %
8.78 %
8.18 %
8.95 %
7.59 %
7.49 %
Apr'14
May'14
Jun'14
Jul'14
Aug'14
Sep'14
Oct'14
Nov'14
Dec'14
Apr'15
May'15
Jun'15
Jul'15
Aug'15
Sep'15
Oct'15
Nov'15
Dec'15
0 2 4 6 8
MARKET SHARE
19. THREE WHEELERS
CAPITALMIND • (C) ALL RIGHTS RESERVED • capitalmind.in Dec'15 The SparkPlug Report 19
62188
68923
76514
87798
88309
95001
87380
91220
75588
77076
74046
75088
84620
85467
96377
90942
69583
71836
Apr May Jun Jul Aug Sep Oct Nov Dec
0
20000
40000
60000
80000
PRODUCTION
-2014 -2015
33446
40425
47383
51462
52550
56948
52307
41755
39917
32666
36500
43875
45151
46124
49524
52361
45235
46881
Apr May Jun Jul Aug Sep Oct Nov Dec
0
10000
20000
30000
40000
50000
DOMESTIC SALES
-2014 -2015
26528
30285
30593
37198
39183
36370
35315
42337
37785
47548
38743
36119
38283
41638
44730
32188
27631
25995
Apr May Jun Jul Aug Sep Oct Nov Dec
0
10000
20000
30000
40000
EXPORTS
-2014 -2015
-20%
-10%
0%
10%
20%
23.94%
7.43%
-1.86%
-3.62%-3.22%
1.45%
4.08%
-23.72%
-4.96%
YoY GROWTH
Apr May Jun Jul Aug Sep Oct Nov Dec
-10%
0%
10%
-2.33%
-9.71%
-7.40%
-12.26%-12.23%-13.04%
0.10%
8.33%
17.45%
YoY GROWTH
Apr May Jun Jul Aug Sep Oct Nov Dec
-20%
0%
20%
40%
60%
79.24%
27.93%
18.06%
2.92% 6.27%
22.99%
-8.85%
-34.74%
-31.20%
YoY GROWTH
Apr May Jun Jul Aug Sep Oct Nov Dec
20. CAPITALMIND • (C) ALL RIGHTS RESERVED • capitalmind.in Dec'15 The SparkPlug Report 20
Capital Mind Premium: The Sparkplug Report
December 2015
Three Wheelers
How did this segment fare? Let's take a look at the segment analysis; the sub-segment and each of the constituents:
Segment Analysis:
• Production fell from 75,588 units to 71,836 units resulting in a decline of –4.96% (YoY)
• Domestic Sales continued its third month into the positive from 39,917 units to 46,881 units resulting in a growth of just +17.45% (YoY)
– this has been the best growth so far for the current year.
• Exports declined from 37,785 units to 25,995 units resulting in a decline of –31.20% (YoY)
• All this translated into an overall sales decline of –6.21% (YoY) – same as the previous month.
21. CAPITALMIND • (C) ALL RIGHTS RESERVED • capitalmind.in Dec'15 The SparkPlug Report 21
Capital Mind Premium: The Sparkplug Report
December 2015
Constituent Analysis:
• Outliers (manufacturer with the highest growth):
• Production: +6.70% (YoY) – Atul Auto
• Domestic Sales: +43.31% (YoY) – Bajaj Auto
• Exports: None – all companies in the red
• Total Overall Sales: +8.10% (YoY) – Force Motors – the only company in the green
• Bajaj Auto – the leader in Passenger three wheelers, led the field with the third consecutive positive month of the year. Domestic Sales
witnessed a growth of +43.31% (YoY) – best of the year so far. However, Exports did not fare well at –32.87% (YoY). This only helped
the company eat into rival Piaggio Vehicles market share. Bajaj increased its market share from 53.14% in November to 56.54% in
December.
• Force Motors continued its focus on the International Markets. The company Exported 180 units compared to just 216 units during the
same month of the previous year.
• Piaggio Vehicles lost 3% of its market share. While Domestic Sales broke into the positive for the first time in the year at +0.20% (YoY),
Exports took a massive hit at –52.24% (YoY) – the worst for the year so far.
• TVS Motors gained +0.44% in market share. Domestic Sales stood at –21.59% (YoY) – this has been the bad year (other than July at
+0.65%). Exports were in the red at –18.40% (YoY).
22. Bajaj Auto
(Number of Vehicles)
CAPITALMIND • (C) ALL RIGHTS RESERVED • capitalmind.in Dec'15 The SparkPlug Report - [THREE WHEELERS] 22
32240
37604
43364
50134
50851
53708
47705
51143
40832
46850
43156
41426
48178
49033
56761
49129
36718
39069
Apr May Jun Jul Aug Sep Oct Nov Dec
0
10000
20000
30000
40000
50000
PRODUCTION
-2014 -2015
13941
18980
22701
24484
24366
25988
23189
15877
16191
14122
15946
20647
21870
22359
22888
23135
19695
23204
Apr May Jun Jul Aug Sep Oct Nov Dec
0
5000
10000
15000
20000
25000
DOMESTIC SALES
-2014 -2015
17952
19436
20562
26967
28172
26452
25905
31434
26820
36361
27630
23088
25928
29170
31284
20918
19026
18003
Apr May Jun Jul Aug Sep Oct Nov Dec
0
10000
20000
30000
EXPORTS
-2014 -2015
-20%
0%
20%
40%
45.32%
14.76%
-4.47%-3.90%-3.58%
5.68%
2.99%
-28.21%
-4.32%
YoY GROWTH
Apr May Jun Jul Aug Sep Oct Nov Dec
-10%
0%
10%
20%
30%
40%
1.30%
-15.99%
-9.05%-10.68%
-8.24%
-11.93%
-0.23%
24.05%
43.31%
YoY GROWTH
Apr May Jun Jul Aug Sep Oct Nov Dec
0%
50%
100%
102.55%
42.16%
12.28%
-3.85%
3.54%
18.27%
-19.25%
-39.47%
-32.87%
YoY GROWTH
Apr May Jun Jul Aug Sep Oct Nov Dec
51.84 %
54.56 %
56.67 %
57.10 %
57.58 %
56.53 %
54.59 %
56.07 %
54.02 %
60.78 %
58.28 %
55.17 %
56.93 %
57.37 %
58.89 %
54.02 %
52.77 %
54.39 %
Apr'14
May'14
Jun'14
Jul'14
Aug'14
Sep'14
Oct'14
Nov'14
Dec'14
Apr'15
May'15
Jun'15
Jul'15
Aug'15
Sep'15
Oct'15
Nov'15
Dec'15
0 20 40 60
MARKET SHARE
41.68 %
46.95 %
47.91 %
47.58 %
46.37 %
45.63 %
44.33 %
38.02 %
40.56 %
43.23 %
43.69 %
47.06 %
48.44 %
48.48 %
46.22 %
44.18 %
43.54 %
49.50 %
Apr'14
May'14
Jun'14
Jul'14
Aug'14
Sep'14
Oct'14
Nov'14
Dec'14
Apr'15
May'15
Jun'15
Jul'15
Aug'15
Sep'15
Oct'15
Nov'15
Dec'15
0 10 20 30 40
MARKET SHARE
67.67 %
64.18 %
67.21 %
72.50 %
71.90 %
72.73 %
73.35 %
74.25 %
70.98 %
76.47 %
71.32 %
63.92 %
67.73 %
70.06 %
69.94 %
64.99 %
68.86 %
69.26 %
Apr'14
May'14
Jun'14
Jul'14
Aug'14
Sep'14
Oct'14
Nov'14
Dec'14
Apr'15
May'15
Jun'15
Jul'15
Aug'15
Sep'15
Oct'15
Nov'15
Dec'15
0 20 40 60
MARKET SHARE
23. Piaggio Vehicles
(Number of Vehicles)
CAPITALMIND • (C) ALL RIGHTS RESERVED • capitalmind.in Dec'15 The SparkPlug Report - [THREE WHEELERS] 23
14851
14764
16933
18468
18880
19723
18652
18700
15165
13731
14079
15236
16168
15680
16604
18280
16223
14615
Apr May Jun Jul Aug Sep Oct Nov Dec
0
5000
10000
15000
PRODUCTION
-2014 -2015
12297
12584
14372
15846
16565
17756
16723
14771
13473
11242
12403
13216
12895
12896
14663
16306
14567
13500
Apr May Jun Jul Aug Sep Oct Nov Dec
0
5000
10000
15000
DOMESTIC SALES
-2014 -2015
2503
2536
2353
2439
2597
2135
1738
2817
1809
2134
2259
2827
3030
2512
2479
1817
2022
864
Apr May Jun Jul Aug Sep Oct Nov Dec
0
1000
2000
3000
EXPORTS
-2014 -2015
-15%
-10%
-5%
-7.54%
-4.64%
-10.02%
-12.45%
-16.95%
-15.81%
-1.99%
-13.25%
-3.63%
YoY GROWTH
Apr May Jun Jul Aug Sep Oct Nov Dec
-20%
-15%
-10%
-5%
0%
-8.58%
-1.44%
-8.04%
-18.62%
-22.15%
-17.42%
-2.49%
-1.38%
0.20%
YoY GROWTH
Apr May Jun Jul Aug Sep Oct Nov Dec
-40%
-20%
0%
20%
-14.74%
-10.92%
20.14%
24.23%
-3.27%
16.11%
4.55%
-28.22%
-52.24%
YoY GROWTH
Apr May Jun Jul Aug Sep Oct Nov Dec
23.88 %
21.42 %
22.13 %
21.03 %
21.38 %
20.76 %
21.35 %
20.50 %
20.06 %
17.81 %
19.01 %
20.29 %
19.11 %
18.35 %
17.23 %
20.10 %
23.31 %
20.34 %
Apr'14
May'14
Jun'14
Jul'14
Aug'14
Sep'14
Oct'14
Nov'14
Dec'14
Apr'15
May'15
Jun'15
Jul'15
Aug'15
Sep'15
Oct'15
Nov'15
Dec'15
0 5 10 15 20
MARKET SHARE
36.77 %
31.13 %
30.33 %
30.79 %
31.52 %
31.18 %
31.97 %
35.38 %
33.75 %
34.41 %
33.98 %
30.12 %
28.56 %
27.96 %
29.61 %
31.14 %
32.20 %
28.80 %
Apr'14
May'14
Jun'14
Jul'14
Aug'14
Sep'14
Oct'14
Nov'14
Dec'14
Apr'15
May'15
Jun'15
Jul'15
Aug'15
Sep'15
Oct'15
Nov'15
Dec'15
0 10 20 30
MARKET SHARE
9.44 %
8.37 %
7.69 %
6.56 %
6.63 %
5.87 %
4.92 %
6.65 %
4.79 %
4.49 %
5.83 %
7.83 %
7.91 %
6.03 %
5.54 %
5.64 %
7.32 %
3.32 %
Apr'14
May'14
Jun'14
Jul'14
Aug'14
Sep'14
Oct'14
Nov'14
Dec'14
Apr'15
May'15
Jun'15
Jul'15
Aug'15
Sep'15
Oct'15
Nov'15
Dec'15
0 2 4 6 8
MARKET SHARE
25. PASSENGER VEHICLES
CAPITALMIND • (C) ALL RIGHTS RESERVED • capitalmind.in Dec'15 The SparkPlug Report 25
258360
268866
234946
277309
260882
286056
242141
281234
246152
286453
270086
258630
302958
289744
289163
296359
252203
256170
Apr May Jun Jul Aug Sep Oct Nov Dec
0
100000
200000
300000
PRODUCTION
-2014 -2015
188162
207953
218828
199562
213938
223584
221163
212437
209086
217949
217671
217642
222368
222476
232167
268629
236664
230960
Apr May Jun Jul Aug Sep Oct Nov Dec
0
50000
100000
150000
200000
250000
DOMESTIC SALES
-2014 -2015
41764
48017
51533
55492
53052
57752
48637
56214
69356
50479
51552
40343
60216
59568
57421
59255
51381
61570
Apr May Jun Jul Aug Sep Oct Nov Dec
0
20000
40000
60000
EXPORTS
-2014 -2015
-10%
0%
10%
20%
10.87%
0.45%
10.08%9.25%
11.06%
1.09%
22.39%
-10.32%
4.07%
YoY GROWTH
Apr May Jun Jul Aug Sep Oct Nov Dec
0%
5%
10%
15%
20%
15.83%
4.67%
-0.54%
11.43%
3.99% 3.84%
21.46%
11.40%
10.46%
YoY GROWTH
Apr May Jun Jul Aug Sep Oct Nov Dec
-20%
-10%
0%
10%
20%
20.87%
7.36%
-21.71%
8.51%
12.28%
-0.57%
21.83%
-8.60%
-11.23%
YoY GROWTH
Apr May Jun Jul Aug Sep Oct Nov Dec
26. CAPITALMIND • (C) ALL RIGHTS RESERVED • capitalmind.in Dec'15 The SparkPlug Report 26
Capital Mind Premium: The Sparkplug Report
December 2015
Passenger Vehicles (Passenger Cars + Utility Vehicles + Vans)
How did this segment fare? Let's take a look at the segment analysis; the sub-segment and each of the constituents:
Segment Analysis:
• Production increased from 246,152 units to 256,170 units resulting in a growth of +4.07% (YoY)
• Domestic Sales grew from 209,086 units to 230,960 units resulting in a growth of +10.46% (YoY)
• Exports continued its second month in the red from 69,356 units to 61,570 units resulting in a decline of –11.23% (YoY). All this
translated into an overall sales growth of +5.06% (YoY)
Sub-Segment Analysis:
Passenger Cars (Models include: KWID, M800, Micra, Nano, Polo, Santro, Spark, and others):
• PC brought in a growth of +12.87% (YoY) in Domestic Sales churning in 172,671 units from the previous year of 152,986 units
• UVs and Vans beat PCs in Exports with the latter falling into the negative at –16.45% (YoY) from 60,407 units to 50,468 units
Utility Vehicles (Models include: Bolero, Creta, Eco sport, Force One, Terrano, Thar and others):
• Domestic Sales stood at +4.18% (YoY) – 44,874 units were sold compared to 43,074 units; an addition of 1,800 units.
• Exports fared better at +22.59% (YoY) - mainly contributed by Hyundai Creta, Maruti Ertiga, S-Cross and M&M Bolero & TUV300. Exports
stood at 8,887 units compared to 10,895 units - an overall increase of 2,000 units.
27. CAPITALMIND • (C) ALL RIGHTS RESERVED • capitalmind.in Dec'15 The SparkPlug Report 27
Capital Mind Premium: The Sparkplug Report
December 2015
Constituent Analysis:
• Outliers (manufacturer with the highest growth):
• Production: +294.08% (YoY) - Renault India
• Domestic Sales: +211.76% (YoY) – Isuzu Motors
• Exports: +1383.44% (YoY) - General Motors
• Total Overall Sales: +211.76% (YoY) - Isuzu Motors
• Market leader Maruti Suzuki lost over 1% of its market share. Domestic Sales stood at +13.48% (YoY) i.e. 111,333 units were sold
compared to 98,109 units for the same period of the previous year. Exports too a massive hit with the year’s low at -33.09% (YoY) from
11,682 units to 7,816 units. The company is desperately trying to protect its market share from rivals such as Hyundai Motors (i10, Getz,
i20, Grand i10, Xcent, Elite i20) and Toyota’s Etios.
• Utility Vehicle’s manufacturer Mahindra & Mahindra has started losing its market share. Taking a hit due to the Supreme Court ruling on
>2000cc Diesel Vehicles (NCR alone accounts for 2% of its sales), Domestic Sales growth stood at +1.21% (YoY) while Exports broke into
the green at +3.04% (YoY). The company hopes to recover most of this with this KUV100 launch – the first mFalcon petrol offering to
take on its rivals. The company also plans to introduce Petrol versions of all its Diesel variants in the next 2-3 years.
• Renault India rides the successful launch of its SUV – Duster and PC – KWID. The company has taken on both M&M in the SUV segment
and Maruti’s iconic Alto & Swift in the PC segment. The company is yet to enter the higher mid range of segment that Honda currently
dominates. Domestic Sales stood at 160.16% (YoY) i.e. 10,292 units were sold compared to 3,956 units for the same period of the
previous year. The company did not Export a single unit of its production in India and rather has decided to focus on the Indian Market
(like Force Motors). December was also the best month of the year so far.
29. PASSENGER CARS
CAPITALMIND • (C) ALL RIGHTS RESERVED • capitalmind.in Dec'15 The SparkPlug Report 29
190252
202842
176924
204224
197824
209284
177064
210213
195847
213732
202893
196583
227197
215372
211208
212954
187611
194266
Apr May Jun Jul Aug Sep Oct Nov Dec
0
50000
100000
150000
200000
PRODUCTION
-2014 -2015
135054
148577
160232
137922
153781
154898
159408
156811
152986
159548
160067
162677
162022
163093
169590
194158
173111
172671
Apr May Jun Jul Aug Sep Oct Nov Dec
0
50000
100000
150000
DOMESTIC SALES
-2014 -2015
35154
41592
46036
48491
46587
51003
43463
48871
60407
42815
45015
35957
51719
46579
44958
47398
40390
50468
Apr May Jun Jul Aug Sep Oct Nov Dec
0
20000
40000
60000
EXPORTS
-2014 -2015
-10%
0%
10%
20%
12.34%
0.03%
11.11%11.25%
8.87%
0.92%
20.27%
-10.75%
-0.81%
YoY GROWTH
Apr May Jun Jul Aug Sep Oct Nov Dec
5%
10%
15%
20% 18.14%
7.73%
1.53%
17.47%
6.06%
9.48%
21.80%
10.39%
12.87%
YoY GROWTH
Apr May Jun Jul Aug Sep Oct Nov Dec
-20%
-10%
0%
10%
20%
21.79%
8.23%
-21.89%
6.66%
-0.02%
-11.85%
9.05%
-17.35%-16.45%
YoY GROWTH
Apr May Jun Jul Aug Sep Oct Nov Dec
30. Hyundai Motor India
(Number of Vehicles)
CAPITALMIND • (C) ALL RIGHTS RESERVED • capitalmind.in Dec'15 The SparkPlug Report - [PASSENGER CARS] 30
48865
46361
52810
53750
51335
53553
45565
52704
57204
53392
44362
55498
49504
48300
49620
48878
41647
47889
Apr May Jun Jul Aug Sep Oct Nov Dec
0
10000
20000
30000
40000
50000
PRODUCTION
-2014 -2015
35110
35955
33258
29067
33593
34906
37894
35448
32429
38474
37328
34542
29599
32985
35193
39709
37771
37101
Apr May Jun Jul Aug Sep Oct Nov Dec
0
10000
20000
30000
DOMESTIC SALES
-2014 -2015
14974
15513
17004
18739
14361
16430
18009
18779
26887
12904
15064
15764
13902
13557
12331
13074
11891
15860
Apr May Jun Jul Aug Sep Oct Nov Dec
0
5000
10000
15000
20000
25000
EXPORTS
-2014 -2015
-20%
-10%
0%
9.26%
-4.31%
5.09%
-7.90%
-5.91%
-7.34%
7.27%
-20.98%
-16.28%
YoY GROWTH
Apr May Jun Jul Aug Sep Oct Nov Dec
0%
5%
10%
9.58%
3.82% 3.86%
1.83%
-1.81%
0.82%
4.79%
6.55%
14.41%
YoY GROWTH
Apr May Jun Jul Aug Sep Oct Nov Dec
-40%
-30%
-20%
-10% -13.82%
-2.89%
-7.29%
-25.81%
-5.60%
-24.95%
-27.40%
-36.68%
-41.01%
YoY GROWTH
Apr May Jun Jul Aug Sep Oct Nov Dec
25.68 %
22.86 %
29.85 %
26.32 %
25.95 %
25.59 %
25.73 %
25.07 %
29.21 %
24.98 %
21.86 %
28.23 %
21.79 %
22.43 %
23.49 %
22.95 %
22.20 %
24.65 %
Apr'14
May'14
Jun'14
Jul'14
Aug'14
Sep'14
Oct'14
Nov'14
Dec'14
Apr'15
May'15
Jun'15
Jul'15
Aug'15
Sep'15
Oct'15
Nov'15
Dec'15
0 5 10 15 20 25
MARKET SHARE
26.00 %
24.20 %
20.76 %
21.07 %
21.84 %
22.53 %
23.77 %
22.61 %
21.20 %
24.11 %
23.32 %
21.23 %
18.27 %
20.22 %
20.75 %
20.45 %
21.82 %
21.49 %
Apr'14
May'14
Jun'14
Jul'14
Aug'14
Sep'14
Oct'14
Nov'14
Dec'14
Apr'15
May'15
Jun'15
Jul'15
Aug'15
Sep'15
Oct'15
Nov'15
Dec'15
0 5 10 15 20 25
MARKET SHARE
42.60 %
37.30 %
36.94 %
38.64 %
30.83 %
32.21 %
41.44 %
38.43 %
44.51 %
30.14 %
33.46 %
43.84 %
26.88 %
29.11 %
27.43 %
27.58 %
29.44 %
31.43 %
Apr'14
May'14
Jun'14
Jul'14
Aug'14
Sep'14
Oct'14
Nov'14
Dec'14
Apr'15
May'15
Jun'15
Jul'15
Aug'15
Sep'15
Oct'15
Nov'15
Dec'15
0 10 20 30 40
MARKET SHARE
31. Maruti Suzuki India
(Number of Vehicles)
CAPITALMIND • (C) ALL RIGHTS RESERVED • capitalmind.in Dec'15 The SparkPlug Report - [PASSENGER CARS] 31
88963
103925
66507
92544
92741
95667
72615
96864
79731
97884
106319
79684
111332
102100
97102
102147
84994
89900
Apr May Jun Jul Aug Sep Oct Nov Dec
0
20000
40000
60000
80000
100000
PRODUCTION
-2014 -2015
65786
74536
86223
72782
82823
81447
80589
82306
81564
84188
85190
86630
91602
86454
87916
97951
89479
91043
Apr May Jun Jul Aug Sep Oct Nov Dec
0
20000
40000
60000
80000
DOMESTIC SALES
-2014 -2015
6867
9581
10532
10410
10955
9207
6073
8822
10552
9931
11554
11465
10647
10358
7247
12213
8965
6719
Apr May Jun Jul Aug Sep Oct Nov Dec
0
5000
10000
EXPORTS
-2014 -2015
-10%
0%
10%
20%
30%
40%
10.03%
2.30%
19.81%20.30%
10.09%
1.50%
40.67%
-12.25%
12.75%
YoY GROWTH
Apr May Jun Jul Aug Sep Oct Nov Dec
5%
10%
15%
20%
25%
27.97%
14.29%
0.47%
25.86%
4.38%
7.94%
21.54%
8.72%
11.62%
YoY GROWTH
Apr May Jun Jul Aug Sep Oct Nov Dec
0%
50%
100%
44.62%
20.59%
8.86%
2.28%
-5.45%
-21.29%
101.10%
1.62%
-36.32%
YoY GROWTH
Apr May Jun Jul Aug Sep Oct Nov Dec
46.76 %
51.23 %
37.59 %
45.31 %
46.88 %
45.71 %
41.01 %
46.08 %
40.71 %
45.80 %
52.40 %
40.53 %
49.00 %
47.41 %
45.97 %
47.97 %
45.30 %
46.28 %
Apr'14
May'14
Jun'14
Jul'14
Aug'14
Sep'14
Oct'14
Nov'14
Dec'14
Apr'15
May'15
Jun'15
Jul'15
Aug'15
Sep'15
Oct'15
Nov'15
Dec'15
0 10 20 30 40 50
MARKET SHARE
48.71 %
50.17 %
53.81 %
52.77 %
53.86 %
52.58 %
50.56 %
52.49 %
53.31 %
52.77 %
53.22 %
53.25 %
56.54 %
53.01 %
51.84 %
50.45 %
51.69 %
52.73 %
Apr'14
May'14
Jun'14
Jul'14
Aug'14
Sep'14
Oct'14
Nov'14
Dec'14
Apr'15
May'15
Jun'15
Jul'15
Aug'15
Sep'15
Oct'15
Nov'15
Dec'15
0 10 20 30 40 50
MARKET SHARE
19.53 %
23.04 %
22.88 %
21.47 %
23.52 %
18.05 %
13.97 %
18.05 %
17.47 %
23.20 %
25.67 %
31.89 %
20.59 %
22.24 %
16.12 %
25.77 %
22.20 %
13.31 %
Apr'14
May'14
Jun'14
Jul'14
Aug'14
Sep'14
Oct'14
Nov'14
Dec'14
Apr'15
May'15
Jun'15
Jul'15
Aug'15
Sep'15
Oct'15
Nov'15
Dec'15
0 10 20 30
MARKET SHARE
33. UTILITY VEHICLES
CAPITALMIND • (C) ALL RIGHTS RESERVED • capitalmind.in Dec'15 The SparkPlug Report 33
54219
49935
45459
55820
48790
60371
52232
55993
37699
56941
50909
50164
59087
59256
62772
66732
51223
49556
Apr May Jun Jul Aug Sep Oct Nov Dec
0
20000
40000
60000
PRODUCTION
-2014 -2015
40680
44267
43849
45023
46501
53003
48105
40851
43074
43526
43260
41278
45191
44608
48464
58120
48880
44874
Apr May Jun Jul Aug Sep Oct Nov Dec
0
10000
20000
30000
40000
50000
DOMESTIC SALES
-2014 -2015
6535
6366
5314
6717
6132
6313
5082
7170
8887
7465
6165
3860
7979
12736
12127
11757
10898
10895
Apr May Jun Jul Aug Sep Oct Nov Dec
0
5000
10000
EXPORTS
-2014 -2015
0%
10%
20%
30%
5.02%
1.95%
10.35%
5.85%
21.45%
3.98%
27.76%
-8.52%
31.45%
YoY GROWTH
Apr May Jun Jul Aug Sep Oct Nov Dec
-5%
0%
5%
10%
15%
20%
7.00%
-2.27%
-5.86%
0.37%
-4.07%
-8.56%
20.82%
19.65%
4.18%
YoY GROWTH
Apr May Jun Jul Aug Sep Oct Nov Dec
0%
50%
100%
14.23%
-3.16%
-27.36%
18.79%
107.70%
92.10%
131.35%
51.99%
22.59%
YoY GROWTH
Apr May Jun Jul Aug Sep Oct Nov Dec
34. Mahindra & Mahindra
(Number of Vehicles)
CAPITALMIND • (C) ALL RIGHTS RESERVED • capitalmind.in Dec'15 The SparkPlug Report - [UTILITY VEHICLES] 34
21379
18549
15358
15927
14310
18222
17475
16783
14214
18097
19197
16387
12649
12481
17888
23266
19586
20437
Apr May Jun Jul Aug Sep Oct Nov Dec
0
5000
10000
15000
20000
PRODUCTION
-2014 -2015
17857
17831
16492
14348
13911
19647
19029
13612
17082
17941
16980
14433
13204
13307
18717
22664
18686
17310
Apr May Jun Jul Aug Sep Oct Nov Dec
0
5000
10000
15000
20000
DOMESTIC SALES
-2014 -2015
491
431
271
379
216
339
328
402
296
251
343
439
496
474
480
401
188
305
Apr May Jun Jul Aug Sep Oct Nov Dec
0
100
200
300
400
EXPORTS
-2014 -2015
-20%
0%
20%
40%
-15.35%
3.49%
6.70%
-20.58%
-12.78%
-1.83%
33.14%
16.70%
43.78%
YoY GROWTH
Apr May Jun Jul Aug Sep Oct Nov Dec
-10%
0%
10%
20%
30%
0.47%
-4.77%
-12.48%
-7.97%
-4.34%-4.73%
19.10%
37.28%
1.33%
YoY GROWTH
Apr May Jun Jul Aug Sep Oct Nov Dec
-50%
0%
50%
100%
-48.88%
-20.42%
61.99%
30.87%
119.44%
41.59%
22.26%
-53.23%
3.04%
YoY GROWTH
Apr May Jun Jul Aug Sep Oct Nov Dec
39.43 %
37.15 %
33.78 %
28.53 %
29.33 %
30.18 %
33.46 %
29.97 %
37.70 %
31.78 %
37.71 %
32.67 %
21.41 %
21.06 %
28.50 %
34.86 %
38.24 %
41.24 %
Apr'14
May'14
Jun'14
Jul'14
Aug'14
Sep'14
Oct'14
Nov'14
Dec'14
Apr'15
May'15
Jun'15
Jul'15
Aug'15
Sep'15
Oct'15
Nov'15
Dec'15
0 10 20 30 40
MARKET SHARE
43.90 %
40.28 %
37.61 %
31.87 %
29.92 %
37.07 %
39.56 %
33.32 %
39.66 %
41.22 %
39.25 %
34.97 %
29.22 %
29.83 %
38.62 %
39.00 %
38.23 %
38.57 %
Apr'14
May'14
Jun'14
Jul'14
Aug'14
Sep'14
Oct'14
Nov'14
Dec'14
Apr'15
May'15
Jun'15
Jul'15
Aug'15
Sep'15
Oct'15
Nov'15
Dec'15
0 10 20 30 40
MARKET SHARE
7.51 %
6.77 %
5.10 %
5.64 %
3.52 %
5.37 %
6.45 %
5.61 %
3.33 %
3.36 %
5.56 %
11.37 %
6.22 %
3.72 %
3.96 %
3.41 %
1.73 %
2.80 %
Apr'14
May'14
Jun'14
Jul'14
Aug'14
Sep'14
Oct'14
Nov'14
Dec'14
Apr'15
May'15
Jun'15
Jul'15
Aug'15
Sep'15
Oct'15
Nov'15
Dec'15
0 2 4 6 8 10
MARKET SHARE
35. Renault India
(Number of Vehicles)
CAPITALMIND • (C) ALL RIGHTS RESERVED • capitalmind.in Dec'15 The SparkPlug Report - [UTILITY VEHICLES] 35
7183
4126
2130
3876
2345
3975
3207
3277
1741
5156
4428
5464
4227
2311
1866
405
204
685
Apr May Jun Jul Aug Sep Oct Nov Dec
0
2000
4000
6000
PRODUCTION
-2014 -2015
3175
3350
3822
2823
3106
3418
3419
2676
3275
3742
3377
4018
1528
1381
1276
2033
2124
3109
Apr May Jun Jul Aug Sep Oct Nov Dec
0
1000
2000
3000
4000
DOMESTIC SALES
-2014 -2015
1647
554
430
389
333
59
38
217
27
22
4
30
0
6
0
0
8
0
Apr May Jun Jul Aug Sep Oct Nov Dec
0
500
1000
1500
EXPORTS
-2014 -2015
-50%
0%
50%
100%
150%
-28.22%
7.32%
156.53%
9.06%
-1.45%
-53.06%
-87.37%-93.77%
-60.65%
YoY GROWTH
Apr May Jun Jul Aug Sep Oct Nov Dec
-60%
-40%
-20%
0%
17.86%
0.81%
5.13%
-45.87%
-55.54%
-62.67%
-40.54%
-20.63%
-5.07%
YoY GROWTH
Apr May Jun Jul Aug Sep Oct Nov Dec
-100%
-98%
-96%
-94%
-98.66%
-99.28%
-93.02%
-100.00%
-98.20%
-100.00%-100.00%
-96.31%
-100.00%
YoY GROWTH
Apr May Jun Jul Aug Sep Oct Nov Dec
13.25 %
8.26 %
4.69 %
6.94 %
4.81 %
6.58 %
6.14 %
5.85 %
4.62 %
9.05 %
8.70 %
10.89 %
7.15 %
3.90 %
2.97 %
0.61 %
0.40 %
1.38 %
Apr'14
May'14
Jun'14
Jul'14
Aug'14
Sep'14
Oct'14
Nov'14
Dec'14
Apr'15
May'15
Jun'15
Jul'15
Aug'15
Sep'15
Oct'15
Nov'15
Dec'15
0 5 10
MARKET SHARE
7.80 %
7.57 %
8.72 %
6.27 %
6.68 %
6.45 %
7.11 %
6.55 %
7.60 %
8.60 %
7.81 %
9.73 %
3.38 %
3.10 %
2.63 %
3.50 %
4.35 %
6.93 %
Apr'14
May'14
Jun'14
Jul'14
Aug'14
Sep'14
Oct'14
Nov'14
Dec'14
Apr'15
May'15
Jun'15
Jul'15
Aug'15
Sep'15
Oct'15
Nov'15
Dec'15
0 2 4 6 8
MARKET SHARE
25.20 %
8.70 %
8.09 %
5.79 %
5.43 %
0.93 %
0.75 %
3.03 %
0.30 %
0.29 %
0.06 %
0.78 %
0.00 %
0.05 %
0.00 %
0.00 %
0.07 %
0.00 %
Apr'14
May'14
Jun'14
Jul'14
Aug'14
Sep'14
Oct'14
Nov'14
Dec'14
Apr'15
May'15
Jun'15
Jul'15
Aug'15
Sep'15
Oct'15
Nov'15
Dec'15
0 5 10 15 20 25
MARKET SHARE
37. COMMERCIAL VEHICLES
CAPITALMIND • (C) ALL RIGHTS RESERVED • capitalmind.in Dec'15 The SparkPlug Report 37
57139
53984
54045
57017
56214
60547
53981
59976
51168
57289
59433
57164
59102
63535
71891
60955
59100
65660
Apr May Jun Jul Aug Sep Oct Nov Dec
0
20000
40000
60000
PRODUCTION
-2014 -2015
43080
46986
51079
47775
48518
56078
51978
47686
50999
45872
48841
51446
51795
52198
62845
58596
51766
56840
Apr May Jun Jul Aug Sep Oct Nov Dec
0
20000
40000
60000
DOMESTIC SALES
-2014 -2015
5747
6343
6656
7241
7098
8157
7494
7349
6853
6889
8403
8330
8699
9321
7672
8168
7137
8854
Apr May Jun Jul Aug Sep Oct Nov Dec
0
2000
4000
6000
8000
EXPORTS
-2014 -2015
0%
5%
10%
15%
20%
25%
0.26%
10.09%
5.77%
3.66%
13.02%
18.74%
12.92%
-1.46%
28.32%
YoY GROWTH
Apr May Jun Jul Aug Sep Oct Nov Dec
5%
10%
6.48%
3.95%
0.72%
8.41%
7.58%
12.07%
12.73%
8.56%
11.45%
YoY GROWTH
Apr May Jun Jul Aug Sep Oct Nov Dec
0%
10%
20%
30%
19.87%
32.48%
25.15%
20.14%
31.32%
-5.95%
8.99%
-2.88%
29.20%
YoY GROWTH
Apr May Jun Jul Aug Sep Oct Nov Dec
38. CAPITALMIND • (C) ALL RIGHTS RESERVED • capitalmind.in Dec'15 The SparkPlug Report 38
Capital Mind Premium: The Sparkplug Report
December 2015
Commercial Vehicles (Passenger Carriers + Goods Carriers)
How did this segment fare? Let's take a look at the segment analysis; the sub-segment and each of the constituents:
Segment Analysis:
• Production increased from 51,168 units to 65,660 units resulting in a growth of +28.32% (YoY) – best of the year so far
• Domestic Sales grew from 50,999 units to 56,840 units resulting in a growth of +11.45% (YoY)
• Exports made a massive comeback at +29.20% (YoY) from 6,853 units to 8,854 units.
• All this translated into an overall sales growth of +13.56% (YoY) – best of the year so far
Sub-Segment Analysis:
Passenger Carriers (Models include: Citiline, CityRide, Starbus, Tourister, Viking and others):
• PC brought in a growth of +5.04% (YoY) in Domestic Sales clocking in 6,382 units from 6,076 units during the same month of the
previous year.
• Exports continue to be in the red at –10.58% (YoY) as the total units exported fell by 189 units from 1,787 units to 1,598 units.
• Overall sales growth was at +1.49% (YoY) or 117 units – second lowest of the year behind November.
Goods Carriers (Models include: Ape Truck, Bolero Maxi Truck, Maxximo, Super Supreme, Winger and others):
• GC fared a better growth of +12.32% (YoY) in Domestic Sales – 50,458 units were sold compared to 44,923 units; an addition of 5,535
units.
• Exports fared positive with a growth of +43.23% (YoY).
39. CAPITALMIND • (C) ALL RIGHTS RESERVED • capitalmind.in Dec'15 The SparkPlug Report 39
Capital Mind Premium: The Sparkplug Report
December 2015
Constituent Analysis:
• Outliers (manufacturer with the highest growth):
• Production: +82.71% (YoY) – VECV Eicher
• Domestic Sales: +43.53% (YoY) – Ashok Leyland
• Exports: +127.07% (YoY) – Mahindra & Mahindra
• Total Overall Sales: +46.03% (YoY) – VECV Eicher
• Riding on the success of International demand, Ashok Leyland increased its market share by over 3% to +18.50%. Domestic Sales stood
at +43.53% (YoY) while Exports were in the red for a 6th consecutive month at –38.53% (YoY).
• Mahindra & Mahindra which increased its market share by a whopping 7.5% in October and lost almost 3% in November, continues to
lose its market share. The company managed to sell 15,208 units compared to 13,576 units a year ago
• Tata Motors hit the green in Domestic Sales with a growth of +6.63% (YoY). The company managed to sell 25,781 units compared to
24,177 units a year ago. Additionally, Exports fared at +12.57% (YoY) with 4,289 units being exported compared to 3,810 units from a
year ago.
41. BUSES - PASSENGER CARRIERS
CAPITALMIND • (C) ALL RIGHTS RESERVED • capitalmind.in Dec'15 The SparkPlug Report 41
3936
4271
4013
4429
3882
3469
2513
3242
3799
3566
4466
5194
5083
4375
4773
2445
3271
4239
Apr May Jun Jul Aug Sep Oct Nov Dec
0
1000
2000
3000
4000
5000
PRODUCTION
-2014 -2015
2877
3284
3725
2950
2681
2523
2039
1665
2941
3291
4259
4194
4440
3041
3682
2398
2044
2937
Apr May Jun Jul Aug Sep Oct Nov Dec
0
1000
2000
3000
4000
DOMESTIC SALES
-2014 -2015
475
659
785
778
942
1296
1106
1325
1388
518
815
1016
820
1140
767
1184
1033
1292
Apr May Jun Jul Aug Sep Oct Nov Dec
0
500
1000
EXPORTS
-2014 -2015
0%
10%
20%
30%
-9.40%
4.57%
29.43%
14.77%
12.70%
37.59%
-2.71%
0.89%
11.58%
YoY GROWTH
Apr May Jun Jul Aug Sep Oct Nov Dec
0%
10%
20%
30%
40%
50%
14.39%
29.69%
12.59%
50.51%
13.43%
45.94%
17.61%
22.76%
-0.14%
YoY GROWTH
Apr May Jun Jul Aug Sep Oct Nov Dec
-40%
-20%
0%
20%
9.05%
23.67%
29.43%
5.40%
21.02%
-40.82%
7.05%
-22.04%
-6.92%
YoY GROWTH
Apr May Jun Jul Aug Sep Oct Nov Dec
42. Ashok Leyland
(Number of Vehicles)
CAPITALMIND • (C) ALL RIGHTS RESERVED • capitalmind.in Dec'15 The SparkPlug Report - [BUSES - PASSENGER CARRIERS] 42
1458
1584
1837
1845
1909
2036
1394
1595
1582
1131
2018
2398
2774
2395
2498
1542
1675
1993
Apr May Jun Jul Aug Sep Oct Nov Dec
0
500
1000
1500
2000
2500
PRODUCTION
-2014 -2015
807
879
1166
1009
1221
1119
933
657
904
940
1550
1404
2255
1556
1861
1126
1088
1270
Apr May Jun Jul Aug Sep Oct Nov Dec
0
500
1000
1500
2000
DOMESTIC SALES
-2014 -2015
280
349
469
542
643
780
743
852
918
243
426
604
449
557
373
739
542
526
Apr May Jun Jul Aug Sep Oct Nov Dec
0
200
400
600
800
EXPORTS
-2014 -2015
-20%
0%
20%
40%
-22.43%
27.40%
30.54%
50.35%
25.46%
22.69%
10.62%
5.02%
25.98%
YoY GROWTH
Apr May Jun Jul Aug Sep Oct Nov Dec
20%
40%
60%
80%
100%
120%
16.48%
76.34%
20.41%
123.49%
27.44%
66.31%
20.69%
65.60%
40.49%
YoY GROWTH
Apr May Jun Jul Aug Sep Oct Nov Dec
-40%
-20%
0%
20%
-13.21%
22.06%
28.78%
-17.16%
-13.37%
-52.18%
-0.54%
-36.38%
-42.70%
YoY GROWTH
Apr May Jun Jul Aug Sep Oct Nov Dec
37.04 %
37.09 %
45.78 %
41.66 %
49.18 %
58.69 %
55.47 %
49.20 %
41.64 %
31.72 %
45.19 %
46.17 %
54.57 %
54.74 %
52.34 %
63.07 %
51.21 %
47.02 %
Apr'14
May'14
Jun'14
Jul'14
Aug'14
Sep'14
Oct'14
Nov'14
Dec'14
Apr'15
May'15
Jun'15
Jul'15
Aug'15
Sep'15
Oct'15
Nov'15
Dec'15
0 20 40 60
MARKET SHARE
28.05 %
26.77 %
31.30 %
34.20 %
45.54 %
44.35 %
45.76 %
39.46 %
30.74 %
28.56 %
36.39 %
33.48 %
50.79 %
51.17 %
50.54 %
46.96 %
53.23 %
43.24 %
Apr'14
May'14
Jun'14
Jul'14
Aug'14
Sep'14
Oct'14
Nov'14
Dec'14
Apr'15
May'15
Jun'15
Jul'15
Aug'15
Sep'15
Oct'15
Nov'15
Dec'15
0 10 20 30 40 50
MARKET SHARE
58.95 %
52.96 %
59.75 %
69.67 %
68.26 %
60.19 %
67.18 %
64.30 %
66.14 %
46.91 %
52.27 %
59.45 %
54.76 %
48.86 %
48.63 %
62.42 %
52.47 %
40.71 %
Apr'14
May'14
Jun'14
Jul'14
Aug'14
Sep'14
Oct'14
Nov'14
Dec'14
Apr'15
May'15
Jun'15
Jul'15
Aug'15
Sep'15
Oct'15
Nov'15
Dec'15
0 20 40 60
MARKET SHARE
43. Tata Motors
(Number of Vehicles)
CAPITALMIND • (C) ALL RIGHTS RESERVED • capitalmind.in Dec'15 The SparkPlug Report - [BUSES - PASSENGER CARRIERS] 43
1387
1409
1410
1707
1121
1068
724
1249
1605
1406
1235
1496
1183
1234
1721
490
911
1218
Apr May Jun Jul Aug Sep Oct Nov Dec
0
500
1000
1500
PRODUCTION
-2014 -2015
1120
1267
1330
1148
974
925
839
737
1482
1225
1393
1457
1360
1048
1395
1009
671
987
Apr May Jun Jul Aug Sep Oct Nov Dec
0
500
1000
DOMESTIC SALES
-2014 -2015
172
310
311
234
283
427
302
432
454
244
333
320
318
547
316
408
354
595
Apr May Jun Jul Aug Sep Oct Nov Dec
0
100
200
300
400
500
EXPORTS
-2014 -2015
-20%
0%
20%
40%
60%
1.37%
-12.35%
6.10%
-30.70%
10.08%
61.14%
-32.32%
-27.06%
-24.11%
YoY GROWTH
Apr May Jun Jul Aug Sep Oct Nov Dec
-20%
0%
20%
40%
9.38% 9.94% 9.55%
18.47%
7.60%
50.81%
20.26%
-8.96%
-33.40%
YoY GROWTH
Apr May Jun Jul Aug Sep Oct Nov Dec
-20%
0%
20%
40%
60%
80%
41.86%
7.42%
2.89%
35.90%
93.29%
-26.00%
35.10%
-18.06%
31.06%
YoY GROWTH
Apr May Jun Jul Aug Sep Oct Nov Dec
35.24 %
32.99 %
35.14 %
38.54 %
28.88 %
30.79 %
28.81 %
38.53 %
42.25 %
39.43 %
27.65 %
28.80 %
23.27 %
28.21 %
36.06 %
20.04 %
27.85 %
28.73 %
Apr'14
May'14
Jun'14
Jul'14
Aug'14
Sep'14
Oct'14
Nov'14
Dec'14
Apr'15
May'15
Jun'15
Jul'15
Aug'15
Sep'15
Oct'15
Nov'15
Dec'15
0 10 20 30 40
MARKET SHARE
38.93 %
38.58 %
35.70 %
38.92 %
36.33 %
36.66 %
41.15 %
44.26 %
50.39 %
37.22 %
32.71 %
34.74 %
30.63 %
34.46 %
37.89 %
42.08 %
32.83 %
33.61 %
Apr'14
May'14
Jun'14
Jul'14
Aug'14
Sep'14
Oct'14
Nov'14
Dec'14
Apr'15
May'15
Jun'15
Jul'15
Aug'15
Sep'15
Oct'15
Nov'15
Dec'15
0 10 20 30 40 50
MARKET SHARE
36.21 %
47.04 %
39.62 %
30.08 %
30.04 %
32.95 %
27.31 %
32.60 %
32.71 %
47.10 %
40.86 %
31.50 %
38.78 %
47.98 %
41.20 %
34.46 %
34.27 %
46.05 %
Apr'14
May'14
Jun'14
Jul'14
Aug'14
Sep'14
Oct'14
Nov'14
Dec'14
Apr'15
May'15
Jun'15
Jul'15
Aug'15
Sep'15
Oct'15
Nov'15
Dec'15
0 10 20 30 40
MARKET SHARE
45. TRUCKS - GOODS CARRIERS
CAPITALMIND • (C) ALL RIGHTS RESERVED • capitalmind.in Dec'15 The SparkPlug Report 45
16832
16871
16404
16740
17721
16692
16052
18850
16510
19887
21505
20435
20489
24804
29227
17848
22474
24034
Apr May Jun Jul Aug Sep Oct Nov Dec
0
5000
10000
15000
20000
25000
PRODUCTION
-2014 -2015
12552
13288
14649
14859
14319
16512
15853
14483
18860
15986
16356
17990
18621
19975
27490
19783
18101
23080
Apr May Jun Jul Aug Sep Oct Nov Dec
0
5000
10000
15000
20000
25000
DOMESTIC SALES
-2014 -2015
1772
1651
1503
1919
1626
1451
1398
1392
1354
1812
1825
2353
1963
2021
1606
1709
1362
1476
Apr May Jun Jul Aug Sep Oct Nov Dec
0
500
1000
1500
2000
EXPORTS
-2014 -2015
20%
40%
60%
18.15%
27.47%
24.57%
22.40%
39.97%
75.10%
11.19%
19.23%
45.57%
YoY GROWTH
Apr May Jun Jul Aug Sep Oct Nov Dec
30%
40%
50%
60%
27.36%
23.09%22.81%
25.32%
39.50%
66.48%
24.79%24.98%
22.38%
YoY GROWTH
Apr May Jun Jul Aug Sep Oct Nov Dec
0%
10%
20%
30%
40%
50%
2.26%
10.54%
56.55%
2.29%
24.29%
10.68%
22.25%
-2.16%
9.01%
YoY GROWTH
Apr May Jun Jul Aug Sep Oct Nov Dec
46. Mahindra & Mahindra
(Number of Vehicles)
CAPITALMIND • (C) ALL RIGHTS RESERVED • capitalmind.in Dec'15 The SparkPlug Report - [TRUCKS - GOODS CARRIERS] 46
277
321
395
291
159
272
190
240
288
337
350
344
423
357
490
587
466
653
Apr May Jun Jul Aug Sep Oct Nov Dec
0
200
400
600
PRODUCTION
-2014 -2015
244
238
279
284
282
180
216
259
303
260
343
404
314
341
511
581
454
528
Apr May Jun Jul Aug Sep Oct Nov Dec
0
100
200
300
400
500
DOMESTIC SALES
-2014 -2015
0
0
7
10
10
10
4
0
0
5
20
0
54
26
37
7
6
12
Apr May Jun Jul Aug Sep Oct Nov Dec
0
10
20
30
40
50
EXPORTS
-2014 -2015
0%
50%
100%
150%
200%
21.66%
9.03%
-12.91%
45.36%
124.53%
80.15%
208.95%
94.17%
126.74%
YoY GROWTH
Apr May Jun Jul Aug Sep Oct Nov Dec
50%
100%
150%
6.56%
44.12%44.80%
10.56%
20.92%
183.89%
168.98%
75.29%74.26%
YoY GROWTH
Apr May Jun Jul Aug Sep Oct Nov Dec
-100%
0%
100%
200%
300%
400%
0.00% 0.00%
-100.00%
440.00%
160.00%
270.00%
75.00%
0.00% 0.00%
YoY GROWTH
Apr May Jun Jul Aug Sep Oct Nov Dec
1.65 %
1.90 %
2.41 %
1.74 %
0.90 %
1.63 %
1.18 %
1.27 %
1.74 %
1.69 %
1.63 %
1.68 %
2.06 %
1.44 %
1.68 %
3.29 %
2.07 %
2.72 %
Apr'14
May'14
Jun'14
Jul'14
Aug'14
Sep'14
Oct'14
Nov'14
Dec'14
Apr'15
May'15
Jun'15
Jul'15
Aug'15
Sep'15
Oct'15
Nov'15
Dec'15
0 1 2 3
MARKET SHARE
1.94 %
1.79 %
1.90 %
1.91 %
1.97 %
1.09 %
1.36 %
1.79 %
1.61 %
1.63 %
2.10 %
2.25 %
1.69 %
1.71 %
1.86 %
2.94 %
2.51 %
2.29 %
Apr'14
May'14
Jun'14
Jul'14
Aug'14
Sep'14
Oct'14
Nov'14
Dec'14
Apr'15
May'15
Jun'15
Jul'15
Aug'15
Sep'15
Oct'15
Nov'15
Dec'15
0.0 0.5 1.0 1.5 2.0 2.5
MARKET SHARE
0.00 %
0.00 %
0.47 %
0.52 %
0.62 %
0.69 %
0.29 %
0.00 %
0.00 %
0.28 %
1.10 %
0.00 %
2.75 %
1.29 %
2.30 %
0.41 %
0.44 %
0.81 %
Apr'14
May'14
Jun'14
Jul'14
Aug'14
Sep'14
Oct'14
Nov'14
Dec'14
Apr'15
May'15
Jun'15
Jul'15
Aug'15
Sep'15
Oct'15
Nov'15
Dec'15
0.0 0.5 1.0 1.5 2.0 2.5
MARKET SHARE
47. Tata Motors
(Number of Vehicles)
CAPITALMIND • (C) ALL RIGHTS RESERVED • capitalmind.in Dec'15 The SparkPlug Report - [TRUCKS - GOODS CARRIERS] 47
9911
9329
9894
9835
10272
10168
10306
12167
9514
10850
12479
12386
11421
13369
15674
10178
13450
12066
Apr May Jun Jul Aug Sep Oct Nov Dec
0
5000
10000
15000
PRODUCTION
-2014 -2015
7305
7846
8290
8577
8167
9479
9513
8715
10956
8954
9395
9993
10448
10969
14520
11495
10853
11686
Apr May Jun Jul Aug Sep Oct Nov Dec
0
5000
10000
DOMESTIC SALES
-2014 -2015
983
758
883
1348
1093
1029
917
866
730
989
1178
1619
1380
1262
993
1061
846
798
Apr May Jun Jul Aug Sep Oct Nov Dec
0
500
1000
1500
EXPORTS
-2014 -2015
0%
10%
20%
30%
40%
50%
9.47%
33.77%
25.19%
16.13%
30.15%
54.15%
-1.24%
10.54%
26.82%
YoY GROWTH
Apr May Jun Jul Aug Sep Oct Nov Dec
10%
20%
30%
40%
50%
22.57%
19.74%20.54%21.81%
34.31%
53.18%
20.83%
24.53%
6.66%
YoY GROWTH
Apr May Jun Jul Aug Sep Oct Nov Dec
0%
20%
40%
60%
80%
0.61%
55.41%
83.35%
2.37%
15.46%
-3.50%
15.70%
-2.31%
9.32%
YoY GROWTH
Apr May Jun Jul Aug Sep Oct Nov Dec
58.88 %
55.30 %
60.31 %
58.75 %
57.97 %
60.92 %
64.20 %
64.55 %
57.63 %
54.56 %
58.03 %
60.61 %
55.74 %
53.90 %
53.63 %
57.03 %
59.85 %
50.20 %
Apr'14
May'14
Jun'14
Jul'14
Aug'14
Sep'14
Oct'14
Nov'14
Dec'14
Apr'15
May'15
Jun'15
Jul'15
Aug'15
Sep'15
Oct'15
Nov'15
Dec'15
0 20 40 60
MARKET SHARE
58.20 %
59.05 %
56.59 %
57.72 %
57.04 %
57.41 %
60.01 %
60.17 %
58.09 %
56.01 %
57.44 %
55.55 %
56.11 %
54.91 %
52.82 %
58.11 %
59.96 %
50.63 %
Apr'14
May'14
Jun'14
Jul'14
Aug'14
Sep'14
Oct'14
Nov'14
Dec'14
Apr'15
May'15
Jun'15
Jul'15
Aug'15
Sep'15
Oct'15
Nov'15
Dec'15
0 20 40 60
MARKET SHARE
55.47 %
45.91 %
58.75 %
70.24 %
67.22 %
70.92 %
65.59 %
62.21 %
53.91 %
54.58 %
64.55 %
68.81 %
70.30 %
62.44 %
61.83 %
62.08 %
62.11 %
54.07 %
Apr'14
May'14
Jun'14
Jul'14
Aug'14
Sep'14
Oct'14
Nov'14
Dec'14
Apr'15
May'15
Jun'15
Jul'15
Aug'15
Sep'15
Oct'15
Nov'15
Dec'15
0 20 40 60
MARKET SHARE