SlideShare a Scribd company logo
1 of 197
Download to read offline
MACROECONOMETRICS OF INVESTMENT
AND THE USER COST OF CAPITAL
BY
Thethach Chuaprapaisilp
BSc, London School of Economics, 2001
MSc, University of Warwick, 2002
MA, Georgetown University, 2005
DISSERTATION
SUBMITTED IN PARTIAL FULFILLMENT OF THE REQUIREMENTS
FOR THE DEGREE OF DOCTOR OF PHILOSOPHY
IN THE DEPARTMENT OF ECONOMICS
AT FORDHAM UNIVERSITY
NEW YORK
APRIL, 2009
ACKNOWLEDGEMENTS
First and foremost, I would like to thank my parents for their support throughout
almost thirty years of my education. I am very grateful for helpful advice and guid-
ance from my dissertation committee, my mentor Prof. Bartholomew J. Moore and
my readers Prof. Erick W. Rengifo and Prof. Hrishikesh D. Vinod, that help make
my research efforts substantially materialized. I thank Professor Huntley Schaller
for providing Canadian cost of capital taxation data and thank the Macroeconomic
and Quantitative Studies division at the Federal Reserve Board for the U.S. data. I
also benefited from comments and suggestions provided by participants from the
Economics department during the Fordham University Graduate Students session at
the 2009 Eastern Economic Association conference. Graduate economics classes and
the tutoring position at the Economics Tutoring Center also enhanced my learning
and general understanding of the subjects. I thank the professors and staff for their
generosity and dedication.
Special thanks are due to those who help provided references and letters of rec-
ommendation at various stages of my education that enabled me to make progress on
my educational path. I thank all the teachers and supervisors since my early years in
Thailand, Australia, the U.K. and U.S. for their patience and liberality. Their efforts
have contributed to much of my success. I would also like to thank my colleagues,
family friends and relatives who gave me support in many ways throughout the years.
i
Contents
1 Introduction 1
1.1 Long Run Model of Investment . . . . . . . . . . . . . . . . . . . . . 6
1.2 Short Run Investment Dynamics . . . . . . . . . . . . . . . . . . . . 11
2 A Macroeconometric Model of Investment 21
2.1 Long Run Structural Relations for the VECM . . . . . . . . . . . . . 23
2.2 A Vector Error Correction representation for the Macroeconometric
Model . . . . . . . . . . . . . . . . . . . . . . . . . . . . . . . . . . . 30
3 Data for the U.S. and Canadian Economies 34
3.1 U.S. Data . . . . . . . . . . . . . . . . . . . . . . . . . . . . . . . . . 35
3.1.1 National Account Variables . . . . . . . . . . . . . . . . . . . 35
3.1.2 User Costs calculation . . . . . . . . . . . . . . . . . . . . . . 40
3.1.3 Employment and Wages . . . . . . . . . . . . . . . . . . . . . 45
3.2 Canadian Data . . . . . . . . . . . . . . . . . . . . . . . . . . . . . . 49
4 VECM Estimation Procedure and Results 53
4.1 Univariate Unit-Root Tests . . . . . . . . . . . . . . . . . . . . . . . . 53
4.2 Johansen’s Maximum Likelihood Estimation and Cointegration Rank
Tests . . . . . . . . . . . . . . . . . . . . . . . . . . . . . . . . . . . . 59
4.3 Estimation of the Long Run Relations . . . . . . . . . . . . . . . . . 70
ii
5 Extension with R&D Capital and Technology 109
5.1 Production relations with neutral or capital-biased technological progress109
5.2 R&D investment and capital stock . . . . . . . . . . . . . . . . . . . 113
5.3 VECM estimation with R&D technology . . . . . . . . . . . . . . . . 121
6 Conclusion 132
Bibliography 142
A Derivation of the optimality conditions 151
A.1 Neoclassical optimal capital accumulation problem for condition (1.1) 151
A.2 Neoclassical investment model with short-run adjustment costs . . . . 153
A.3 Household consumption-saving problem for condition (2.8) . . . . . . 156
B Log-linear approximation for structural relations in Chapter 2 160
B.1 Long-run aggregate supply relation (2.1) . . . . . . . . . . . . . . . . 160
B.1.1 Extension to the case with additional neutral
technology in Chapter 5 . . . . . . . . . . . . . . . . . . . . . 162
B.1.2 Extension to the case with capital augmenting
technology in Chapter 5 . . . . . . . . . . . . . . . . . . . . . 162
B.2 Investment-Saving (IS) relation (2.5) . . . . . . . . . . . . . . . . . . 164
B.3 Optimal consumption relation (2.9) . . . . . . . . . . . . . . . . . . . 165
C Data and batch codes for VECM estimation 168
C.1 U.S. Data . . . . . . . . . . . . . . . . . . . . . . . . . . . . . . . . . 168
C.2 Canadian Data . . . . . . . . . . . . . . . . . . . . . . . . . . . . . . 176
C.3 Batch codes for VECM estimation . . . . . . . . . . . . . . . . . . . . 180
Abstract
Vita
iii
List of Tables
4.1 ADF unit root tests for the U.S. data. . . . . . . . . . . . . . . . . . 56
4.2 ADF unit root tests for Canadian data. . . . . . . . . . . . . . . . . . 56
4.3 ADF-GLS unit root tests for the U.S. data. . . . . . . . . . . . . . . . 58
4.4 ADF-GLS unit root tests for Canadian data. . . . . . . . . . . . . . . 58
4.5 ADF unit root tests for the U.S. data in first differences. . . . . . . . 60
4.6 ADF unit root tests for Canadian data in first differences. . . . . . . 60
4.7 I(1) Cointegration Rank Test for the VECM of (2.16), 1962q4 to 2006q2. 69
4.8 Long-run β∗ estimates for the reduced form VECM of (2.16) with
rank(Π∗) = 6 and p = 2, 1962q4 to 2006q2. . . . . . . . . . . . . . . . 73
4.9 α adjustment coefficient estimates for the reduced form VECM of (2.16)
with rank(Π∗) = 6 and p = 2, 1962q4 to 2006q2. . . . . . . . . . . . . 74
4.10 Long-run β∗ estimates for the just-identified VECM of (2.16) with
rank(Π∗) = 6 and p = 2, 1962q4 to 2006q2. . . . . . . . . . . . . . . . 78
4.11 α adjustment coefficient estimates for the just-identified VECM of (2.16)
with rank(Π∗) = 6 and p = 2, 1962q4 to 2006q2. . . . . . . . . . . . . 79
4.12 Long-run β∗ estimates for the over-identified VECM of (2.16) with
rank(Π∗) = 6 and p = 2, 1962q4 to 2006q2. . . . . . . . . . . . . . . . 80
4.13 α adjustment coefficient estimates for the over-identified VECM of (2.16)
with rank(Π∗) = 6 and p = 2, 1962q4 to 2006q2. . . . . . . . . . . . . 81
iv
4.14 Long-run β∗ estimates for the just-identified VECM of (2.16) with
rank(Π∗) = 5 and p = 2, 1962q4 to 2006q2. . . . . . . . . . . . . . . . 85
4.15 α adjustment coefficient estimates for the just-identified VECM of (2.16)
with rank(Π∗) = 5 and p = 2, 1962q4 to 2006q2. . . . . . . . . . . . . 86
4.16 Long-run β∗ estimates for the over-identified VECM of (2.16) with
rank(Π∗) = 5 and p = 2, 1962q4 to 2006q2. . . . . . . . . . . . . . . . 87
4.17 α adjustment coefficient estimates for the over-identified VECM of (2.16)
with rank(Π∗) = 5 and p = 2, 1962q4 to 2006q2. . . . . . . . . . . . . 88
4.18 Long-run β∗ estimates for the second over-identified VECM of (2.16)
with rank(Π∗) = 5 and p = 2, 1962q4 to 2006q2. . . . . . . . . . . . . 95
4.19 α adjustment coefficient estimates for the second over-identified VECM
of (2.16) with rank(Π∗) = 5 and p = 2, 1962q4 to 2006q2. . . . . . . . 96
4.20 I(1) Cointegration Rank Test for the VECM of (2.16) excluding nxt,
1962q4 to 2006q2. . . . . . . . . . . . . . . . . . . . . . . . . . . . . . 97
4.21 Long-run β∗ and α estimates for the over-identified VECM of (2.16)
with rank(Π∗) = 4 and p = 2 and without nxt in yt, 1962q4 to 2006q2. 99
4.22 Long-run β∗ and α estimates for the over-identified VECM of (2.16)
with rank(Π∗) = 4 and p = 2 and without nxt in yt, 1962q4 to 2006q2. 100
4.23 I(1) Cointegration Rank Test for VECM (2.16) for non high-tech in-
vestment without nxt, 1962q4 to 2006q2. . . . . . . . . . . . . . . . . 101
4.24 Long-run β∗ and α estimates for the over-identified VECM of (2.16)
with rank(Π∗) = 4 and p = 2 for non high-tech investment and without
nxt in yt, 1962q4 to 2006q2. . . . . . . . . . . . . . . . . . . . . . . . 102
4.25 Long-run β∗ and α estimates for the over-identified VECM of (2.16)
with rank(Π∗) = 4 and p = 2 for non high-tech investment and without
nxt in yt, 1962q4 to 2006q2. . . . . . . . . . . . . . . . . . . . . . . . 103
v
4.26 I(1) Cointegration Rank Test for VECM (2.16) for non high-tech in-
vestment with nxt included, 1962q4 to 2006q2. . . . . . . . . . . . . . 104
4.27 I(1) Cointegration Rank Test for Canadian data 1962q4 to 2006q2. . 106
4.28 Long-run β∗ estimates for the over-identified VECM of (2.16) with
rank(Π∗) = 5 and p = 2, Canadian data 1962q4 to 2006q2. . . . . . . 107
4.29 α adjustment coefficient estimates for the over-identified VECM of (2.16)
with rank(Π∗) = 5 and p = 2, Canadian data 1962q4 to 2006q2. . . . 108
5.1 I(1) Cointegration Rank Test for the VECM with weakly exogenous
dt and gt, excluding nxt, 1962q4 to 2004q4. . . . . . . . . . . . . . . . 122
5.2 Long-run β∗ estimates for VECM with R&D capital stock, dt excluded
from the investment relation, rank(Π∗) = 5 and p = 2, 1962q4 to 2004q4.123
5.3 α adjustment coefficient estimates for VECM with R&D capital stock,
dt excluded from the investment relation, rank(Π∗) = 5 and p = 2,
1962q4 to 2004q4. . . . . . . . . . . . . . . . . . . . . . . . . . . . . . 124
5.4 Long-run β∗ estimates for VECM with R&D capital stock, dt included
in the investment relation, rank(Π∗) = 5 and p = 2, 1962q4 to 2004q4. 126
5.5 α adjustment coefficient estimates for VECM with R&D capital stock,
dt included in the investment relation, rank(Π∗) = 5 and p = 2, 1962q4
to 2004q4. . . . . . . . . . . . . . . . . . . . . . . . . . . . . . . . . . 127
5.6 Long-run β∗ estimates for VECM with capital-augmenting dt and weak
exogeneity restrictions on wt, rank(Π∗) = 5 and p = 2, 1962q4 to 2004q4.130
5.7 α adjustment coefficient estimates for VECM capital-augmenting dt
and weak exogeneity restrictions on wt, rank(Π∗) = 5 and p = 2,
1962q4 to 2004q4. . . . . . . . . . . . . . . . . . . . . . . . . . . . . . 131
6.1 DOLS estimates of the user cost elasticity of equipment capital, Cana-
dian data 1969q4-1999q2. . . . . . . . . . . . . . . . . . . . . . . . . . 136
vi
6.2 Long-run β∗ and α estimates for the four-variable VECM with invest-
ment, rank(Π∗) = 2 and p = 8, Canadian data 1963q1 to 2006q2. . . 137
6.3 Long-run β∗ and α estimates for the single-equation VECM, rank(Π∗)
= 1 and p = 2, United States data 1962q4 to 2006q2. . . . . . . . . . 139
6.4 Summary of elasticity estimates. . . . . . . . . . . . . . . . . . . . . . 140
vii
List of Figures
3.1 Log of GDP, yt and business value added, yb and their first differences. 36
3.2 Log of GDP, yt and GDP less (chain-subtracted) residential investment
and investment in non-residential structure, yc and their first differences. 37
3.3 Log of equipment and software (kt), high-tech (kc
t ) and non high-tech
(ko
t ) capital stocks and their first differences. . . . . . . . . . . . . . . 39
3.4 Relative prices of equipment and software (PI
), high-tech (PIc
) and
non high-tech (PIo
) investment. . . . . . . . . . . . . . . . . . . . . . 41
3.5 Log of user cost of capital for equipment and software (Rt), high-tech
(Rc
t ) and non high-tech (Ro
t ) investment and their first differences. . . 43
3.6 Log of short-term real returns for equipment and software (rrp
t ), high-
tech (rrpc
t ) and non high-tech (rrpo
t ) investment goods prices and their
first differences. . . . . . . . . . . . . . . . . . . . . . . . . . . . . . . 44
3.7 Log of real wage, ωt and its first difference. . . . . . . . . . . . . . . . 45
3.8 Log of total hours, lt and its first difference. . . . . . . . . . . . . . . 46
3.9 United States data. All variables are in logs. . . . . . . . . . . . . . . 47
3.10 United States data in first differences. . . . . . . . . . . . . . . . . . . 48
3.11 Canadian data. All variables are in logs. . . . . . . . . . . . . . . . . 51
3.12 Canadian data in first differences. . . . . . . . . . . . . . . . . . . . . 52
4.1 Roots of the companion matrix in the VAR(2) model for variables in
zt. United States data with endogenous gt, 1962q4 to 2006q2. . . . . 63
viii
4.2 Roots of the companion matrix in the VAR(2) model for variables in zt.
United States data with weakly exogenous gt and time trend, 1962q4
to 2006q2. . . . . . . . . . . . . . . . . . . . . . . . . . . . . . . . . . 63
4.3 Reduced form errors for the long-run relations. Estimated −ˆξt for the
VECM (2.16), 1962q4 to 2006q2. . . . . . . . . . . . . . . . . . . . . 75
4.4 Reduced form errors for the long-run relations. Estimated −ˆξt for the
over-identified VECM of (2.16) with rank(Π∗) = 6 and p = 2, 1962q4
to 2006q2. . . . . . . . . . . . . . . . . . . . . . . . . . . . . . . . . . 83
4.5 Reduced form errors for the long-run relations. Estimated −ˆξt for the
over-identified VECM of (2.16) with rank(Π∗) = 5 and p = 2, 1962q4
to 2006q2. . . . . . . . . . . . . . . . . . . . . . . . . . . . . . . . . . 89
5.1 Log of capital to GDP ratios for equipment and software capital stock,
kt and non-high tech equipment capital stock, ko
t . United States data. 110
5.2 BEA’s annual data for business R&D investment and net stock in bil-
lions of chained (2000) dollars, 1959-2004. . . . . . . . . . . . . . . . 114
5.3 Annual growth rates of BEA’s business R&D investment and BLS’s
information sector employment, 1959-2004. . . . . . . . . . . . . . . . 115
5.4 Interpolated quarterly business R&D investment in billions of chained
(2000) dollars, 1960-2004. . . . . . . . . . . . . . . . . . . . . . . . . 116
5.5 Generated quarterly stocks of business R&D in billions of chained
(2000) dollars, 1960-2004 compared with the BEA’s annual capital
stock data. . . . . . . . . . . . . . . . . . . . . . . . . . . . . . . . . . 117
5.6 Calculated quarterly poisson weighted average R&D in billions of chained
(2000) dollars, 1982-2004. . . . . . . . . . . . . . . . . . . . . . . . . 118
5.7 Calculated quarterly stock series for business R&D in billions of chained
(2000) dollars, 1982-2004 from the poisson model with different λ val-
ues compared with that from the depreciation smoothing procedure. . 119
ix
5.8 Calculated quarterly stock series for business R&D in billions of chained
(2000) dollars from the poisson model with L = 88 and 35 quarters
compared with that from the annual BEA’s data. . . . . . . . . . . . 120
5.9 Reduced form errors for the long-run relations. Estimated −ˆξt for
VECM with R&D capital stock, dt included in the investment relation,
rank(Π∗) = 5 and p = 2, 1962q4 to 2004q4. . . . . . . . . . . . . . . . 128
x
Chapter 1
Introduction
The cost of capital is considered an important factor affecting firms’ investment de-
cisions and capital accumulation in finance and economics alike. Fundamentally it
reflects individual firms’ costs of raising additional funds and the aggregate economy’s
ability to replenish and increase its existing capital stock. Components of the cost
of capital (the interest rate in particular) respond to monetary and fiscal policies in
addition to the overall macroeconomic and asset market conditions. Investment in
turn has an important influence on macroeconomic and asset market equilibria. This
dissertation estimates the neoclassical long-run user cost elasticity of aggregate busi-
ness investment using a vector error correction model (VECM) of the macroeconomy.
The model corresponds to a long-run general equilibrium framework as described by
theoretically consistent cointegrating relationships among macroeconomic variables.
The estimated VECM also gives a representation of the short-run investment dy-
namics from the data for which theoretical restrictions from potential endogenous
adjustment models can be tested against.1
This dissertation complements two strands of macroeconomic research. It provides
1
And potentially (after appropriate extensions) for other models of investment with lumpy invest-
ment, irreversibility under uncertainty, time-to-build, learning, liquidity and financial constraints as
discussed in Demers et al. (2003). See section 1.2 below for a discussion for the case of convex
adjustment costs.
1
2
an estimate of the long-run user cost elasticity commonly discussed in the investment
literature. The dissertation also utilizes a feature of many recent monetary models
by assuming that there is a tendency for output and real interest rates to move
towards their long-run natural (flexible price equilibrium) values as represented by
cointegrating relationships.
There have been numerous attempts to estimate the investment equation (via in-
vestment rate, I/K or from capital stock to output ratio K/Y ) with the user cost of
capital as the main explanatory variable.2
Most major studies have been conducted
using U.S. data at the aggregate, industry or firm levels. Gilchrist and Zakrajsek
(2007) and Chirinko (2008) provide recent descriptions of various research using dif-
ferent empirical techniques and data set. For aggregate time-series studies, Caballero
(1994), Tevlin and Whelan (2003) (with U.S. data) and Schaller (2006) (with Cana-
dian data), in particular, use a single-equation cointegrating relationship to estimate
the long-run user cost elasticity. Gilchrist and Zakrajsek (2007), and also Caballero
(1999), note however that there is too little variation in the measured aggregate long-
term interest rate or the tax components so that most of the variation in the cost of
capital (that will affect investment) comes from the trending relative price of capital
goods. Gilchrist and Zakrajsek (2007) also address the above mentioned endogene-
ity of components of the user cost of capital, that “ . . . long-term interest rates and
the price of new investment goods typically fall during economic downturns when
investment fundamentals are weak.” and that “ . . . [interest rates and corporate tax
rates] are often lowered by monetary and fiscal policies when investment spending is
weak.”, by using a measure of firm-specific user cost of capital derived from corporate
bond market data and matching it with the corresponding income and balance sheet
data for other variables associated with individual firms’ investment decision in the
2
Another common approach is to use various measures of Tobin’s average q or marginal q. The
next section also discusses the neoclassical model with adjustment costs and relates it to the q-
theoretic framework along the line of Hayashi (1982).
3
rest of the investment equation.3
Aggregate data are used in this study however and
the user cost elasticity is identified through the VECM of the macroeconomy given
short-term interest rates from monetary policy (and effective corporate tax rates from
fiscal policy).
Many studies using U.S., U.K. and Canadian data obtain the estimated value of
the long-run user cost elasticity of around -0.4 to -0.7 for total private non-residential
capital stock and a value close to one for equipment capital (-0.9 in Caballero (1994)
with U.S. data and -1.6 in Schaller (2006) with small open-economy Canadian data).4
Ellis and Price (2004) obtain the user cost elasticity estimate of -0.44 using aggregate
data for the U.K. in a two-vector VECM framework. A U.S. study that finds a
value of the user cost elasticity towards the lower end of the range (approximately
-0.4) is that of Chirinko et al. (2007) with firm-level panel data and stationary user
cost of capital series in their Interval-Difference model. Caballero et al. (1995) use
plant-level panel data in a cointegration framework to obtain an average long-run
user cost elasticity estimate of around -1.0 for equipment capital which translates
to total capital elasticity of around -0.7 at the upper end of the cited range. This
dissertation utilizes aggregate U.S. and Canadian time-series data, in a multiple-
equation general equilibrium VECM framework, in order to obtain a long-run user
cost elasticity estimate that can be most closely compared with the single-equation
cointegration results of Caballero (1994), Tevlin and Whelan (2003), Schaller (2006)
and AbIorwerth and Danforth (2004). Demers et al. (2003) and Caballero (1999)
3
Gilchrist and Zakrajsek (2007) also address endogeneity at the firm level when firms’ investment
and financial policies (due to improved fundamentals or via increasing leverage) affect the market
rates of interest, by accounting for changes to the expected default risk.
4
Tevlin and Whelan (2003) obtain the estimate for the user cost elasticity of -1.59 for computers
in the U.S. (for the period between 1980 and 1997), -0.13 for noncomputing equipments (over the
1950-1997 period) and -0.18 for equipment capital in total, in a regression where the coefficient for
the long-run elasticity of output is not restricted to one. AbIorwerth and Danforth (2004), using
Canadian investment data, also find a large output elasticity and relatively small user cost elasticity
estimates. The user cost elasticities rise to around one, however, once the output coefficient is
restricted to unity in accordance with the theory. Estimates from other studies are also summarized
in Table 1 of Chirinko (2008).
4
also provide comprehensive reviews of the more recent models of investment aiming
to account for substantial remaining variations in the investment process due to other
features that are left unexplained by the traditional analysis of the user cost of capital
or Tobin’s q.5
Another strand of research is the construction of relatively small-scale general
equilibrium macroeconomic models for monetary policy evaluation. Gali and Gertler
(2007) provide an outline of a more recent framework that incorporate private sector
expectations of the future short-term interest rates as well as fluctuations in the natu-
ral (flexible price equilibrium) values of output and real interest rates. The framework
is summarized in a baseline three-equation macroeconometric model that describes
how the gap between actual and natural levels of output is influenced by the corre-
sponding long-term real interest rate gap and the gap in Tobin’s q (via an aggregate
demand relation), how the output gap contributes to inflation (aggregate supply re-
lation), and how the short-term nominal interest rate is determined from inflation,
the output gap, and its corresponding natural value (monetary policy). The model
follows the New Keynesian or New Neoclassical Synthesis tradition that combines
elements of the long-run real business cycle theory with the New Keynesian theories
of short-run price adjustments. The macroeconometric model discussed here utilizes
the long-run dimension of this framework in order to theoretically specify restrictions
on the cointegrating vectors for the VECM of relevant macroeconomic variables by
assuming that there is a tendency for output and real interest rates to move towards
their long-run natural (flexible price equilibrium) values as represented by cointegrat-
ing relationships. The investment equation in particular is specified through the user
cost of capital instead of Tobin’s q as used in Gali and Gertler’s paper. This study
therefore complements the macromonetary framework by exploring the general equi-
librium estimation of the investment equation using the long-run user cost of capital
5
See footnote 1 above. Chirinko (1993) provides a survey of the traditional models and the related
investment equations.
5
given some evidence that measures of Tobin’s marginal or average q perform less well
empirically.6
Investment Equation in the Long and Short Run
The long-run neoclassical investment equation is derived in the following section as
a cointegrating relationship between investment and the user cost of capital fol-
lowing Ellis and Price (2004) or between capital-output ratio and the user cost as
in Schaller (2006).7
Output (hence capital stock) is not separately identified in the
neoclassical investment model alone8
but can be determined in a VECM given addi-
tional cointegrating relationships between output, investment and capital stock.
The corresponding short-run model from dynamic optimization, with the addition
of adjustment costs as a function of the investment rate (investment to capital ratio,
I/K) that also allows for the identification of capital stock, is then presented in the
subsequent section. The presence of adjustment costs with capital stock as the state
variable allows the investment rate to be determined from the optimal controls. As
discussed in Hayashi (1982), the modified neoclassical model with adjustment cost
is shown to be equivalent to the q-theory of investment. This equivalence thereby
supports the use of the user cost framework instead of the q-theory commonly uti-
lized in a typical macromonetary model with investment. The traditional models of
investment dynamics presented here are described in Demers et al. (2003) who also
provide a comprehensive discussion of other more recent theoretical developments.9
6
See Demers et al. (2003) and Caballero (1999). A recent study using firm-level panel data, Eberly
et al. (2008), provides a favorable evidence for the q-theoretic framework along the line of Hayashi
(1982) however.
7
The flexible neoclassical theory of investment with the cost of capital originates from Hall and
Jorgenson (1967) seminal work on investment. It is an extension of Jorgenson (1963) with additional
distributed lags of desired capital stock to account for serial correlation in investment in a similar
manner to the flexible accelerator model. See Caballero (1999) for a discussion.
8
Under perfect competition and constant returns to scale production, profits are zero for all
output levels.
9
See footnote 1 and footnote 5 above.
6
The empirical evidence on these models can also be compared with the adjustment
dynamics from the error-correction coefficients of the estimated VECM in this study.
1.1 Long Run Model of Investment
The neoclassical theory of investment of Jorgenson (1963) is based on the first-order
condition from the representative firm’s optimization problem under perfect competi-
tion. By maximizing the present discounted value of its net cash flows subject to the
capital accumulation process for a given level of output (or equivalently maximizing
profits or minimizing costs given output), the firm’s desired amount of capital stock,
K∗
t is obtained from the first-order conditions with respect to capital input, Kt−1
and investment It.10
The resulting optimality condition equates the marginal revenue
product of capital, PY
t · MPKt [= PY
t · FK(K∗
t−1, L∗
t )] to the user cost of capital of
investment, Ct
11
PY
t · MPKt = Ct (1.1)
where the cost of capital is the shadow price (or implicit rental) of a marginal unit
of capital service, Kt per period given the capital accumulation identity ∆Kt =
10
For example, a discrete time version the neoclassical optimal capital accumulation prob-
lem presented in Jorgenson (1967) is max{Kt−1,Lt,It} V =
∞
t=0
(1 + r)−t
PtQt − wtLt − PI
t It s.t.
Ft(Kt−1, Lt) = Qt and ∆Kt = It − δKt−1. See Appendix A.1 for details.
11
Kt−1 is used here in the production function as the capital service input for the period that
corresponds to the capital accumulating identity Kt − Kt−1 = It − δKt−1 as in Jorgenson and Yun
(1991). The user cost of capital derived here as in Jorgenson (1963) is defined as the real rental price
of capital services. See Jorgenson and Yun (1991), Biørn (1989) and references therein for discussions
on the relevant concepts including the price-quantity duality. Capital stock is a weighted sum of past
investments according to the replacement requirements and hence corresponds to the purchase price
of investment goods, PI
t . Capital input, on the other hand, is the service flow for each period from
the capital stock given at the beginning of the period. Investment flow, It therefore corresponds to
the rental price of capital services with the purchase price of investment being a weighted sum of
the future rental prices subject to depreciation. The cost of capital is defined in Jorgenson and Yun
as the user cost, i.e. the rental price discussed here, divided by the purchase price of investment,
Ct/PI
t−1 and therefore depends on the interest rate and depreciation given investment goods price
inflation (see the derived expression for Ct in the text). The cost of capital thus represents an
annualization factor that transforms the purchase price of investment goods, PI
t−1 into the price of
capital, Ct.
7
It − δKt−1 ,
Ct ≡ (1 + r)PI
t−1 − (1 − δ)PI
t (1.2)
Ct ≡ PI
t−1 r + δ − (1 − δ)
PI
t − PI
t−1
PI
t−1
.
Jorgenson and Yun (1991) as in Hall and Jorgenson (1967) also derive the same expres-
sion for the rental price of capital services from a durable good model of production
by differencing the purchase price of investment goods, PI
t written as a weighted sum
of the future rental prices subject to depreciation. Jorgenson and Yun then include
this rental price of capital input in a firm’s optimization problem with equity and
debt finance, and capital income taxation. The representative firm maximizes the
value of outstanding equity shares subject to the cash flow constraint that the value
of distributed dividends less new share issues is equal to the cash flow from production
and new debt issues, less investment expenditures, PI
t It and the interest payments
on outstanding debts. This problem reduces to profit maximization given the value
of the firm’s outstanding capital stock. The expression for the user cost of capital is
similar to (1.2) with the rate of return rt now being a weighted average of rates of
return on debt and equity, rt = λit + (1 − λ)ρt and includes additional terms for the
corporate tax rate, investment tax credit, depreciation allowances and property tax
rate,
Ct ≡ PI
t−1 r + δ − (1 − δ)
PI
t − PI
t−1
PI
t−1
1 − ITCt − τtzt
1 − τt
+ τP
t
where PI
t − PI
t−1 PI
t−1 is the rate of inflation in the price of investment goods;
ITCt is the investment tax credit rate on investment expenditures; τt is the corporate
income tax rate; zt is the present value of the depreciation allowances; and τP
t is the
property tax rate.
This expression is similar to the standard Hall-Jorgenson user cost of capital
commonly used in investment studies. Normalizing investment goods price by the
8
price of output, PY
t , allowing the long-term interest rate and depreciation rate to
vary, and assuming beginning-of-period gross investment, It = ∆Kt+1 + δtKt (so that
Kt now appears in the production function, Ft(Kt, Lt) and the investment goods price
inflation term becomes expected price inflation) the user cost of capital excluding the
additive property tax term is,
CK
t ≡
PI
t
PY
t
rl
t + δt − Et
PI
t+1 − PI
t
PI
t
1 − ITCt − τtzt
1 − τt
. (1.3)
The first-order condition (1.1) can be interpreted as a long-run condition on the
optimal capital stock given output (MPKt = FK(K∗
t , L∗
t )) and the long-run user
cost of capital, CK
t . Assuming a constant elasticity of substitution (CES) production
function,
Yt = (aKσ
t + bLσ
t )1/σ
, (1.4)
and normalizing the price of investment goods in the cost of capital by the price of
output as above, the first-order condition becomes
a
Yt
Kt
1−σ
= CK
t (1.5)
or
Kt =
a
CK
t
1/1 − σ
Yt
in logs,
kt =
1
1 − σ
ln a + yt −
1
1 − σ
ck
t (1.6)
or
kt = α0 + yt + αRRt, Rt ≡ ck
t
kt − yt = α0 + αRRt,
9
˜kt = α0 + αRRt, ˜kt ≡ ln
Kt
Yt
.
Thus the user cost elasticity, αR as defined here is equivalent to the constant elasticity
of substitution between labor and capital; αR ≡ −1/(1 − σ). This is equation (2)
in Schaller (2006) that can be interpreted as a cointegrating relationship between
capital-output ratio and the user cost of capital,
˜kt = α0 + αRRt + zt, zt stationary (1.7)
∆Rt = u2t, u2t stationary
for cointegrating variables ˜kt, Rt .
The optimal capital stock can not be identified separately from output based on the
standard first-order condition alone.12
Therefore the first-order condition can also be
viewed as a cointegrating relationship between capital, output and the user cost as
in Ellis and Price (2004) with a unitary cointegrating coefficient between capital and
output. The user cost elasticity then provides another restriction on the coefficient
of the user cost of capital, Rt(≡ ck
t ) in the cointegrating relationship
kt = α0 + yt − αcRt (1.8)
for cointegrating variables {kt, yt, Rt} where αc ≡ −αR and Rt ≡ ck
t .
Bean (1981) substitutes investment for the optimal capital stock through the
capital accumulation identity (CAI),
Kt = (1 − δt)Kt−1 + It (1.9)
12
See footnote 8 above.
10
or
∆Kt = It − δtKt−1
∆Kt
Kt−1
+ δt =
It
Kt−1
which implies that in the long-run steady state with constant growth in capital stock,
gk
(≡ ∆Kss
Kss
)
gK
+ δ =
I
K
K =
I
gK + δ
so that the long-run steady state capital stock,
kss = iss − ln(gK
ss + δ), in logs (1.10)
with cointegrating variables {k, i} .
This equation provides another cointegrating relation between the variables for the
two-equation VECM of Ellis and Price (2004). Combining equation (1.8) and (1.10)
results in the long-run investment equation (4) in Ellis and Price (2004),
α0 + y − αcR = i − ln(gK
+ δ)
i = α0 + y − αcR + ln(gK
+ δ) (1.11)
which can also be interpreted as a unique cointegrating relationship in a single error
correction mechanism if k, y and R happen to be weakly exogenous to the cointe-
grating relations (1.8) and (1.10) in the two-equation VECM.13
13
Otherwise the two-equation VECM is required for efficient estimation. These weak exogeneity
restrictions can also be tested on the error-correction coefficients of the VECM. See the discussion
in Ellis and Price (2004).
11
1.2 Short Run Investment Dynamics
A common way to capture short-run adjustment towards the desired optimal capital
stock in the traditional investment models is to assume a distributed lag structure
due to various investment adjustment costs. Denote the log of the optimal capital
stock in equation (1.6) as k∗
, a simple partial adjustment mechanism between actual
and desired capital stock can be written as
∆kt = (1 − λ)(k∗
t − kt−1) (1.12)
with the parameter 0 < λ < 1 representing the speed of adjustment towards the opti-
mal capital stock. Substituting for k∗
from equation (1.6) gives the partial adjustment
model,
kt = (1 − λ)
1
1 − σ
ln a + (1 − λ)yt − (1 − λ)
1
1 − σ
ck
t + λkt−1
kt = α0 + (1 − λ)yt − (1 − λ)αcck
t + λkt−1 (1.13)
which is linear in terms of the underlying parameters. With an inclusion of the
disturbance term, εt the model can be estimated by ordinary least squares to find the
(absolute value of) long-run user cost elasticity, αc. An alternative formulation based
on the first-order condition equation (1.5) given in Gilchrist and Zakrajsek (2007) for
example is
∆kt = η + λ ln
Yt
Kt
−
1
1 − σ
ln CK
t
∆kt = η + λ ln
Yt
Kt
− λαc ln CK
t .
where the Yt/Kt term measures firms’ future investment opportunities using oper-
ating income to capital ratio or sales to capital ratio. To obtain the corresponding
distributed lag structure for net investment in the flexible neoclassical model of Hall
12
and Jorgenson (1967) rewrite (1.12) as above,
kt = (1 − λ)k∗
t + λkt−1
and by repeated substitution for the lag capital stock term and take a first difference,
kt =
∞
s=0
(1 − λ)λs
k∗
t−s =
∞
s=0
µsk∗
t−s
∆kt =
∞
s=0
µs∆k∗
t−s. (1.14)
This distributed lag function can be estimated empirically by adding a disturbance
term, limiting the number of lags and substitute for k∗
from equation (1.6) as before.
The capital accumulation identity and growth approximation,
∆kt
∼=
∆Kt
Kt−1
=
It − δKt−1
Kt−1
=
It
Kt−1
− δ
can also be used to write the equation in terms of gross investment as in Tevlin
and Whelan (2003). The partial adjustment model is similar to a linear case of the
geometric lag model as discussed in Koyck (1954) and Greene (2003),
kt = α +
∞
i=0
(1 − λ)λi
yt−i − αc
∞
i=0
(1 − λ)λi
ck
t−i + εt
or
kt = α + B(L)yt − αcB(L)ck
t + εt
where
B(L) ≡ (1 − λ)(1 + λL + λ2
L2
+ λ3
L3
+ . . .) =
1 − λ
1 − λL
and the lag weights wi = (1 − λ)λi
, 0 ≤ wi < 1 decline geometrically. The
short-run elasticity for the user cost term is αc(1 − λ) and the long-run elasticity
13
is αc
∞
i=1
(1 − λ)λi
= αc as before. The model can also be interpreted in terms of
expectations of the log of user cost based on information available at time t, ck∗
t+1|t
and likewise for log output, y∗
t+1|t
kt = α + y∗
t+1|t − αcck∗
t+1|t + εt, (1.15)
with the expectation formation mechanism,
ck∗
t+1|t = λck∗
t|t−1 + (1 − λ)ck∗
t = λLck∗
t+1|t + (1 − λ)ck∗
t
y∗
t+1|t = λy∗
t|t−1 + (1 − λ)y∗
t = λLy∗
t+1|t + (1 − λ)y∗
t
so that the expectations, ck∗
t+1|t and y∗
t+1|t can be written in terms of the current and
past values in the information set as,
ck∗
t+1|t =
1 − λ
1 − λL
ck
t = (1 − λ) ck
t + λck
t−1 + λ2
ck
t−2 + . . .
y∗
t+1|t =
1 − λ
1 − λL
yt = (1 − λ) yt + λyt−1 + λ2
yt−2 + . . . .
Substituting these expressions back into (1.15) results in the geometric distributed
lag model given above,
kt = α+(1−λ) yt + λyt−1 + λ2
yt−2 + . . . −(1−λ)αc ck
t + λck
t−1 + λ2
ck
t−2 + . . . +εt
which can be estimated by nonlinear least squares as discussed in Greene (2003).
This geometric distributed lag model is almost a nonlinear version of the partial
adjustment model given by (1.13) above except for the absence of the lag term, λkt−1.
The autoregressive distributed lag (ARDL) model that encompasses the partial ad-
justment model (a restricted version of the ARDL model without lagged explanatory
14
variables) allows a more general lagged response to yt and ck
t by also including the
lags of the dependent variable kt,
kt = µ +
p
i=1
γikt−i +
r
j=0
µj yt−j − αcck
t−j + εt (1.16)
or equivalently,
C(L)kt = µ + B(L) yt − αcck
t + εt
where
C(L) = 1 − γ1L − γ2L2
− · · · − γpLp
and
B(L) = µ0 + µ1L + µ2L2
+ · · · + µrLr
with the associated distributed lag form,
kt =
µ
C(L)
+
B(L)
C(L)
yt − αcck
t +
1
C(L)
εt
kt =
µ
1 − γ1 − · · · − γp
+
∞
j=0
αjxt−j +
∞
l=0
θlεt−l
where xt = yt−αcck
t and α0, α1, α2, . . . are the coefficients on 1, L, L2
, . . . in B(L)/C(L)
and θ0, θ1, θ2, . . . are the coefficients on 1, L, L2
, . . . in 1/C(L) respectively. The long-
run elasticity is
∞
i=0
αi = B(1)/C(1) = 1 here as in the partial adjustment model above.
The original partial adjustment model (1.13) can be obtained by setting the num-
ber of lags of kt, p in (1.16) to 1 while having no lags for ck
t and yt (i.e. r = 0). The
lagged coefficient γ1 then corresponds to the speed of adjustment, λ in (1.13) whilst
the µ0 coefficient corresponds to (1 − λ). Thus the distributed lag structure under
partial adjustment as represented by (1.14) is equivalent to the ARDL model (1.16)
with p = 1 and r = 0.
15
The distributed lag form of the ARDL model is called a rational lag model in Jor-
genson (1966) and is used in Jorgenson (1963) to write the adjustment process in
terms of gross investment, It = w(L) K∗
t − K∗
t−1 + δKt (or in logs via the growth
approximation as in Tevlin and Whelan (2003) discussed above) where the adjustment
coefficient, w(L) is a product of the power series that cumulatively represents the ad-
justment coefficients of the assumed accumulation identities for gross investment at
each intermediate stages, w(L) = . . . v2(L)v1(L)v0(L) = s(L)/t(L) with polynomials
s(L) and t(L) in the resulting rational function for which the coefficients of the power
series are generated. The user cost parameter is then identified from the coefficient
estimates under the constraint,
∞
τ=0
wτ = 1.
The ARDL model also has an error correction representation that describes how a
deviation from the equilibrium relationship in (1.8) influences the dynamic of adjust-
ments towards the optimal capital stock. For example, rearranging an ARDL(1,1)
model
kt = µ + γ1kt−1 + µ0 yt − αcck
t + µ1 yt−1 − αcck
t−1 + εt
in terms of the differences, results in the error correction model
∆kt = µ + µ0∆ yt − αcck
t + (γ1 − 1) kt−1 − θ yt−1 − αcck
t−1 + εt
where θ = − (µ0 + µ1)/(γ1 − 1) so that θ = −1/(γ1 − 1) in the long run. The third
term on the right-hand side of the error correction model thus reduces to a deviation
from the cointegrating relationship in (1.8).
The flexible neoclassical model as discussed so far has a problem as mentioned
in Caballero (1999), however, in that the same adjustment coefficient, λ in (1.12) or
B(L) in (1.16), is shared by both ck
and y and thus impose rather than allow for
the effect of the cost of capital on investment in addition to that of output. This
problem is remedied by explicitly incorporate adjustment dynamics via the inclusion
16
of adjustment costs of installing new investment goods in the firm’s optimization
problem with capital stock as the state variable and thereby separately identifying
output and capital stock in (1.5).
The neoclassical investment model with adjustment costs can be viewed as a
short run counterpart of the long run model discussed above.14
Due to the presence
of adjustment costs of installing additional units of capital stock, the firm has to
take capital stock for each period as given instead of choosing the capital stock to
be installed at each point in time. The capital stock therefore becomes the state
variable in the firm’s dynamic optimization problem and the control variable is the
investment rate, It/Kt i.e. choosing investment, It hence next period Kt+1 for the
given Kt subject to the capital accumulation identity, Kt+1 = (1 − δ)Kt + It. Given a
possibly convex adjustment cost function, G(It, Kt) where GI > 0, GII > 0, GK < 0
and GKK > 0, and let the maximized value of the variable input, L∗
t ≡ L∗
(Kt, ht)
where ht ≡ (PY
t , wt), the firm’s net cash flows maximization problem becomes,15
max
{It}
V0 =
∞
t=0
E0(1 + rt)−t
Π(Kt, ht) − PI
t It
=
∞
t=0
E0(1 + rt)−t
PY
t F(Kt, L∗
t ) − wtL∗
t − G(It, Kt) − PI
t It
s.t. Kt+1 = (1 − δ)Kt + It; K0 given
for the short-run profit function, Π(Kt, ht). The first-order condition that corresponds
14
See Chirinko (2008), Chirinko (1993) and Caballero (1999) for discussions on different short-run
investment models.
15
See Demers et al. (2003) for this formulation. Appendix A.2 provides the derivation of the
results that follow.
17
to the long-run condition (1.1) is,
Et PY
t+1FK(Kt+1, L∗
t+1) − GK(It+1, Kt+1) = (1 + rt) PI
t + GI (It, Kt)
− (1 − δ)Et PI
t+1 + GI (It+1, Kt+1)
(1.17)
where the left-hand side of the above expression is the discounted value of the expected
future marginal short-run profits, βEtΠK(Kt+1, ht+1) which is the expected next-
period marginal revenue product of capital less the marginal rate of decrease in the
investment adjustment cost given the larger capital stock in next period. Since the
investment adjustment cost falls when the capital stock is larger according to the
convex cost assumption GK < 0 and GKK > 0 above, short-run marginal profits is
larger than the marginal revenue product of capital alone. The right-hand side of
the condition can be thought of as the ‘short-run’ user cost of capital inclusive of
investment adjustment costs,
CSR
t ≡ (1 + rt) PI
t + GI (It, Kt) − (1 − δ)Et PI
t+1 + GI (It+1, Kt+1) .
Comparing this expression with its long-run counterpart in (1.2) the effect of the
adjustment costs on the firm’s cost of capital in the short run is therefore to increase
the purchase price of investment goods, PI
t by an additional amount, GI(It, Kt) given
the existing capital stock, Kt. Similarly, the optimal investment decision for the
current period also depends on the expected marginal adjustment cost next period
EtGI (It+1, Kt+1) as a result of the next period optimal decision in addition to the
expected next period purchase price, EtPI
t+1. The expected future marginal short-run
profits for which this short-run cost of capital is to be compared against in optimiza-
tion is also larger than the marginal revenue product of capital by an additional
amount, GK(It+1, Kt+1) due to the fall in the adjustment cost given larger capital
18
stock in the next period.
As shown in Hayashi (1982), Tobin’s marginal q can be derived from the same
optimization problem with adjustment costs. An equivalent expression for the user
cost of capital with short run adjustment costs in terms of marginal q, is 16
CSR
t ≡ (1 + rt) PI
t qm
t − (1 − δ) Et PI
t+1qm
t+1
where marginal q, qm
t is the ratio of the marginal value of an additional unit of capital
to the purchase price of investment goods, Etλt+1/PI
t . This is the case since the first-
order condition with respect to investment equates the marginal gain in future cash
flow, Etλt+1(= PI
t qm
t ) to the marginal cost of investment which is the sum of the
purchase price of investment goods PI
t and the marginal adjustment cost GI(It, Kt).
Similarly marginal q can be included in the expression for the Hall-Jorgenson cost
of capital in (1.3) that takes into account taxes and depreciation allowances as
CK,SR
t ≡
PI
t
PY
t
rt + δt − Et
PI
t+1qm
t+1 − PI
t qm
t
PI
t qm
t
1 − ITCt − τtzt
1 − τt
.
An alternative parallel remedy to the identification problem is to utilize the long-
run cointegrating relationships given in the previous section assuming that the gap
between the actual capital stock and its optimal value, k − k∗
due to adjustment
costs is transitory and can be included as a stationary residual in the cointegrating
relationships. This is the approach used in Caballero (1994), Schaller (2006) and Ellis
and Price (2004) for aggregate time-series data.17
Caballero (1994) points out that the
ordinary least-square estimate of the long run first-order condition (1.6), called ‘static
OLS’, is biased downwards in small sample due to its failure to capture the correlation
between k − k∗
in the error term and the optimal long-run value as represented by
16
See Appendix A.2 for the derivation and the expression for marginal q in terms of the variables
in the optimization problem.
17
Other studies that use panel data are also given in Table 1 of Chirinko (2008).
19
the right hand side of (1.6). The suggested solution is to follow Stock and Watson
(1993) procedure of including leads and lags of the first difference of the regressor in
order to account for the correlation such that the new error term becomes orthogonal
to the regressor. A ‘dynamic OLS’ specification for (1.8) given in Schaller (2006) is
˜kt = α0 + αRRt +
p
s=−p
βs∆Rt−s + εt. (1.18)
for different number of lags and leads, p which is chosen according to the Bayesian
Information Criterion (BIC) due to degrees of freedom consideration given the limited
number of time-series observations available. Tevlin and Whelan (2003) derive an
ARDL(1,N) model from a short run quadratic cost minimization problem based on
k − k∗
, using k∗
from the long run first-order condition (1.6). The cost minimization
solution provides short run dynamics in the form of a partial adjustment model where,
in each period, kt adjusts towards a weighted average of expected future k∗
t as a moving
target. By specifying output and the cost of capital for k∗
t in (1.6) to follow separate
autoregressive processes, the resulting ARDL model,
kt = α + λkt−1 +
N
i=0
βiyt−i +
N
i=0
γick
t−i + ut (1.19)
contains separate distributed lag polynomial coefficients, β(L) and γ(L) for yt and
ck
t that can be written in terms of the common adjustment coefficient, λ of the short
run partial adjustment model. Since the variables involved are nonstationary, the
estimating equation has an error correction form obtained by rearranging the short
run model (1.19) above so that the variables appear in their first differences. Although
k∗
t is specified according to (1.6), the implied long-run elasticity for output remains
unrestricted in the estimating equilibrium error correction equation however.18
18
See footnote 4 above for the long-run user cost elasticity estimates. Nickell (1985) also describes
how this type of adjustment cost model can often be summarized in a simple VECM.
20
In addition, Ellis and Price (2004) construct a vector error correction model
(VECM) that can be viewed as generalizing the error correction form of the ARDL
framework by allowing endogenous determination of short run adjustment dynamics
among capital stock, output and the user cost towards their long run equilibrium
cointegrating relationships. The cointegration vectors are based on the long-run re-
lations (1.8) and (1.10) derived in section 1.1 above. The cointegration vectors imply
testable restrictions on the βij of the reduced rank matrix, Π = αβ in the VECM,
∆Xt = Γ(L)∆Xt−1 + ΠXt−1 + ΦD
where
ΠXt−1 =









α11 α12
α21 α22
α31 α32
α41 α42












β11 β12 β13 β14
β21 β22 β23 β24












i
k
y
R









t−1
and D may contain deterministic terms and other stationary exogenous variables.
The macroeconometric model presented in the next chapter incorporates similar
dynamics in a larger VECM representation of a structural cointegrated VAR model
that is consistent with the short-run investment models described here in addition to
the macromonetary framework as mentioned at the beginning of this chapter.
Chapter 2
A Macroeconometric Model of
Investment
The macroeconometric model presented in this chapter follows the structural coin-
tegrated VAR methodology as described in Garratt, Lee, Pesaran and Shin (2006)
and Juselius (2006).1
The model is based on theoretically consistent long-run struc-
tural relations represented by approximate log-linear equations with the error terms
summarizing deviations (or ‘long-run structural shocks’) from those of correspond-
ing short-run models. The main long-run relation of interest is the cointegrating
relationship (1.8) derived in the previous chapter,
k∗
t = α0 + yt − αcRt + ut
where k∗
t denotes the optimal long-run capital stock and ut represents the long-run
structural shock arising in part because of the cumulative effects of adjustment costs,
irreversibility, financial constraints, etc. associated with the investment process. Un-
1
Garratt et al. (2006) also compare alternative approaches to macroeconometric modeling and
their corresponding dynamic structures, including those for the type of adjustment cost model
used in Tevlin and Whelan (2003) as mentioned at the end of the previous chapter. Nickell (1985)
describes how short-run adjustment cost models with explicit optimization can often be summarized
by a simple vector error correction model (VECM).
21
22
observable components of the structural relations (e.g. the adjustment gap, kt − k∗
)
are treated as additional error terms in the reduced form relationships that contain
‘long-run reduced form shocks’ as functions of the long-run structural shocks and the
unobserved errors. In the case of the cointegrating relationship (1.8), the associated
reduced form is the relation (2.6) given in the next section,
kt = α0 + yt − αcRt + ξt+1
where ξt+1 = ut+(kt−k∗
t )+. . . is the long-run reduced form shock.2
Given the nonsta-
tionarity of the variables involved, the long-run reduced from shocks are then treated
as deviations from the long-run cointegrating relations that provide error correcting
restrictions in a VECM (vector error correction) representation of a cointegrated VAR
model. For the individual investment relation, ξt becomes an error correction term
that provides error correction feedback towards the cointegration relations whenever
its coefficient in the error correction model is negative. In terms of a single-equation
error correction model,
∆kt = a0 + αξt +
p−1
i=1
∆kt−i + vt
∆kt = a0 + α(kt−1 − α0 − yt−1 + αcRt−1) +
p−1
i=1
∆kt−i + vt.
The model is therefore subject to testing for nonstationarity and the cointegration
property among the observed variables. The rank of cointegration from the test as
suggested by the data will also dictate the appropriate number of long-run reduced
form relations to be obtained from the structural model and hence the number of re-
2
The long-run reduced form shock, ξt+1 is assigned a (t+1) subscript, as in Garratt et al. (2006),
since it may include structural shocks associated with the expectation errors for certain future
variables if they are included in the structural relation. See (2.9) and (2.10) in the next section for
example.
23
strictions necessary for exact identification as described in section 2.2 below. Further
tests of the overidentifying restrictions from these theoretical relations can also be
done to ascertain the validity of the long-run theory.
2.1 Long Run Structural Relations for the VECM
The aggregate supply side for the long-run general equilibrium model consists of a log-
linearized version of the CES production function (1.4) in section 1.1 of the previous
chapter with labor augmenting technological progress that pins down the natural
(flexible price equilibrium) level of output in a similar fashion to the production
function in a real business cycle (RBC) model.3
With labor augmented technology,
At = A0egt
ut growing at rate g and subject to a stochastic mean-zero shock, ut the
production function becomes
Yt = {aKσ
t + b (AtLt)σ
}
1/σ
or after log-linear approximation,4
yt
∼= c0 + c1kt + c3 (a0 + gt + uat) + c3lt
3
A general form of the CES production function due to Arrow et al. (1961) is Yt =
At φ BK
t Kt
σ
+ (1 − φ) BL
t Lt
σ 1/σ
where 1
1−σ is the elasticity of substitution between capi-
tal and labor, φ is the capital share parameter, At is the neutral technical progress, and Bi
t are
factor-biased technical progress. Chirinko (2008) points out that neutral and factor-biased technical
progress cannot be separately identified based on the first-order conditions similar to (1.6) or (2.2).
Another specification of the CES production function is Yt = Ut {φKσ
t + (1 − φ) Lσ
t }
η/σ
where η is
the parameter characterizing returns to scale. Constant returns to scale is assumed in this study
since the time-series nature of the data does not allow a clear distinction between the effects of
economies of scale and technological change. See a comment in chapter 13.2 of Greene (Greene,
2003, p. 284) which discusses the use of firm-level panel data to obtain separate estimates for both
effects.
4
See the derivation in Appendix B.
24
and in terms of reduced form shock and parameters,
yt = b30 + b31t + β31lt + β34kt + ξ3,t+1 (2.1)
The error term representing the reduced form shock, ξ3,t+1, in particular, is pro-
portional to the structural technology shock, uat = ln (ut). Thus the log-linearized
production function (2.1) provides a cointegrating relationship for long-run aggregate
supply to be incorporated into the third row of the VECM as described below.
Labor supply is assumed to be completely elastic and equals to the long-run labor
demand obtained from the first order condition of the same optimization problem for
the representative firm as in section 1.1 of the previous chapter,
PY
t · MPLt = wt
with CES production function,
bAσ
t
Yt
Lt
1−σ
=
wt
PY
t
≡ Wt
or
Lt =
bAσ
t
Wt
1/1 − σ
Yt (2.2)
in logs,
lt =
1
1 − σ
ln b − 1 −
1
1 − σ
ln At + yt −
1
1 − σ
ωt
as a cointegrating relationship
lt = b0 − b1t + yt + αRωt (2.3)
for cointegrating variables {lt, yt, ωt} where ωt is the log of real wage rate and b1 =
25
(1 − 1/1 − σ) g = (1 − αc) g = (1 + αR) g since ln At = a0 + gt + uat. The coefficient
for log real wage, αR is the same as that for the log of user cost of capital in the first
order condition for capital in section 1.1 of the previous chapter. The long-run real
wage elasticity of labor demand is therefore the same as the user cost elasticity of cap-
ital according to the theory. This equivalence provides an additional cross-equation
overidentifying restriction that can be tested as discussed in Barrell et al. (2007). The
labor demand first order condition provides another cointegrating relationship for the
first row of the VECM below,
lt = b10 − b11t + β12yt − β13ωt + ξ1,t+1 (2.4)
where ξ1,t+1 is the structural shock representing short-run deviations from the optimal
labor demand. In a similar manner to the discussion surrounding the cointegrating re-
lationship (1.8) for capital in the previous chapter, output, yt in (2.3) is not separately
identified from labor based on the long-run first order condition alone and therefore
has a unitary cointegrating coefficient. The long run aggregate supply relation (2.1)
above provides another cointegrating vector that, together with the two cointegrating
vectors for capital (1.8) and (1.10) in section 1.1 of the previous chapter, help to
identify the long-run equilibrium output level given the sufficient number of restric-
tions for exact identification as described in section 2.2 below. Thus the cointegrating
relationship (2.3) also imposes a restriction on the the output coefficient relative to
labor demand. With both restrictions, the cointegrating vector (1, −β12, β13) in (2.4)
is restricted to (1, −1, β25) according to the theory where β25 is the reduced form
coefficient for the user cost of capital in (1.8) that represents the main structural
parameter of interest αR, the user cost elasticity.
The remaining element required to complete the long run general equilibrium
model is the standard equilibrium relationship for aggregate demand relating invest-
26
ment to savings given output, that together with the standard Fisher condition and
a yield curve relationship, will identify the long-run equilibrium real interest rates
given the sufficient number of restrictions for exact identification. A log-linear ap-
proximation for the investment-saving (IS) relation, Yt = Ct + It + Gt + NXt is5
yt = d0 + d1ct + d2it + d3gt + d4nxt (2.5)
where the government expenditure, gt is considered exogenous, and consumption, ct
and investment, it depend on the short-term and long-term interest rates respectively.6
Investment is given by the long-run investment relations (1.8) and (1.10) in section 1.1
of the previous chapter. The reduced form long-run relationship for the investment
equation, discussed at the beginning of this chapter, is
kt = b20 + yt − β25Rt + ξ2,t+1 (2.6)
where the reduced form error, ξ2,t+1 represents deviations from the investment first-
order condition (1.6). In addition, the capital accumulation identity (CAI) from (1.10)
that relates capital stock to investment can be incorporated into the IS relation as
yt = d0 + d1ct + d2 kt + ln gK
+ δ + d3gt + d4nxt
with the corresponding reduced form equation,
yt = b40 + β44kt + β46ct + β49gt + β47nxt + ξ4,t+1 (2.7)
where the reduced form error, ξ4,t+1 represents variations from the assumed pattern
of depreciation rate in (1.10). In order to incorporate consumption into the aggregate
5
See Appendix B for the derivation.
6
nxt is defined here as the natural logarithm of the ratio of real exports to imports, nxt ≡
ln(Xt/IMt) in order to avoid taking log of negative numbers.
27
demand, consider the consumption-saving problem for a representative household,
max
{Ct}
E0
∞
t=0
βt
u (Ct)
s.t. Kt+1 = Rc
t+1 (Kt + WtL∗
t − Ct); K0 given
where β is the rate of time preference, Rc
t+1 ≡ (1 + rrt+1) is the rate of return on
the after-tax short term real interest rate, rrt+1 and Wt is the real wage rate. Labor
supply, L∗
is assumed to be completely elastic and equal to labor demand (2.2) in
the long run. The term (Kt + WtL∗
t − Ct) represents gross savings assuming that
the representative household’s total asset holding is a claim on the aggregate capital
stock, Kt (or the present value of capital services in current and future production).
The resulting first-order condition is the usual Euler equation,
u (Ct) = βEtRc
t+1u (Ct+1) .
With constant relative risk aversion (CRRA) utility, u (C) = C1−θ
(1 − θ) for θ > 0
and given the transition equation for the aggregate asset holding, Kt+1 above, the
optimal level of consumption in terms of the state variable, Kt can be written as7
Ct = Kt + WtL∗
t − βEtRc1−θ
t+1
1/θ
Kt (2.8)
which is the total wealth for the period, Kt + WtL∗
t less the optimal savings. By
log-linear approximation,
ct
∼= b0 + b1kt + b2ωt + b2lt − b3 ln Et (1 + rrt+1) (2.9)
where ωt is the log of real wage rate and Rc
t+1 ≡ (1 + rrt+1) as defined above. The
7
See the derivation in Appendix A.3 along the line of Dixit (1990).
28
coefficients are as derived in the appendix B.3 with the constant term, b0 being a
function of the rate of time preference, β and the relative risk aversion coefficient, θ.
In order to distinguish the short-term nominal interest rate, rs
t from inflation, πt+1,
the real rate of return in this expression can be substituted for via a Fisher equation
similar to the Fisher Inflation Parity (FIP) in Garratt et al. (2006),
(1 + rs
t ) = Et (1 + rrt+1) Et (1 + πt+1) exp (ηfip,t+1)
where rs
t is the tax-adjusted nominal interest rate on capital asset held over the period
t and ηfip,t+1 is the associated risk premium that is assumed to follow a stationary
process with a finite mean and variance. Define the log of short-term nominal return
as rt ≡ ln (1 + rs
t ) and using the Fisher relation above, the log of expected real return
becomes
ln Et (1 + rrt+1) = rt − ln (1 + Etπt+1) − ηfip,t+1.
Using log-approximation, ln (1 + πt+1) ≈ πt+1 and assume stationary expectations
error, ηe
π,t+1 in the long run for Etπt+1 = πt+1 exp ηe
π,t+1 as discussed in Garratt et
al. (2006), thus
ln Et (1 + rrt+1) = rt − πt+1 − ηe
π,t+1 − ηfip,t+1. (2.10)
Substituting this expression into the log-linear consumption function (2.9) above
yields
ct = b0 + b1kt + b2ωt + b2lt − b3 rt − πt+1 − ηe
π,t+1 − ηfip,t+1 (2.11)
with the corresponding reduced form cointegrating relationship,
ct = b50 + β51lt + β51ωt + β54kt − β58rrt + ξ5,t+1 (2.12)
29
where rrt = rt − πt+1 and the reduced form shock, ξ5,t+1 is a linear combination of
the long-run structural shocks, ηe
π,t+1 and ηfip,t+1 in addition to other disturbances
that result in short-run deviations from the cointegrating relationship.
The last relation for the model is a reduced form yield curve relationship (Y C)
relating the log short-term real return, rrt to the log of user cost of capital, Rt
in (1.8) of the previous chapter that contains a long-term interest rate component,
rl
t − Et(PI
t+1 − PI
t )/PI
t as in (1.3). With the Y C relation,
Rt = b60 + b68rrt + ξ6,t+1 (2.13)
where the reduced form error, ξ6,t+1 also reflects the stationary expectations error
on the difference between the overall inflation, πt+1 and the investment goods price
inflation, πI
t+1 = PI
t+1 − PI
t PI
t in (1.3), the aggregate demand side for the long-
run general equilibrium model is then given by the IS relation (2.7), the long-run
investment relation (2.6) and the reduced form consumption function (2.12). The ag-
gregate supply and aggregate demand sides are thus linked by the above investment
relations that together provide a complete description of the long-run macroeconomet-
ric model. There is no long-run restriction on inflation except for that its expectations
error, ηe
π,t+1 is stationary and πt+1 moves together with the log nominal interest re-
turn, rt in line with the stationary long-run equilibrium real interest rate according
to the Fisher relation (2.10). Output price, PY
t per se is not separately determined in
the model but is part of the relative investment goods price PI
t /PY
t in the expression
for the endogenous real user cost of capital, Rt in (1.8) that also contains other com-
ponents such as the long-term nominal interest rate, rl
t and investment goods price
inflation, PI
t+1 − PI
t PI
t .
30
2.2 A Vector Error Correction representation for
the Macroeconometric Model
The econometric formulation of the model follows the modeling structure of Gar-
ratt, Lee, Pesaran and Shin (2006) and involves a vector of nine variables zt =
(lt, yt, wt, kt, Rt, ct, nxt, rrt, gt) as defined in the previous section with the log of real
government expenditure, gt being treated as a weakly exogenous or ‘long-run forc-
ing’ (Granger and Lin, 1995) variable for zt = (yt, gt) . Government expenditure,
being long-run forcing, can influence other variables in the cointegration set but is
not affected by any of the reduced form shocks above that represent short-run devi-
ations from the cointegrating relationships. The long-run reduced form errors from
the six cointegrating relations (2.4), (2.6), (2.1), (2.7), (2.12) and (2.13) above can
be written as a linear combination of the cointegrating variables and deterministic
intercept and trends (to ensure that the errors have zero means) as
ξt = β zt−1 − b0 − b1(t − 1) (2.14)
where
ξt = (ξ1,t+1, ξ2,t+1, ξ3,t+1, ξ4,t+1, ξ5,t+1, ξ6,t+1) ,
β =
















1 −1 β25 0 0 0 0 0 0
0 −1 0 1 β25 0 0 0 0
−β31 1 0 −β34 0 0 0 0 0
0 1 0 −β44 0 −β46 −β47 0 −β49
−β51 0 −β51 −β54 0 1 0 +β58 0
0 0 0 0 1 0 0 −β68 0
















31
b0 = (b10, b20, b30, b40, b50, b60) and b1 = (b11, 0, −b31, 0, 0, 0) .
The six long-run cointegrating relations is reproduced again here for convenience:
lt = b10 − b11t + yt − β25ωt + ξ1,t+1 (2.4) Ld
kt = b20 + yt − β25Rt + ξ2,t+1 (2.6) Investment
yt = b30 + b31t + β31lt + β34kt + ξ3,t+1 (2.1) LRAS
yt = b40 + β44kt + β46ct + β47nxt + β49gt + ξ4,t+1 (2.7) IS
ct = b50 + β51lt + β51ωt + β54kt − β58rrt + ξ5,t+1 (2.12) Consumption
Rt = b60 + b68rrt + ξ6,t+1 (2.13) Y C .
Given that the variables in zt = (yt, gt) are difference-stationary i.e. integrated of
order one I(1), the long-run reduced from shocks in ξt which represent deviations from
the long-run cointegrating relations, can be included as the error correction terms in
a VEC(p−1) representation of an otherwise unrestricted pth order cointegrated VAR
model as
∆zt = a0 + αξt +
p−1
i=1
Γi∆zt−i + vt.
or in terms of (2.14),
∆zt = a0 + α [β zt−1 − b0 − b1(t − 1)] +
p−1
i=1
Γi∆zt−i + vt
32
which corresponds to the standard reduced form VECM,8
∆zt = a + bt + Πzt−1 +
p−1
i=1
Γi∆zt−i + vt
= a + Π∗z∗
t−1 +
p−1
i=1
Γi∆zt−i + vt (2.15)
where a = a0 +α (b0 − b1), b = αb1 and Π = αβ , or alternatively, z∗
t−1 = zt−1, t
and Π∗ = αβ∗ with the trend coefficient included in the cointegration vectors β∗ =
(β , −b1). The matrix α is the matrix of adjustment coefficients that indicate the
extent to which the reduced form errors in ξt, that represent deviations from the
cointegrating relationships, provide correction feedbacks on ∆zt. Since the variable
gt is taken to be weakly exogenous, the last row of the α matrix is zero. Thus the
last row in the Π matrix is also zero and the system can be written as a conditional
VEC(p − 1) model,
∆yt = ay + αyb0 + αy [β zt−1 − b1(t − 1)] +
p−1
i=1
Γyi∆zt−i + ψy0∆gt + uyt. (2.16)
where the αy matrix has eight rows corresponding to the eight endogenous variables
in yt, ψy0 is an 8×1 vector coefficient on ∆gt and the 8×1 vector of disturbances, uyt
are i.i.d. (0, Σy). The disturbances in uyt are uncorrelated with vgt in vt = vyt, vgt
with the variance-covariance matrix, Σ =



Σyy Σyg
Σgy σ2
g


. The endogenous dis-
turbance vector vyt in vt, conditionally written as vyt = Σyg(σ2
g)−1
vgt + uyt, has
the uyt component being uncorrelated with vgt under the variance-covariance matrix
8
There are also other error-correction representations of an unrestricted VAR(p) model with the
same long-run level matrix Π = − (I − Π1 − . . . − Πp). If the level zt enters with lag t − p on the
right-hand side as zt−p instead of as first lag zt−1, for example, then the matrix Γi will be different
and become cumulative long-run effect, Γi = − (I − Π1 − . . . − Πi) instead of the transitory effects
when Γi = − (Πi+1 + . . . + Πp) in the representation (2.15) above. The model’s explanatory power
is the same but the coefficient estimates and p-values can be different. See a summary in Pfaff (2006)
and also Juselius (2006) for a discussion on alternative ECM representations.
33
Σy ≡ Σyy − Σyg(σ2
g)−1
Σgy.
In order to statistically separately identify the 9 × 6 cointegrating matrix, β in
Π that contains six cointegrating vectors, 62
= 36 restrictions based on six restric-
tions on each of the six cointegrating vectors are needed. Six restrictions come from
normalizing the coefficients of the variables on the left-hand side of the long-run re-
lationships above to one and therefore 62
− 6 = 30 more restrictions are needed in
order to separately identify β and α in Π. These remaining restrictions for exact
identification are more than provided for by the zero and equality coefficient restric-
tions for the first three and the last two cointegrating relations in the β matrix and
the trend coefficient vector, b1 above as suggested by the theory in the previous sub-
section. The consumption relation on the fifth row of β , for example, contains six
restrictions in β and another zero trend coefficient restriction for the fifth element of
b1. The consumption relation is therefore overidentified by the theory. The remain-
ing IS relation containing five restrictions on the fourth row of β is just identified
with an additional zero restriction on the trend coefficient, b41. The excess restric-
tions on other cointegrating relations can be taken as over-identifying restrictions that
can be imposed and tested relative to the just-identified system. This is the iden-
tification approach discussed in Pesaran and Shin (2002) and Pesaran et al. (2000).
The VECM is estimated using the maximum likelihood (ML) procedure given the
long-run restrictions on the matrix of cointegrating vectors, β . The selection of
the just-identifying restrictions is in accordance with the theoretical relevance of the
remaining over-identifying restrictions in the main investment equation of interest.
Over-identifying restrictions are tested using log-likelihood ratio tests based on the
restricted and unrestricted likelihood from the estimation. The outcomes from this
procedure are discussed along with the subsequent results in chapter 4.
Chapter 3
Data for the U.S. and Canadian
Economies
The data used in this dissertation are aggregate time-series data for the United States
and Canada that represent a large and a small open-economy respectively. Several
other studies that use the data from either of these countries are mentioned at the
beginning of chapter 1. The data set consists of quarterly time series on the vari-
ables zt = (lt, yt, wt, kt, Rt, ct, nxt, rrt, gt) in the VECM of the previous chapter for
the period between the fourth quarter of 1962 and the second quarter of 2006. All
national account variables are in real terms, seasonally adjusted and expressed in
natural logarithms. Capital stock and user cost series, kt and Rt, are calculated from
business machinery and equipment (and software) investment with the corresponding
implicit aggregate price index. The calculation for kt and its depreciation rate follows
the perpetual inventory method and smoothing procedure described in Appendix 2
of Diewert (2008). The log short-term real return measure is calculated based on the
investment goods price inflation and multiplied by the relative investment goods price
so that rrt = [ln(1+rt)−πI
t+1]×PI
t /PY
t . The following sections provide more details
on the data source and variable construction for each country. The constructed series
34
35
are given in the Appendix C.
3.1 U.S. Data
3.1.1 National Account Variables
The national account data on output, expenditure and their implicit prices are ob-
tained from the Bureau of Economic Analysis (BEA) at the U.S. Department of
Commerce and consist of quarterly time series for seasonally adjusted real and nom-
inal gross domestic product and its components for the July 31, 2008 revision of
the National Income and Product Account (NIPA) Table 1.1.6 and Table 1.1.5 re-
spectively. Quarterly real output series yt is calculated as the natural logarithm of
the reported annualized real GDP (Line 1 of Table 1.1.6 in billions of chained 2000
dollars) divided by 400. The series for personal consumption expenditures (Line 2),
ct and government consumption expenditures and gross investment (Line 20), gt are
calculated in the same manner,
yt = ln (‘Gross domestic product’ ÷ 400)
ct = ln (‘Personal consumption expenditures’ ÷ 400)
gt = ln (‘Government consumption expenditures and gross investment’ ÷ 400) .
Net exports, nxt is calculated as the natural logarithm of the ratio of exports
(Line 14) to imports (Line 17) of goods and services in order to avoid taking log of
negative numbers,
nxt = ln(Xt/IMt),
Xt = ‘Exports of goods and services’ ÷ 400
IMt = ‘Imports of goods and services’ ÷ 400 .
Additionally, a narrower measure for output as real gross value added of private
business (from Line 2 of NIPA Table 1.3.6) is also used in order to correspond with
36
1960 1965 1970 1975 1980 1985 1990 1995 2000 2005
1.5
2.0
2.5
3.0
y_t y_b
1960 1965 1970 1975 1980 1985 1990 1995 2000 2005
−0.025
0.000
0.025
0.050
Dy_t Dy_b
Figure 3.1: Log of GDP, yt and business value added, yb and their first differences.
the business sector non-residential capital stock, kt in the investment equation and
to allow comparison with some other studies,1
yb = ln (‘Business gross value added’ ÷ 400) .
Another way to measure output when equipment and software capital is used
in the investment equation is to subtract residential investment and investment in
non-residential structure from GDP. This can be done using Whelan (2002) ‘chain-
subtraction’ procedure since the available data for real variables are in chained dollar
aggregates (NIPA Table 1.1.6). This output measure, yc is suitable for the model in
this study because the long run investment-saving relation (2.7) remains balanced so
1
The nominal business sector gross value added is calculated as GDP minus gross value added of
households and institutions (including services of owner-occupied housing) and gross value added of
general government. See Table 2.1 in BEA (2008) for details. Some cointegration works such as Ellis
and Price (2004) for the UK, AbIorwerth and Danforth (2004) for Canada and Caballero (1994) for
the U.S. use aggregate real GDP or GNP in the investment equation. Shaller (2006) single-equation
DOLS model and Tevlin and Whelan (2003) single-equation ARDL model use private business
output for estimation.
37
1960 1965 1970 1975 1980 1985 1990 1995 2000 2005
2.0
2.5
3.0
y_t y_c
1960 1965 1970 1975 1980 1985 1990 1995 2000 2005
−0.02
0.00
0.02
0.04
Dy_t Dy_c
Figure 3.2: Log of GDP, yt and GDP less (chain-subtracted) residential investment
and investment in non-residential structure, yc and their first differences.
that net export is national savings less investment, S − I = NX in the long run,
given stationary change in private inventories.
The data used in the calculation of the capital stock for equipment and software in-
vestment and its user cost of capital come from the Federal Reserve Board’s FRB/US
model and the corresponding NIPA Underlying Tables 5.5.5U (Private Fixed Invest-
ment in Equipment and Software by Type) and 5.5.6U (Real Private Fixed Investment
in Equipment and Software by Type, Chained Dollars). In the the FRB/US model
as well as the in the NIPA tables, nominal fixed investment in nonresidential equip-
ment and software, EPDN (Line 10 of NIPA Table 1.1.5 or Line 2 of Table 5.5.5U)
can be further divided into high-tech equipment and software, EPDCN (computers,
software, and telecommunication equipment on Line 4 of Table 5.5.5U) and the rest
of the equipment and software investment, EPDON(= EPDN − EPDCN).
38
The capital stocks associated with these investment series can be constructed
using the perpetual inventory method and depreciation rate smoothing procedure as
described in Appendix 2 of Diewert (2008). For the equipment and software (E&S)
capital stock Kt, the underlying nominal investment series, EPDN is divided by real
series, EPD (Line 10 of NIPA Table 1.1.6 or Line 2 of Table 5.5.6U) in millions of
chained (2000) dollars to obtained the implicit price index for equipment investment
goods, PI
. The values of the implicit price index for the fourth quarters are then
used to deflate annual year-end current cost net stock of nonresidential equipment
and software from Line 3 of the BEA’s Fixed Assets Accounts Table 2.1 (multiplied
by 1000 to convert from billion to million dollars) in order to obtain a corresponding
real net stock series. The quarterly real investment series, EPD in annual values is
divided by 4 to obtain quarterly values to be used in conjunction with the annual real
net stock series in order to back out annual ‘balancing depreciation rates’ according
to the perpetual inventory formula i.e. δt = (Kt − Kt+1 + It) /Kt where It = Itq1 +
Itq2 + Itq3 + Itq4.
The annual balancing depreciation rates are then smoothed by running a linear
regression with the corresponding quarterly rates calculated from the regression line,
δt = 0.1178 + 0.0006647t, to reflect the rising trend in the depreciation rates. Quar-
terly E&S capital stock series, Kt is then calculated from the initial year-end stock
in 1959 cumulating forward based on the quarterly real investment series (EPD ÷ 4)
and quarterly values, δt of the annual depreciation rates (divided by four) for each
year by using the perpetual inventory formula, Kt+1 = (1 − δt+1) Kt + It+1. Simi-
lar procedure is also used to calculate the high-tech and non high-tech capital stock
series, Kc
t and Ko
t based on investment in computers, software, and communication
equipment (real EPDC and nominal EPDCN) and E&S investment excluding com-
puters, software, and communication equipment (EPDO and EPDON) and their
corresponding implicit price indices together with the current cost net stocks derived
39
1960 1965 1970 1975 1980 1985 1990 1995 2000 2005
−2.5
0.0
2.5
kt
c
kt
kt
o
1960 1965 1970 1975 1980 1985 1990 1995 2000 2005
0.00
0.02
0.04
∆kt
o
∆kt
∆kt
c
Figure 3.3: Log of equipment and software (kt), high-tech (kc
t ) and non high-tech (ko
t )
capital stocks and their first differences.
40
from Line 3 (nonresidential equipment and software), Line 5 (computers and periph-
eral equipment), Line 6 (software) and Line 7 (communication equipment) of the
BEA’s Fixed Assets Accounts Table 2.1 (multiplied by 1000 to convert from billion
to million dollars). The only difference is that the smoothed depreciation rates used
for the non high-tech stock takes a constant value of 0.128408 which is an average
of the original balancing depreciation rates that show no discernable trend over the
entire sample. Smoothed depreciation rates used for the high-tech stock are obtained
from the regression line, δt = 0.121 + 0.003833t of the original balancing depreciation
rates. Dividing the capital stock series by 100,000 and taking log results in the kt,
kc
t and ko
t series as shown in Figure 3.3 and also given in Appendix C. The steeper
rise in the real high-tech capital stock series, kc
t and the fall of the user cost variable
Rc
t , as calculated below, are largely due to the fall in the relative price of high-tech
investment goods over the sample period as shown in Figure 3.4.
3.1.2 User Costs calculation
The user cost of capital corresponding to different types of capital stock described
above is calculated according to equation (1.3) in section 1.1 of chapter 1 using the
corresponding smoothed depreciation rates δt, implicit prices for investment goods,
PI
t and GDP deflator, PY
t . Other components of the user cost of capital, Rt in-
cluding after-tax real financial cost of capital for producers’ durable equipment2
(RPD), marginal federal corporate income tax rates (TRFCIM), investment tax
credit rates and present value of depreciation allowances are obtained from the Fed-
2
The cost of finance is a weighted average of the cost of debt and equity finance. The cost of
debt is the yield on 5-year Treasury bonds plus a risk premium measured by the spread between
the BAA bond rate and the yield on 10-year Treasury bonds, and allows for the tax deductibility of
interest payments. The expected real return to equity as the equity cost of finance is measured using
effective nominal Moody’s AAA corporate bond rate, minus the average rate of inflation expected to
prevail over the coming 30 years, plus an equity premium obtained by inverting the Gordon growth
formula (as a residual in the theoretical identity linking the dividend-price ratio, expected future
growth rate of real dividends and the real interest rate).
41
1960 1965 1970 1975 1980 1985 1990 1995 2000 2005
2.5
5.0
7.5
10.0
12.5
15.0
17.5
20.0
22.5
25.0
PIc/PY
PI/PY
PIo/PY
Figure 3.4: Relative prices of equipment and software (PI
), high-tech (PIc
) and non
high-tech (PIo
) investment.
42
eral Reserve Board’s FRB/US model.3
The present values of depreciation allowance
for E&S investment (TAPDD) are calculated following the description in Appendix
A of Gilchrist and Zakrajsek (2007) as a weighted average of the original series for
high-tech (TAPDDC) and non high-tech (TAPDDO) investment using nominal in-
vestment series as the weights,
zt =
Ic
t
It
× zc
t +
Io
t
It
× zo
t
where zt is TAPDD, zc
t is TAPDDC, zo
t is TAPDDO and It, Ic
t , Io
t are nominal
EPDN, EPDCN, EPDON for E&S, high-tech and non high-tech investment respec-
tively. The investment tax credit rates for E&S investment (TAPDT) are calculated
from the rates for high-tech (TAPDTC) and non high-tech (TAPDTO) investment
in the same manner. The tax rates used also conform with the description given in
Appendix A (page 267) and Appendix B.3 (page 297) of Gravelle (1994). The log of
user cost of capital for E&S, high-tech and non high-tech investment, Rt, Rc
t and Ro
t
are shown in Figure 3.5. In addition to the long-term user cost, the log short-term
real return measures, rrp
t , rrpc
t and rrpo
t are calculated based on the corresponding in-
vestment goods price inflation and multiplied by the relative investment goods price
so that rrp
t = [ln(1 + rt) − πI
t+1] × PI
t /PY
t where rt is the 3-month certificates of de-
posit rate (from the International Monetary Fund’s International Financial Statistics
database) net of federal average marginal income tax on interest received (from the
National Bureau of Economic Research’s NBER TAXSIM database). The calculated
log short-term real returns rrp
t , rrpc
t and rrpo
t are shown in Figure 3.6.
3
Courtesy of the Macroeconomic and Quantitative Studies division for the tax variables in par-
ticular.
43
1960 1965 1970 1975 1980 1985 1990 1995 2000 2005
−2
−1
0
1 Rt
c
Rt
Rt
o
1960 1965 1970 1975 1980 1985 1990 1995 2000 2005
−0.10
−0.05
0.00
0.05
0.10
0.15
DR_t DRc_t DRo_t
Figure 3.5: Log of user cost of capital for equipment and software (Rt), high-tech
(Rc
t ) and non high-tech (Ro
t ) investment and their first differences.
44
1960 1970 1980 1990 2000 2010
0.0
0.5
1.0
rrt
p
rrt
pc
rrt
po
1960 1970 1980 1990 2000 2010
−0.5
0.0
0.5 ∆rrt
pc
1960 1970 1980 1990 2000 2010
−0.025
0.000
0.025
0.050
rrt
p
rrt
po
1960 1970 1980 1990 2000 2010
0.00
0.05
0.10
0.15
rrt
p
rrt
po
Figure 3.6: Log of short-term real returns for equipment and software (rrp
t ), high-tech
(rrpc
t ) and non high-tech (rrpo
t ) investment goods prices and their first differences.
45
1960 1965 1970 1975 1980 1985 1990 1995 2000 2005
2.4
2.5
2.6
2.7
ωt
1960 1965 1970 1975 1980 1985 1990 1995 2000 2005
−0.01
0.00
0.01
∆ωt
Figure 3.7: Log of real wage, ωt and its first difference.
3.1.3 Employment and Wages
The data for employment and wages are obtained from the U.S. Bureau of Labor
Statistics (BLS). Log of real wage, ωt is the log of seasonally adjusted average
private hourly earnings from the BLS (extrapolated backward from 1964q1 using
the variations in manufacturing hourly earnings for earlier values) divided by the
GDP deflator. The labor variable, lt as total work hours is calculated based on
the BLS’s seasonally adjusted total non-farm employment and average weekly hours:
lt = Employment × Hours × 52 ÷ 100, 000, 000. Average weekly hours prior to 1964q1
are obtained by backward extrapolation based on variation in manufacturing hours.
The plots of log of real wage, ωt and total hours, lt and their first differences are
shown in Figures 3.7 and 3.8. Figures 3.9 and 3.10 give the plots of the constructed
data series for the U.S. and their first differences.
46
1960 1965 1970 1975 1980 1985 1990 1995 2000 2005
0.25
0.50
0.75
lt
1960 1965 1970 1975 1980 1985 1990 1995 2000 2005
−0.02
−0.01
0.00
0.01
0.02 ∆lt
Figure 3.8: Log of total hours, lt and its first difference.
47
1960 1980 2000
0.25
0.50
0.75
1.00
lt
1960 1980 2000
2.0
2.5
3.0
3.5
yt
1960 1980 2000
2.4
2.5
2.6
2.7
wt
1960 1980 2000
2
3
4
kt
1960 1980 2000
−2.0
−1.5
−1.0
Rt
1960 1980 2000
2
3 ct
1960 1980 2000
−0.25
0.00
nxt
1960 1980 2000
0.05
0.10
0.15
0.20
rrpt
1960 1980 2000
1.0
1.5
gt
Figure 3.9: United States data. All variables are in logs.
48
1980 2000
−0.02
0.00
0.02 ∆lt
1980 2000
0.000
0.025
∆yt
∆Rt
1980 2000
−0.01
0.00
0.01
0.02
∆wt
1980 2000
0.01
0.02
∆kt
1980 2000
−0.1
0.0
0.1
1980 2000
−0.02
0.00
0.02
∆ct
∆gt
1980 2000
0.0
0.1 ∆nxt
1980 2000
0.00
0.05 ∆rrpt
1980 2000
0.000
0.025
Figure 3.10: United States data in first differences.
49
3.2 Canadian Data
A similar data set is also constructed for the Canadian economy. National ac-
count variables are obtained from the Organization of Economic Cooperation and
Development (OECD) quarterly national account database. Seasonally adjusted real
GDP, private final consumption expenditure, government final consumption expen-
diture, gross fixed capital formation, exports of goods and services and imports
of goods and services series are in millions of constant (2002) Canadian dollars
(CAN.LNBARSA.2002.S1). GDP deflator comes from the corresponding implicit
price index series (CAN.DNBSA.2002.S1). The log series are obtained by dividing
the original quarterly series by 400 and take log as above.
The capital stock series is calculated from machinery and equipment (M&E) in-
vestment, which also contains a software component and is comparable with the U.S.
E&S investment, by using perpetual inventory method and Diewert (2008) deprecia-
tion smoothing procedure as described above. The quarterly M&E investment data
and the corresponding implicit price index are obtained from Statistics Canada’s
CANSIM II database Table 380-0002, expenditure-based Gross Domestic Product
(Series v1992056: D100115) and Table Table 380-0002 (Series v1997749: D100458).
The corresponding annual asset values for business sector M&E stock, for which
annual balancing depreciation rates are backed out, are obtained from Table 8 in Ap-
pendix 2 of Diewert (2008) and correspond to the national totals from CANSIM Table
378-0004 (National Balance Sheet Accounts, by Sectors) for machinery and equipment
(Series v34677) less the government sector values from Table 378-0004 (Series v32577).
Smoothed depreciation rates follow the regression line δt = 0.12 + 0.00137854t. The
resulting quarterly capital stock series is divided by 10,000 prior to taking log.
The user cost variable is similarly calculated and follows that in Schaller (2006) but
with longer-term interest rates and variable smoothed depreciation rates. The long-
term interest rates are calculated from the average yield on government bonds with
50
maturities greater than 10 years in the IMF’s IFS database plus the difference between
the rates on 90-day prime corporate paper and treasury bill rates and add a constant
fixed risk premium of eight percent so that the calculated user cost is nonnegative.
Data for the tax variables are obtained from Schaller (2006), courtesy of Professor
Schaller, and supplemented with those from other sources including Treff and Perry
(2003), McKenzie and Thompson (1997) and Department of Finance Canada (2007)
for the corporate income tax rates and investment tax credit rates. The present values
of depreciation allowances are calculated from the formula and description in the data
appendix of Schaller (2006) using the rates on 90-day prime corporate paper as the
discount rate. Short-term real rates of return are calculated using the corresponding
annualized investment goods price inflation and multiplied by the relative investment
goods price as described in the previous section where rt is the 90-day prime corporate
paper rates net of the top 5% marginal income tax rates obtained from Saez and Veall
(2003) and OECD (2006).
Seasonally adjusted civilian employment series from the OECD’s Quarterly Labour
Force Statistics database is extrapolated backward from 1965q1 so that earlier val-
ues have their annual averages equal to the annual average values obtained from
Statistics Canada’s Historical Statistics of Canada (Catalogue no. 11-516-XIE Series
D290-317). Total labor hours are then calculated based on the employment series and
average annual hours actually worked per worker obtained from the OECD database4
:
lt = Employment × Hours ÷ 4, 000, 000. The constructed data series for Canada in
natural logarithms and their corresponding growth rates are shown in Figures 3.11
and 3.12.
4
Since no quarterly work hours data are available for the sample period, the annual average value
is simply divided by four for each quarter and thus implying no quarterly variation within a given
year as a result.
51
1960 1980 2000
1.25
1.50
1.75
2.00 lt
1960 1980 2000
2.0
2.5
3.0
3.5 yt
1960 1980 2000
0.4
0.6
0.8 wt
1960 1980 2000
2
3
4
kt
1960 1980 2000
−3
−2
−1
0
Rt
1960 1980 2000
1.5
2.0
2.5
3.0
ct
1960 1980 2000
−0.1
0.0
0.1
0.2 nxt
1960 1980 2000
−0.2
0.0
0.2
rrpt
1960 1980 2000
0.5
1.0
1.5
2.0 gt
Figure 3.11: Canadian data. All variables are in logs.
52
1960 1980 2000
−0.02
0.00
0.02 ∆lt
1960 1980 2000
0.00
0.02
∆yt
1960 1980 2000
0.00
0.02
∆wt
1960 1980 2000
0.01
0.02
∆kt
1960 1980 2000
−1
0
1
2 ∆Rt
1960 1980 2000
0.000
0.025
∆ct
1960 1980 2000
−0.05
0.00
0.05
0.10 ∆nxt
1960 1980 2000
−0.2
0.0
0.2
0.4 ∆rrpt
1960 1980 2000
−0.025
0.000
0.025
0.050 ∆gt
Figure 3.12: Canadian data in first differences.
Chapter 4
VECM Estimation Procedure and
Results
This chapter describes the estimation and testing procedures for the Vector Error
Correction Model of the macroeconomy from section 2.2 of chapter 2 that are applied
to the U.S. and Canadian data. The description follows the structural cointegrated
VAR methodology as laid out in Garratt, Lee, Pesaran and Shin (2006) and Juselius
(2006). The results of alternative empirical specifications for estimating the user cost
elasticity of investment are also discussed in section 4.3.
4.1 Univariate Unit-Root Tests
Prior to estimating the VECM (2.15) or (2.16) in chapter 2, the first step in the anal-
ysis is to ascertain whether the data suggest that the variables in zt are integrated of
order one, I(1) and are cointegrated with similar cointegration ranks as the number of
long-run reduced form theoretical relationships postulated in section 2.1 of chapter 2.
In a univariate setting, several unit-root tests are available to decide whether an in-
dividual variable time series, yt can be described by a non-stationary autoregressive
process with one root for its lag polynomial lying on the unit circle and hence whether
53
54
the series is difference-stationary i.e. I(1) as opposed to being stationary i.e. I(0).1
A zero-mean detrended time series yt represented by an autoregressive process,
a(L)yt =
p
i=0
aiyt−i = εt
where a(L) =
p
i=0
aiLi
is the lag polynomial of the lag operator Li
yt = yt−i and εt is
a serially uncorrelated white noise stationary process, has an autoregressive unit root
if one of the roots, λj of the polynomial2
a(L) =
p
i=0
aiLi
=
p
j=1
(1 − λjL)
equals unity in absolute value i.e. one root (real or complex) lies on the unit circle.
The yt series with a unit root is non-stationary I(1) and needs to be differenced once
in order to remove the unit root and become weakly stationary. To test whether yt
contains one unit root against the stationary alternative (all roots lie inside the unit
circle, |λj| < 1) when the error process εt may also be serially correlated and yt may
be trending, the augmented Dickey-Fuller (ADF) test due to Dickey and Fuller (1981)
can be implemented by running the regression,
∆yt = α + µt + βyt−1 +
k
i=1
γi∆yt−i + ut
where the augmented lag length, k can be chosen using a general-to-specific approach
starting from a largest lag length and remove the last lagged difference if it is found to
be insignificant, or chosen according to some information criteria such as the Akaike
Information Criterion (AIC) and the Schwarz Criterion (SC), or by testing for the
1
For discussions on the unit root concepts given here see Doornik and Hendry (2007a), Pfaff
(2006), Greene (2003) and Maddala and Kim (1998) where several other unit root tests are also
provided.
2
λj are inverses of the roots of the characteristic equation, a(L) = 0.
55
absence of serial correlation in the residuals. The trend and drift terms can consecu-
tively be removed if µ and α are not significant. The critical values for the t-statistics
have been tabulated by Engle and Yoo (1987) and Phillips and Ouliaris (1990) for
different cases. MacKinnon (1991) also provides estimates from response surface re-
gressions that can be used to derive the critical values for small sample sizes. The
ADF-test results below are based on these derived critical values of the t-statistics
for the cases with a constant, α or constant and trend terms, α + µt included in the
regression.
The null hypothesis, H0 : β = 0 implies the presence of a unit root and the first
difference series, ∆yt can be represented by a stationary AR(k) process so that yt
is difference-stationary i.e. I(1). Trending behavior differs under the null and the
stationary alternative. The process yt will have a zero mean under the stationary
alternative if the α term is not included whereas the presence of α indicates a trend
in yt under the unit root null when β = 0. ADF test may have low power against
the stationary alternative for a near unit-root process in small sample and a large lag
length, k however and several other alternative tests as discussed in Maddala and Kim
(1998) and Pfaff (2006) can also be used. The ADF test results for individual time
series of the variables in zt are given in Tables 4.1 and 4.2 for the U.S. and Canadian
data respectively for the maximum augmented lag length of four and effective sample
size of 172 from 1963q3 to 2006q2. The null hypothesis of a unit root cannot be
rejected for most variables at the optimal lag length chosen according to the signif-
icance of the longest lag difference coefficient and the Akaike Information Criterion
(AIC). The unit root null is rejected for the log of output (yt, yb, yc), employment (lt),
consumption (ct) and net export (nxt) series in the U.S. data, and capital stock (kt),
user cost (Rt) and short-term real returns (rrp
t ) in the Canadian data however. Even
though the unit root hypothesis is rejected for these series, most of the estimated ˆβ
coefficients are close to zero and the implied AR coefficients (= 1+ ˆβ) are close to one
56
Table 4.1: ADF unit root tests for the U.S. data.
lt yt yb yc wt kt kc
t ko
t
Test statistic -3.520* -4.363** -4.306** -4.176** -1.765 -2.559 -2.479 -2.940
1 + ˆβ 0.94900 0.89550 0.88637 0.89710 0.98818 0.99530 0.99360 0.99689
Lag length 1 2 2 2 3 3 3 3
Rt Rc
t Ro
t ct nxt rrp
t gt
Test statistic -1.867 -2.833 -2.583 -4.091** -3.134* -2.548 -2.921
1 + ˆβ 0.96364 0.93117 0.93218 0.92563 0.93793 0.92458 0.95373
Lag length 4 4 4 3 4 3 4
United States Data. ADF regressions: ∆yt = α + µt + βyt−1 + γ1∆yt−1 + . . . + γk∆yt−k + ut.
Exclude time trend in the regressions of Ro
t and nxt. Critical values derived from the response
surfaces in MacKinnon (1991): 5% = −3.44, 1% = −4.01 with a constant and time trend;
5% = −2.88, 1% = −3.47 without time trend, for an effective sample size of 172, 1963q3-
2006q2. Optimal lag length, k chosen according to the AIC and significance of the last lagged
difference with a maximum of 4 lags.
Table 4.2: ADF unit root tests for Canadian data.
lt yt wt kt Rt
Test statistic -2.834 -2.903 -0.9327 -5.215** -4.074**
1 + ˆβ 0.95656 0.96552 0.98416 0.98281 0.63690
Lag length 1 1 4 1 2
ct nxt rrp
t gt
Test statistic -2.386 -2.287 -3.273* -3.034
1 + ˆβ 0.97280 0.93758 0.70794 0.97218
Lag length 3 0 3 4
Canadian Data. ADF regressions: ∆yt = α + µt + βyt−1 + γ1∆yt−1 + . . . +
γk∆yt−k + ut. Exclude time trend in the regressions of nxt and rrp
t . Critical
values derived from the response surfaces in MacKinnon (1991): 5% = −3.44,
1% = −4.01 with a constant and time trend; 5% = −2.88, 1% = −3.47
without time trend, for an effective sample size of 172, 1963q3-2006q2. Optimal
lag length, k chosen according to the AIC and significance of the last lagged
difference with a maximum of 4 lags.
Macroeconometrics of Investment and the User Cost of Capital

More Related Content

Similar to Macroeconometrics of Investment and the User Cost of Capital

MSc_Thesis_ORR
MSc_Thesis_ORRMSc_Thesis_ORR
MSc_Thesis_ORROscar Ram
 
Good report on Adders/Prefix adders
Good report on Adders/Prefix addersGood report on Adders/Prefix adders
Good report on Adders/Prefix addersPeeyush Pashine
 
Backtesting Value at Risk and Expected Shortfall with Underlying Fat Tails an...
Backtesting Value at Risk and Expected Shortfall with Underlying Fat Tails an...Backtesting Value at Risk and Expected Shortfall with Underlying Fat Tails an...
Backtesting Value at Risk and Expected Shortfall with Underlying Fat Tails an...Stefano Bochicchio
 
NUMERICAL SIMULATION OF FLOW THROUGH
NUMERICAL SIMULATION OF FLOW THROUGHNUMERICAL SIMULATION OF FLOW THROUGH
NUMERICAL SIMULATION OF FLOW THROUGHHassan El Sheshtawy
 
WillieOngPhDThesisFinalDuke2015
WillieOngPhDThesisFinalDuke2015WillieOngPhDThesisFinalDuke2015
WillieOngPhDThesisFinalDuke2015Willie Ong
 
Integral Equation Formalism for Electromagnetic Scattering from Small Particles
Integral Equation Formalism for Electromagnetic Scattering from Small ParticlesIntegral Equation Formalism for Electromagnetic Scattering from Small Particles
Integral Equation Formalism for Electromagnetic Scattering from Small ParticlesHo Yin Tam
 
Rf circuit non linearity characterization
Rf circuit non linearity characterizationRf circuit non linearity characterization
Rf circuit non linearity characterizationNizam Din
 
Michael_Lavrentiev_Trans trating.PDF
Michael_Lavrentiev_Trans trating.PDFMichael_Lavrentiev_Trans trating.PDF
Michael_Lavrentiev_Trans trating.PDFaniruddh Tyagi
 
Michael_Lavrentiev_Trans trating.PDF
Michael_Lavrentiev_Trans trating.PDFMichael_Lavrentiev_Trans trating.PDF
Michael_Lavrentiev_Trans trating.PDFAniruddh Tyagi
 
Michael_Lavrentiev_Trans trating.PDF
Michael_Lavrentiev_Trans trating.PDFMichael_Lavrentiev_Trans trating.PDF
Michael_Lavrentiev_Trans trating.PDFaniruddh Tyagi
 
Optimized Communication in 5G-Driven
Optimized Communication in 5G-DrivenOptimized Communication in 5G-Driven
Optimized Communication in 5G-DrivenAbdoHassan41
 

Similar to Macroeconometrics of Investment and the User Cost of Capital (20)

MSc_Thesis_ORR
MSc_Thesis_ORRMSc_Thesis_ORR
MSc_Thesis_ORR
 
Charles Tatossian - Thesis
Charles Tatossian - ThesisCharles Tatossian - Thesis
Charles Tatossian - Thesis
 
thesis-despoina
thesis-despoinathesis-despoina
thesis-despoina
 
Good report on Adders/Prefix adders
Good report on Adders/Prefix addersGood report on Adders/Prefix adders
Good report on Adders/Prefix adders
 
Uhm cee-03-03
Uhm cee-03-03Uhm cee-03-03
Uhm cee-03-03
 
Backtesting Value at Risk and Expected Shortfall with Underlying Fat Tails an...
Backtesting Value at Risk and Expected Shortfall with Underlying Fat Tails an...Backtesting Value at Risk and Expected Shortfall with Underlying Fat Tails an...
Backtesting Value at Risk and Expected Shortfall with Underlying Fat Tails an...
 
NUMERICAL SIMULATION OF FLOW THROUGH
NUMERICAL SIMULATION OF FLOW THROUGHNUMERICAL SIMULATION OF FLOW THROUGH
NUMERICAL SIMULATION OF FLOW THROUGH
 
WillieOngPhDThesisFinalDuke2015
WillieOngPhDThesisFinalDuke2015WillieOngPhDThesisFinalDuke2015
WillieOngPhDThesisFinalDuke2015
 
Integral Equation Formalism for Electromagnetic Scattering from Small Particles
Integral Equation Formalism for Electromagnetic Scattering from Small ParticlesIntegral Equation Formalism for Electromagnetic Scattering from Small Particles
Integral Equation Formalism for Electromagnetic Scattering from Small Particles
 
Rf circuit non linearity characterization
Rf circuit non linearity characterizationRf circuit non linearity characterization
Rf circuit non linearity characterization
 
Thesis
ThesisThesis
Thesis
 
2010_09_rs_ea
2010_09_rs_ea2010_09_rs_ea
2010_09_rs_ea
 
Michael_Lavrentiev_Trans trating.PDF
Michael_Lavrentiev_Trans trating.PDFMichael_Lavrentiev_Trans trating.PDF
Michael_Lavrentiev_Trans trating.PDF
 
Michael_Lavrentiev_Trans trating.PDF
Michael_Lavrentiev_Trans trating.PDFMichael_Lavrentiev_Trans trating.PDF
Michael_Lavrentiev_Trans trating.PDF
 
Michael_Lavrentiev_Trans trating.PDF
Michael_Lavrentiev_Trans trating.PDFMichael_Lavrentiev_Trans trating.PDF
Michael_Lavrentiev_Trans trating.PDF
 
MastersThesis
MastersThesisMastersThesis
MastersThesis
 
iosdft
iosdftiosdft
iosdft
 
phdthesis
phdthesisphdthesis
phdthesis
 
Optimized Communication in 5G-Driven
Optimized Communication in 5G-DrivenOptimized Communication in 5G-Driven
Optimized Communication in 5G-Driven
 
Iers conventions
Iers conventionsIers conventions
Iers conventions
 

Recently uploaded

Strategic Resources May 2024 Corporate Presentation
Strategic Resources May 2024 Corporate PresentationStrategic Resources May 2024 Corporate Presentation
Strategic Resources May 2024 Corporate PresentationAdnet Communications
 
Call Girls Banaswadi Just Call 👗 7737669865 👗 Top Class Call Girl Service Ban...
Call Girls Banaswadi Just Call 👗 7737669865 👗 Top Class Call Girl Service Ban...Call Girls Banaswadi Just Call 👗 7737669865 👗 Top Class Call Girl Service Ban...
Call Girls Banaswadi Just Call 👗 7737669865 👗 Top Class Call Girl Service Ban...amitlee9823
 
Vip Call US 📞 7738631006 ✅Call Girls In Sakinaka ( Mumbai )
Vip Call US 📞 7738631006 ✅Call Girls In Sakinaka ( Mumbai )Vip Call US 📞 7738631006 ✅Call Girls In Sakinaka ( Mumbai )
Vip Call US 📞 7738631006 ✅Call Girls In Sakinaka ( Mumbai )Pooja Nehwal
 
Kharghar Blowjob Housewife Call Girls NUmber-9833754194-CBD Belapur Internati...
Kharghar Blowjob Housewife Call Girls NUmber-9833754194-CBD Belapur Internati...Kharghar Blowjob Housewife Call Girls NUmber-9833754194-CBD Belapur Internati...
Kharghar Blowjob Housewife Call Girls NUmber-9833754194-CBD Belapur Internati...priyasharma62062
 
VIP Kalyan Call Girls 🌐 9920725232 🌐 Make Your Dreams Come True With Mumbai E...
VIP Kalyan Call Girls 🌐 9920725232 🌐 Make Your Dreams Come True With Mumbai E...VIP Kalyan Call Girls 🌐 9920725232 🌐 Make Your Dreams Come True With Mumbai E...
VIP Kalyan Call Girls 🌐 9920725232 🌐 Make Your Dreams Come True With Mumbai E...roshnidevijkn ( Why You Choose Us? ) Escorts
 
Q1 2024 Conference Call Presentation vF.pdf
Q1 2024 Conference Call Presentation vF.pdfQ1 2024 Conference Call Presentation vF.pdf
Q1 2024 Conference Call Presentation vF.pdfAdnet Communications
 
7 tips trading Deriv Accumulator Options
7 tips trading Deriv Accumulator Options7 tips trading Deriv Accumulator Options
7 tips trading Deriv Accumulator OptionsVince Stanzione
 
Lion One Corporate Presentation May 2024
Lion One Corporate Presentation May 2024Lion One Corporate Presentation May 2024
Lion One Corporate Presentation May 2024Adnet Communications
 
Call Girls Service Pune ₹7.5k Pick Up & Drop With Cash Payment 9352852248 Cal...
Call Girls Service Pune ₹7.5k Pick Up & Drop With Cash Payment 9352852248 Cal...Call Girls Service Pune ₹7.5k Pick Up & Drop With Cash Payment 9352852248 Cal...
Call Girls Service Pune ₹7.5k Pick Up & Drop With Cash Payment 9352852248 Cal...roshnidevijkn ( Why You Choose Us? ) Escorts
 
falcon-invoice-discounting-unlocking-prime-investment-opportunities
falcon-invoice-discounting-unlocking-prime-investment-opportunitiesfalcon-invoice-discounting-unlocking-prime-investment-opportunities
falcon-invoice-discounting-unlocking-prime-investment-opportunitiesFalcon Invoice Discounting
 
Technology industry / Finnish economic outlook
Technology industry / Finnish economic outlookTechnology industry / Finnish economic outlook
Technology industry / Finnish economic outlookTechFinland
 
8377087607, Door Step Call Girls In Kalkaji (Locanto) 24/7 Available
8377087607, Door Step Call Girls In Kalkaji (Locanto) 24/7 Available8377087607, Door Step Call Girls In Kalkaji (Locanto) 24/7 Available
8377087607, Door Step Call Girls In Kalkaji (Locanto) 24/7 Availabledollysharma2066
 
Business Principles, Tools, and Techniques in Participating in Various Types...
Business Principles, Tools, and Techniques  in Participating in Various Types...Business Principles, Tools, and Techniques  in Participating in Various Types...
Business Principles, Tools, and Techniques in Participating in Various Types...jeffreytingson
 
Stock Market Brief Deck (Under Pressure).pdf
Stock Market Brief Deck (Under Pressure).pdfStock Market Brief Deck (Under Pressure).pdf
Stock Market Brief Deck (Under Pressure).pdfMichael Silva
 
Webinar on E-Invoicing for Fintech Belgium
Webinar on E-Invoicing for Fintech BelgiumWebinar on E-Invoicing for Fintech Belgium
Webinar on E-Invoicing for Fintech BelgiumFinTech Belgium
 
Diva-Thane European Call Girls Number-9833754194-Diva Busty Professional Call...
Diva-Thane European Call Girls Number-9833754194-Diva Busty Professional Call...Diva-Thane European Call Girls Number-9833754194-Diva Busty Professional Call...
Diva-Thane European Call Girls Number-9833754194-Diva Busty Professional Call...priyasharma62062
 
Mira Road Memorable Call Grls Number-9833754194-Bhayandar Speciallty Call Gir...
Mira Road Memorable Call Grls Number-9833754194-Bhayandar Speciallty Call Gir...Mira Road Memorable Call Grls Number-9833754194-Bhayandar Speciallty Call Gir...
Mira Road Memorable Call Grls Number-9833754194-Bhayandar Speciallty Call Gir...priyasharma62062
 

Recently uploaded (20)

(INDIRA) Call Girl Srinagar Call Now 8617697112 Srinagar Escorts 24x7
(INDIRA) Call Girl Srinagar Call Now 8617697112 Srinagar Escorts 24x7(INDIRA) Call Girl Srinagar Call Now 8617697112 Srinagar Escorts 24x7
(INDIRA) Call Girl Srinagar Call Now 8617697112 Srinagar Escorts 24x7
 
Strategic Resources May 2024 Corporate Presentation
Strategic Resources May 2024 Corporate PresentationStrategic Resources May 2024 Corporate Presentation
Strategic Resources May 2024 Corporate Presentation
 
Call Girls Banaswadi Just Call 👗 7737669865 👗 Top Class Call Girl Service Ban...
Call Girls Banaswadi Just Call 👗 7737669865 👗 Top Class Call Girl Service Ban...Call Girls Banaswadi Just Call 👗 7737669865 👗 Top Class Call Girl Service Ban...
Call Girls Banaswadi Just Call 👗 7737669865 👗 Top Class Call Girl Service Ban...
 
Vip Call US 📞 7738631006 ✅Call Girls In Sakinaka ( Mumbai )
Vip Call US 📞 7738631006 ✅Call Girls In Sakinaka ( Mumbai )Vip Call US 📞 7738631006 ✅Call Girls In Sakinaka ( Mumbai )
Vip Call US 📞 7738631006 ✅Call Girls In Sakinaka ( Mumbai )
 
W.D. Gann Theory Complete Information.pdf
W.D. Gann Theory Complete Information.pdfW.D. Gann Theory Complete Information.pdf
W.D. Gann Theory Complete Information.pdf
 
Kharghar Blowjob Housewife Call Girls NUmber-9833754194-CBD Belapur Internati...
Kharghar Blowjob Housewife Call Girls NUmber-9833754194-CBD Belapur Internati...Kharghar Blowjob Housewife Call Girls NUmber-9833754194-CBD Belapur Internati...
Kharghar Blowjob Housewife Call Girls NUmber-9833754194-CBD Belapur Internati...
 
VIP Kalyan Call Girls 🌐 9920725232 🌐 Make Your Dreams Come True With Mumbai E...
VIP Kalyan Call Girls 🌐 9920725232 🌐 Make Your Dreams Come True With Mumbai E...VIP Kalyan Call Girls 🌐 9920725232 🌐 Make Your Dreams Come True With Mumbai E...
VIP Kalyan Call Girls 🌐 9920725232 🌐 Make Your Dreams Come True With Mumbai E...
 
(Vedika) Low Rate Call Girls in Pune Call Now 8250077686 Pune Escorts 24x7
(Vedika) Low Rate Call Girls in Pune Call Now 8250077686 Pune Escorts 24x7(Vedika) Low Rate Call Girls in Pune Call Now 8250077686 Pune Escorts 24x7
(Vedika) Low Rate Call Girls in Pune Call Now 8250077686 Pune Escorts 24x7
 
Q1 2024 Conference Call Presentation vF.pdf
Q1 2024 Conference Call Presentation vF.pdfQ1 2024 Conference Call Presentation vF.pdf
Q1 2024 Conference Call Presentation vF.pdf
 
7 tips trading Deriv Accumulator Options
7 tips trading Deriv Accumulator Options7 tips trading Deriv Accumulator Options
7 tips trading Deriv Accumulator Options
 
Lion One Corporate Presentation May 2024
Lion One Corporate Presentation May 2024Lion One Corporate Presentation May 2024
Lion One Corporate Presentation May 2024
 
Call Girls Service Pune ₹7.5k Pick Up & Drop With Cash Payment 9352852248 Cal...
Call Girls Service Pune ₹7.5k Pick Up & Drop With Cash Payment 9352852248 Cal...Call Girls Service Pune ₹7.5k Pick Up & Drop With Cash Payment 9352852248 Cal...
Call Girls Service Pune ₹7.5k Pick Up & Drop With Cash Payment 9352852248 Cal...
 
falcon-invoice-discounting-unlocking-prime-investment-opportunities
falcon-invoice-discounting-unlocking-prime-investment-opportunitiesfalcon-invoice-discounting-unlocking-prime-investment-opportunities
falcon-invoice-discounting-unlocking-prime-investment-opportunities
 
Technology industry / Finnish economic outlook
Technology industry / Finnish economic outlookTechnology industry / Finnish economic outlook
Technology industry / Finnish economic outlook
 
8377087607, Door Step Call Girls In Kalkaji (Locanto) 24/7 Available
8377087607, Door Step Call Girls In Kalkaji (Locanto) 24/7 Available8377087607, Door Step Call Girls In Kalkaji (Locanto) 24/7 Available
8377087607, Door Step Call Girls In Kalkaji (Locanto) 24/7 Available
 
Business Principles, Tools, and Techniques in Participating in Various Types...
Business Principles, Tools, and Techniques  in Participating in Various Types...Business Principles, Tools, and Techniques  in Participating in Various Types...
Business Principles, Tools, and Techniques in Participating in Various Types...
 
Stock Market Brief Deck (Under Pressure).pdf
Stock Market Brief Deck (Under Pressure).pdfStock Market Brief Deck (Under Pressure).pdf
Stock Market Brief Deck (Under Pressure).pdf
 
Webinar on E-Invoicing for Fintech Belgium
Webinar on E-Invoicing for Fintech BelgiumWebinar on E-Invoicing for Fintech Belgium
Webinar on E-Invoicing for Fintech Belgium
 
Diva-Thane European Call Girls Number-9833754194-Diva Busty Professional Call...
Diva-Thane European Call Girls Number-9833754194-Diva Busty Professional Call...Diva-Thane European Call Girls Number-9833754194-Diva Busty Professional Call...
Diva-Thane European Call Girls Number-9833754194-Diva Busty Professional Call...
 
Mira Road Memorable Call Grls Number-9833754194-Bhayandar Speciallty Call Gir...
Mira Road Memorable Call Grls Number-9833754194-Bhayandar Speciallty Call Gir...Mira Road Memorable Call Grls Number-9833754194-Bhayandar Speciallty Call Gir...
Mira Road Memorable Call Grls Number-9833754194-Bhayandar Speciallty Call Gir...
 

Macroeconometrics of Investment and the User Cost of Capital

  • 1. MACROECONOMETRICS OF INVESTMENT AND THE USER COST OF CAPITAL BY Thethach Chuaprapaisilp BSc, London School of Economics, 2001 MSc, University of Warwick, 2002 MA, Georgetown University, 2005 DISSERTATION SUBMITTED IN PARTIAL FULFILLMENT OF THE REQUIREMENTS FOR THE DEGREE OF DOCTOR OF PHILOSOPHY IN THE DEPARTMENT OF ECONOMICS AT FORDHAM UNIVERSITY NEW YORK APRIL, 2009
  • 2. ACKNOWLEDGEMENTS First and foremost, I would like to thank my parents for their support throughout almost thirty years of my education. I am very grateful for helpful advice and guid- ance from my dissertation committee, my mentor Prof. Bartholomew J. Moore and my readers Prof. Erick W. Rengifo and Prof. Hrishikesh D. Vinod, that help make my research efforts substantially materialized. I thank Professor Huntley Schaller for providing Canadian cost of capital taxation data and thank the Macroeconomic and Quantitative Studies division at the Federal Reserve Board for the U.S. data. I also benefited from comments and suggestions provided by participants from the Economics department during the Fordham University Graduate Students session at the 2009 Eastern Economic Association conference. Graduate economics classes and the tutoring position at the Economics Tutoring Center also enhanced my learning and general understanding of the subjects. I thank the professors and staff for their generosity and dedication. Special thanks are due to those who help provided references and letters of rec- ommendation at various stages of my education that enabled me to make progress on my educational path. I thank all the teachers and supervisors since my early years in Thailand, Australia, the U.K. and U.S. for their patience and liberality. Their efforts have contributed to much of my success. I would also like to thank my colleagues, family friends and relatives who gave me support in many ways throughout the years. i
  • 3. Contents 1 Introduction 1 1.1 Long Run Model of Investment . . . . . . . . . . . . . . . . . . . . . 6 1.2 Short Run Investment Dynamics . . . . . . . . . . . . . . . . . . . . 11 2 A Macroeconometric Model of Investment 21 2.1 Long Run Structural Relations for the VECM . . . . . . . . . . . . . 23 2.2 A Vector Error Correction representation for the Macroeconometric Model . . . . . . . . . . . . . . . . . . . . . . . . . . . . . . . . . . . 30 3 Data for the U.S. and Canadian Economies 34 3.1 U.S. Data . . . . . . . . . . . . . . . . . . . . . . . . . . . . . . . . . 35 3.1.1 National Account Variables . . . . . . . . . . . . . . . . . . . 35 3.1.2 User Costs calculation . . . . . . . . . . . . . . . . . . . . . . 40 3.1.3 Employment and Wages . . . . . . . . . . . . . . . . . . . . . 45 3.2 Canadian Data . . . . . . . . . . . . . . . . . . . . . . . . . . . . . . 49 4 VECM Estimation Procedure and Results 53 4.1 Univariate Unit-Root Tests . . . . . . . . . . . . . . . . . . . . . . . . 53 4.2 Johansen’s Maximum Likelihood Estimation and Cointegration Rank Tests . . . . . . . . . . . . . . . . . . . . . . . . . . . . . . . . . . . . 59 4.3 Estimation of the Long Run Relations . . . . . . . . . . . . . . . . . 70 ii
  • 4. 5 Extension with R&D Capital and Technology 109 5.1 Production relations with neutral or capital-biased technological progress109 5.2 R&D investment and capital stock . . . . . . . . . . . . . . . . . . . 113 5.3 VECM estimation with R&D technology . . . . . . . . . . . . . . . . 121 6 Conclusion 132 Bibliography 142 A Derivation of the optimality conditions 151 A.1 Neoclassical optimal capital accumulation problem for condition (1.1) 151 A.2 Neoclassical investment model with short-run adjustment costs . . . . 153 A.3 Household consumption-saving problem for condition (2.8) . . . . . . 156 B Log-linear approximation for structural relations in Chapter 2 160 B.1 Long-run aggregate supply relation (2.1) . . . . . . . . . . . . . . . . 160 B.1.1 Extension to the case with additional neutral technology in Chapter 5 . . . . . . . . . . . . . . . . . . . . . 162 B.1.2 Extension to the case with capital augmenting technology in Chapter 5 . . . . . . . . . . . . . . . . . . . . . 162 B.2 Investment-Saving (IS) relation (2.5) . . . . . . . . . . . . . . . . . . 164 B.3 Optimal consumption relation (2.9) . . . . . . . . . . . . . . . . . . . 165 C Data and batch codes for VECM estimation 168 C.1 U.S. Data . . . . . . . . . . . . . . . . . . . . . . . . . . . . . . . . . 168 C.2 Canadian Data . . . . . . . . . . . . . . . . . . . . . . . . . . . . . . 176 C.3 Batch codes for VECM estimation . . . . . . . . . . . . . . . . . . . . 180 Abstract Vita iii
  • 5. List of Tables 4.1 ADF unit root tests for the U.S. data. . . . . . . . . . . . . . . . . . 56 4.2 ADF unit root tests for Canadian data. . . . . . . . . . . . . . . . . . 56 4.3 ADF-GLS unit root tests for the U.S. data. . . . . . . . . . . . . . . . 58 4.4 ADF-GLS unit root tests for Canadian data. . . . . . . . . . . . . . . 58 4.5 ADF unit root tests for the U.S. data in first differences. . . . . . . . 60 4.6 ADF unit root tests for Canadian data in first differences. . . . . . . 60 4.7 I(1) Cointegration Rank Test for the VECM of (2.16), 1962q4 to 2006q2. 69 4.8 Long-run β∗ estimates for the reduced form VECM of (2.16) with rank(Π∗) = 6 and p = 2, 1962q4 to 2006q2. . . . . . . . . . . . . . . . 73 4.9 α adjustment coefficient estimates for the reduced form VECM of (2.16) with rank(Π∗) = 6 and p = 2, 1962q4 to 2006q2. . . . . . . . . . . . . 74 4.10 Long-run β∗ estimates for the just-identified VECM of (2.16) with rank(Π∗) = 6 and p = 2, 1962q4 to 2006q2. . . . . . . . . . . . . . . . 78 4.11 α adjustment coefficient estimates for the just-identified VECM of (2.16) with rank(Π∗) = 6 and p = 2, 1962q4 to 2006q2. . . . . . . . . . . . . 79 4.12 Long-run β∗ estimates for the over-identified VECM of (2.16) with rank(Π∗) = 6 and p = 2, 1962q4 to 2006q2. . . . . . . . . . . . . . . . 80 4.13 α adjustment coefficient estimates for the over-identified VECM of (2.16) with rank(Π∗) = 6 and p = 2, 1962q4 to 2006q2. . . . . . . . . . . . . 81 iv
  • 6. 4.14 Long-run β∗ estimates for the just-identified VECM of (2.16) with rank(Π∗) = 5 and p = 2, 1962q4 to 2006q2. . . . . . . . . . . . . . . . 85 4.15 α adjustment coefficient estimates for the just-identified VECM of (2.16) with rank(Π∗) = 5 and p = 2, 1962q4 to 2006q2. . . . . . . . . . . . . 86 4.16 Long-run β∗ estimates for the over-identified VECM of (2.16) with rank(Π∗) = 5 and p = 2, 1962q4 to 2006q2. . . . . . . . . . . . . . . . 87 4.17 α adjustment coefficient estimates for the over-identified VECM of (2.16) with rank(Π∗) = 5 and p = 2, 1962q4 to 2006q2. . . . . . . . . . . . . 88 4.18 Long-run β∗ estimates for the second over-identified VECM of (2.16) with rank(Π∗) = 5 and p = 2, 1962q4 to 2006q2. . . . . . . . . . . . . 95 4.19 α adjustment coefficient estimates for the second over-identified VECM of (2.16) with rank(Π∗) = 5 and p = 2, 1962q4 to 2006q2. . . . . . . . 96 4.20 I(1) Cointegration Rank Test for the VECM of (2.16) excluding nxt, 1962q4 to 2006q2. . . . . . . . . . . . . . . . . . . . . . . . . . . . . . 97 4.21 Long-run β∗ and α estimates for the over-identified VECM of (2.16) with rank(Π∗) = 4 and p = 2 and without nxt in yt, 1962q4 to 2006q2. 99 4.22 Long-run β∗ and α estimates for the over-identified VECM of (2.16) with rank(Π∗) = 4 and p = 2 and without nxt in yt, 1962q4 to 2006q2. 100 4.23 I(1) Cointegration Rank Test for VECM (2.16) for non high-tech in- vestment without nxt, 1962q4 to 2006q2. . . . . . . . . . . . . . . . . 101 4.24 Long-run β∗ and α estimates for the over-identified VECM of (2.16) with rank(Π∗) = 4 and p = 2 for non high-tech investment and without nxt in yt, 1962q4 to 2006q2. . . . . . . . . . . . . . . . . . . . . . . . 102 4.25 Long-run β∗ and α estimates for the over-identified VECM of (2.16) with rank(Π∗) = 4 and p = 2 for non high-tech investment and without nxt in yt, 1962q4 to 2006q2. . . . . . . . . . . . . . . . . . . . . . . . 103 v
  • 7. 4.26 I(1) Cointegration Rank Test for VECM (2.16) for non high-tech in- vestment with nxt included, 1962q4 to 2006q2. . . . . . . . . . . . . . 104 4.27 I(1) Cointegration Rank Test for Canadian data 1962q4 to 2006q2. . 106 4.28 Long-run β∗ estimates for the over-identified VECM of (2.16) with rank(Π∗) = 5 and p = 2, Canadian data 1962q4 to 2006q2. . . . . . . 107 4.29 α adjustment coefficient estimates for the over-identified VECM of (2.16) with rank(Π∗) = 5 and p = 2, Canadian data 1962q4 to 2006q2. . . . 108 5.1 I(1) Cointegration Rank Test for the VECM with weakly exogenous dt and gt, excluding nxt, 1962q4 to 2004q4. . . . . . . . . . . . . . . . 122 5.2 Long-run β∗ estimates for VECM with R&D capital stock, dt excluded from the investment relation, rank(Π∗) = 5 and p = 2, 1962q4 to 2004q4.123 5.3 α adjustment coefficient estimates for VECM with R&D capital stock, dt excluded from the investment relation, rank(Π∗) = 5 and p = 2, 1962q4 to 2004q4. . . . . . . . . . . . . . . . . . . . . . . . . . . . . . 124 5.4 Long-run β∗ estimates for VECM with R&D capital stock, dt included in the investment relation, rank(Π∗) = 5 and p = 2, 1962q4 to 2004q4. 126 5.5 α adjustment coefficient estimates for VECM with R&D capital stock, dt included in the investment relation, rank(Π∗) = 5 and p = 2, 1962q4 to 2004q4. . . . . . . . . . . . . . . . . . . . . . . . . . . . . . . . . . 127 5.6 Long-run β∗ estimates for VECM with capital-augmenting dt and weak exogeneity restrictions on wt, rank(Π∗) = 5 and p = 2, 1962q4 to 2004q4.130 5.7 α adjustment coefficient estimates for VECM capital-augmenting dt and weak exogeneity restrictions on wt, rank(Π∗) = 5 and p = 2, 1962q4 to 2004q4. . . . . . . . . . . . . . . . . . . . . . . . . . . . . . 131 6.1 DOLS estimates of the user cost elasticity of equipment capital, Cana- dian data 1969q4-1999q2. . . . . . . . . . . . . . . . . . . . . . . . . . 136 vi
  • 8. 6.2 Long-run β∗ and α estimates for the four-variable VECM with invest- ment, rank(Π∗) = 2 and p = 8, Canadian data 1963q1 to 2006q2. . . 137 6.3 Long-run β∗ and α estimates for the single-equation VECM, rank(Π∗) = 1 and p = 2, United States data 1962q4 to 2006q2. . . . . . . . . . 139 6.4 Summary of elasticity estimates. . . . . . . . . . . . . . . . . . . . . . 140 vii
  • 9. List of Figures 3.1 Log of GDP, yt and business value added, yb and their first differences. 36 3.2 Log of GDP, yt and GDP less (chain-subtracted) residential investment and investment in non-residential structure, yc and their first differences. 37 3.3 Log of equipment and software (kt), high-tech (kc t ) and non high-tech (ko t ) capital stocks and their first differences. . . . . . . . . . . . . . . 39 3.4 Relative prices of equipment and software (PI ), high-tech (PIc ) and non high-tech (PIo ) investment. . . . . . . . . . . . . . . . . . . . . . 41 3.5 Log of user cost of capital for equipment and software (Rt), high-tech (Rc t ) and non high-tech (Ro t ) investment and their first differences. . . 43 3.6 Log of short-term real returns for equipment and software (rrp t ), high- tech (rrpc t ) and non high-tech (rrpo t ) investment goods prices and their first differences. . . . . . . . . . . . . . . . . . . . . . . . . . . . . . . 44 3.7 Log of real wage, ωt and its first difference. . . . . . . . . . . . . . . . 45 3.8 Log of total hours, lt and its first difference. . . . . . . . . . . . . . . 46 3.9 United States data. All variables are in logs. . . . . . . . . . . . . . . 47 3.10 United States data in first differences. . . . . . . . . . . . . . . . . . . 48 3.11 Canadian data. All variables are in logs. . . . . . . . . . . . . . . . . 51 3.12 Canadian data in first differences. . . . . . . . . . . . . . . . . . . . . 52 4.1 Roots of the companion matrix in the VAR(2) model for variables in zt. United States data with endogenous gt, 1962q4 to 2006q2. . . . . 63 viii
  • 10. 4.2 Roots of the companion matrix in the VAR(2) model for variables in zt. United States data with weakly exogenous gt and time trend, 1962q4 to 2006q2. . . . . . . . . . . . . . . . . . . . . . . . . . . . . . . . . . 63 4.3 Reduced form errors for the long-run relations. Estimated −ˆξt for the VECM (2.16), 1962q4 to 2006q2. . . . . . . . . . . . . . . . . . . . . 75 4.4 Reduced form errors for the long-run relations. Estimated −ˆξt for the over-identified VECM of (2.16) with rank(Π∗) = 6 and p = 2, 1962q4 to 2006q2. . . . . . . . . . . . . . . . . . . . . . . . . . . . . . . . . . 83 4.5 Reduced form errors for the long-run relations. Estimated −ˆξt for the over-identified VECM of (2.16) with rank(Π∗) = 5 and p = 2, 1962q4 to 2006q2. . . . . . . . . . . . . . . . . . . . . . . . . . . . . . . . . . 89 5.1 Log of capital to GDP ratios for equipment and software capital stock, kt and non-high tech equipment capital stock, ko t . United States data. 110 5.2 BEA’s annual data for business R&D investment and net stock in bil- lions of chained (2000) dollars, 1959-2004. . . . . . . . . . . . . . . . 114 5.3 Annual growth rates of BEA’s business R&D investment and BLS’s information sector employment, 1959-2004. . . . . . . . . . . . . . . . 115 5.4 Interpolated quarterly business R&D investment in billions of chained (2000) dollars, 1960-2004. . . . . . . . . . . . . . . . . . . . . . . . . 116 5.5 Generated quarterly stocks of business R&D in billions of chained (2000) dollars, 1960-2004 compared with the BEA’s annual capital stock data. . . . . . . . . . . . . . . . . . . . . . . . . . . . . . . . . . 117 5.6 Calculated quarterly poisson weighted average R&D in billions of chained (2000) dollars, 1982-2004. . . . . . . . . . . . . . . . . . . . . . . . . 118 5.7 Calculated quarterly stock series for business R&D in billions of chained (2000) dollars, 1982-2004 from the poisson model with different λ val- ues compared with that from the depreciation smoothing procedure. . 119 ix
  • 11. 5.8 Calculated quarterly stock series for business R&D in billions of chained (2000) dollars from the poisson model with L = 88 and 35 quarters compared with that from the annual BEA’s data. . . . . . . . . . . . 120 5.9 Reduced form errors for the long-run relations. Estimated −ˆξt for VECM with R&D capital stock, dt included in the investment relation, rank(Π∗) = 5 and p = 2, 1962q4 to 2004q4. . . . . . . . . . . . . . . . 128 x
  • 12. Chapter 1 Introduction The cost of capital is considered an important factor affecting firms’ investment de- cisions and capital accumulation in finance and economics alike. Fundamentally it reflects individual firms’ costs of raising additional funds and the aggregate economy’s ability to replenish and increase its existing capital stock. Components of the cost of capital (the interest rate in particular) respond to monetary and fiscal policies in addition to the overall macroeconomic and asset market conditions. Investment in turn has an important influence on macroeconomic and asset market equilibria. This dissertation estimates the neoclassical long-run user cost elasticity of aggregate busi- ness investment using a vector error correction model (VECM) of the macroeconomy. The model corresponds to a long-run general equilibrium framework as described by theoretically consistent cointegrating relationships among macroeconomic variables. The estimated VECM also gives a representation of the short-run investment dy- namics from the data for which theoretical restrictions from potential endogenous adjustment models can be tested against.1 This dissertation complements two strands of macroeconomic research. It provides 1 And potentially (after appropriate extensions) for other models of investment with lumpy invest- ment, irreversibility under uncertainty, time-to-build, learning, liquidity and financial constraints as discussed in Demers et al. (2003). See section 1.2 below for a discussion for the case of convex adjustment costs. 1
  • 13. 2 an estimate of the long-run user cost elasticity commonly discussed in the investment literature. The dissertation also utilizes a feature of many recent monetary models by assuming that there is a tendency for output and real interest rates to move towards their long-run natural (flexible price equilibrium) values as represented by cointegrating relationships. There have been numerous attempts to estimate the investment equation (via in- vestment rate, I/K or from capital stock to output ratio K/Y ) with the user cost of capital as the main explanatory variable.2 Most major studies have been conducted using U.S. data at the aggregate, industry or firm levels. Gilchrist and Zakrajsek (2007) and Chirinko (2008) provide recent descriptions of various research using dif- ferent empirical techniques and data set. For aggregate time-series studies, Caballero (1994), Tevlin and Whelan (2003) (with U.S. data) and Schaller (2006) (with Cana- dian data), in particular, use a single-equation cointegrating relationship to estimate the long-run user cost elasticity. Gilchrist and Zakrajsek (2007), and also Caballero (1999), note however that there is too little variation in the measured aggregate long- term interest rate or the tax components so that most of the variation in the cost of capital (that will affect investment) comes from the trending relative price of capital goods. Gilchrist and Zakrajsek (2007) also address the above mentioned endogene- ity of components of the user cost of capital, that “ . . . long-term interest rates and the price of new investment goods typically fall during economic downturns when investment fundamentals are weak.” and that “ . . . [interest rates and corporate tax rates] are often lowered by monetary and fiscal policies when investment spending is weak.”, by using a measure of firm-specific user cost of capital derived from corporate bond market data and matching it with the corresponding income and balance sheet data for other variables associated with individual firms’ investment decision in the 2 Another common approach is to use various measures of Tobin’s average q or marginal q. The next section also discusses the neoclassical model with adjustment costs and relates it to the q- theoretic framework along the line of Hayashi (1982).
  • 14. 3 rest of the investment equation.3 Aggregate data are used in this study however and the user cost elasticity is identified through the VECM of the macroeconomy given short-term interest rates from monetary policy (and effective corporate tax rates from fiscal policy). Many studies using U.S., U.K. and Canadian data obtain the estimated value of the long-run user cost elasticity of around -0.4 to -0.7 for total private non-residential capital stock and a value close to one for equipment capital (-0.9 in Caballero (1994) with U.S. data and -1.6 in Schaller (2006) with small open-economy Canadian data).4 Ellis and Price (2004) obtain the user cost elasticity estimate of -0.44 using aggregate data for the U.K. in a two-vector VECM framework. A U.S. study that finds a value of the user cost elasticity towards the lower end of the range (approximately -0.4) is that of Chirinko et al. (2007) with firm-level panel data and stationary user cost of capital series in their Interval-Difference model. Caballero et al. (1995) use plant-level panel data in a cointegration framework to obtain an average long-run user cost elasticity estimate of around -1.0 for equipment capital which translates to total capital elasticity of around -0.7 at the upper end of the cited range. This dissertation utilizes aggregate U.S. and Canadian time-series data, in a multiple- equation general equilibrium VECM framework, in order to obtain a long-run user cost elasticity estimate that can be most closely compared with the single-equation cointegration results of Caballero (1994), Tevlin and Whelan (2003), Schaller (2006) and AbIorwerth and Danforth (2004). Demers et al. (2003) and Caballero (1999) 3 Gilchrist and Zakrajsek (2007) also address endogeneity at the firm level when firms’ investment and financial policies (due to improved fundamentals or via increasing leverage) affect the market rates of interest, by accounting for changes to the expected default risk. 4 Tevlin and Whelan (2003) obtain the estimate for the user cost elasticity of -1.59 for computers in the U.S. (for the period between 1980 and 1997), -0.13 for noncomputing equipments (over the 1950-1997 period) and -0.18 for equipment capital in total, in a regression where the coefficient for the long-run elasticity of output is not restricted to one. AbIorwerth and Danforth (2004), using Canadian investment data, also find a large output elasticity and relatively small user cost elasticity estimates. The user cost elasticities rise to around one, however, once the output coefficient is restricted to unity in accordance with the theory. Estimates from other studies are also summarized in Table 1 of Chirinko (2008).
  • 15. 4 also provide comprehensive reviews of the more recent models of investment aiming to account for substantial remaining variations in the investment process due to other features that are left unexplained by the traditional analysis of the user cost of capital or Tobin’s q.5 Another strand of research is the construction of relatively small-scale general equilibrium macroeconomic models for monetary policy evaluation. Gali and Gertler (2007) provide an outline of a more recent framework that incorporate private sector expectations of the future short-term interest rates as well as fluctuations in the natu- ral (flexible price equilibrium) values of output and real interest rates. The framework is summarized in a baseline three-equation macroeconometric model that describes how the gap between actual and natural levels of output is influenced by the corre- sponding long-term real interest rate gap and the gap in Tobin’s q (via an aggregate demand relation), how the output gap contributes to inflation (aggregate supply re- lation), and how the short-term nominal interest rate is determined from inflation, the output gap, and its corresponding natural value (monetary policy). The model follows the New Keynesian or New Neoclassical Synthesis tradition that combines elements of the long-run real business cycle theory with the New Keynesian theories of short-run price adjustments. The macroeconometric model discussed here utilizes the long-run dimension of this framework in order to theoretically specify restrictions on the cointegrating vectors for the VECM of relevant macroeconomic variables by assuming that there is a tendency for output and real interest rates to move towards their long-run natural (flexible price equilibrium) values as represented by cointegrat- ing relationships. The investment equation in particular is specified through the user cost of capital instead of Tobin’s q as used in Gali and Gertler’s paper. This study therefore complements the macromonetary framework by exploring the general equi- librium estimation of the investment equation using the long-run user cost of capital 5 See footnote 1 above. Chirinko (1993) provides a survey of the traditional models and the related investment equations.
  • 16. 5 given some evidence that measures of Tobin’s marginal or average q perform less well empirically.6 Investment Equation in the Long and Short Run The long-run neoclassical investment equation is derived in the following section as a cointegrating relationship between investment and the user cost of capital fol- lowing Ellis and Price (2004) or between capital-output ratio and the user cost as in Schaller (2006).7 Output (hence capital stock) is not separately identified in the neoclassical investment model alone8 but can be determined in a VECM given addi- tional cointegrating relationships between output, investment and capital stock. The corresponding short-run model from dynamic optimization, with the addition of adjustment costs as a function of the investment rate (investment to capital ratio, I/K) that also allows for the identification of capital stock, is then presented in the subsequent section. The presence of adjustment costs with capital stock as the state variable allows the investment rate to be determined from the optimal controls. As discussed in Hayashi (1982), the modified neoclassical model with adjustment cost is shown to be equivalent to the q-theory of investment. This equivalence thereby supports the use of the user cost framework instead of the q-theory commonly uti- lized in a typical macromonetary model with investment. The traditional models of investment dynamics presented here are described in Demers et al. (2003) who also provide a comprehensive discussion of other more recent theoretical developments.9 6 See Demers et al. (2003) and Caballero (1999). A recent study using firm-level panel data, Eberly et al. (2008), provides a favorable evidence for the q-theoretic framework along the line of Hayashi (1982) however. 7 The flexible neoclassical theory of investment with the cost of capital originates from Hall and Jorgenson (1967) seminal work on investment. It is an extension of Jorgenson (1963) with additional distributed lags of desired capital stock to account for serial correlation in investment in a similar manner to the flexible accelerator model. See Caballero (1999) for a discussion. 8 Under perfect competition and constant returns to scale production, profits are zero for all output levels. 9 See footnote 1 and footnote 5 above.
  • 17. 6 The empirical evidence on these models can also be compared with the adjustment dynamics from the error-correction coefficients of the estimated VECM in this study. 1.1 Long Run Model of Investment The neoclassical theory of investment of Jorgenson (1963) is based on the first-order condition from the representative firm’s optimization problem under perfect competi- tion. By maximizing the present discounted value of its net cash flows subject to the capital accumulation process for a given level of output (or equivalently maximizing profits or minimizing costs given output), the firm’s desired amount of capital stock, K∗ t is obtained from the first-order conditions with respect to capital input, Kt−1 and investment It.10 The resulting optimality condition equates the marginal revenue product of capital, PY t · MPKt [= PY t · FK(K∗ t−1, L∗ t )] to the user cost of capital of investment, Ct 11 PY t · MPKt = Ct (1.1) where the cost of capital is the shadow price (or implicit rental) of a marginal unit of capital service, Kt per period given the capital accumulation identity ∆Kt = 10 For example, a discrete time version the neoclassical optimal capital accumulation prob- lem presented in Jorgenson (1967) is max{Kt−1,Lt,It} V = ∞ t=0 (1 + r)−t PtQt − wtLt − PI t It s.t. Ft(Kt−1, Lt) = Qt and ∆Kt = It − δKt−1. See Appendix A.1 for details. 11 Kt−1 is used here in the production function as the capital service input for the period that corresponds to the capital accumulating identity Kt − Kt−1 = It − δKt−1 as in Jorgenson and Yun (1991). The user cost of capital derived here as in Jorgenson (1963) is defined as the real rental price of capital services. See Jorgenson and Yun (1991), Biørn (1989) and references therein for discussions on the relevant concepts including the price-quantity duality. Capital stock is a weighted sum of past investments according to the replacement requirements and hence corresponds to the purchase price of investment goods, PI t . Capital input, on the other hand, is the service flow for each period from the capital stock given at the beginning of the period. Investment flow, It therefore corresponds to the rental price of capital services with the purchase price of investment being a weighted sum of the future rental prices subject to depreciation. The cost of capital is defined in Jorgenson and Yun as the user cost, i.e. the rental price discussed here, divided by the purchase price of investment, Ct/PI t−1 and therefore depends on the interest rate and depreciation given investment goods price inflation (see the derived expression for Ct in the text). The cost of capital thus represents an annualization factor that transforms the purchase price of investment goods, PI t−1 into the price of capital, Ct.
  • 18. 7 It − δKt−1 , Ct ≡ (1 + r)PI t−1 − (1 − δ)PI t (1.2) Ct ≡ PI t−1 r + δ − (1 − δ) PI t − PI t−1 PI t−1 . Jorgenson and Yun (1991) as in Hall and Jorgenson (1967) also derive the same expres- sion for the rental price of capital services from a durable good model of production by differencing the purchase price of investment goods, PI t written as a weighted sum of the future rental prices subject to depreciation. Jorgenson and Yun then include this rental price of capital input in a firm’s optimization problem with equity and debt finance, and capital income taxation. The representative firm maximizes the value of outstanding equity shares subject to the cash flow constraint that the value of distributed dividends less new share issues is equal to the cash flow from production and new debt issues, less investment expenditures, PI t It and the interest payments on outstanding debts. This problem reduces to profit maximization given the value of the firm’s outstanding capital stock. The expression for the user cost of capital is similar to (1.2) with the rate of return rt now being a weighted average of rates of return on debt and equity, rt = λit + (1 − λ)ρt and includes additional terms for the corporate tax rate, investment tax credit, depreciation allowances and property tax rate, Ct ≡ PI t−1 r + δ − (1 − δ) PI t − PI t−1 PI t−1 1 − ITCt − τtzt 1 − τt + τP t where PI t − PI t−1 PI t−1 is the rate of inflation in the price of investment goods; ITCt is the investment tax credit rate on investment expenditures; τt is the corporate income tax rate; zt is the present value of the depreciation allowances; and τP t is the property tax rate. This expression is similar to the standard Hall-Jorgenson user cost of capital commonly used in investment studies. Normalizing investment goods price by the
  • 19. 8 price of output, PY t , allowing the long-term interest rate and depreciation rate to vary, and assuming beginning-of-period gross investment, It = ∆Kt+1 + δtKt (so that Kt now appears in the production function, Ft(Kt, Lt) and the investment goods price inflation term becomes expected price inflation) the user cost of capital excluding the additive property tax term is, CK t ≡ PI t PY t rl t + δt − Et PI t+1 − PI t PI t 1 − ITCt − τtzt 1 − τt . (1.3) The first-order condition (1.1) can be interpreted as a long-run condition on the optimal capital stock given output (MPKt = FK(K∗ t , L∗ t )) and the long-run user cost of capital, CK t . Assuming a constant elasticity of substitution (CES) production function, Yt = (aKσ t + bLσ t )1/σ , (1.4) and normalizing the price of investment goods in the cost of capital by the price of output as above, the first-order condition becomes a Yt Kt 1−σ = CK t (1.5) or Kt = a CK t 1/1 − σ Yt in logs, kt = 1 1 − σ ln a + yt − 1 1 − σ ck t (1.6) or kt = α0 + yt + αRRt, Rt ≡ ck t kt − yt = α0 + αRRt,
  • 20. 9 ˜kt = α0 + αRRt, ˜kt ≡ ln Kt Yt . Thus the user cost elasticity, αR as defined here is equivalent to the constant elasticity of substitution between labor and capital; αR ≡ −1/(1 − σ). This is equation (2) in Schaller (2006) that can be interpreted as a cointegrating relationship between capital-output ratio and the user cost of capital, ˜kt = α0 + αRRt + zt, zt stationary (1.7) ∆Rt = u2t, u2t stationary for cointegrating variables ˜kt, Rt . The optimal capital stock can not be identified separately from output based on the standard first-order condition alone.12 Therefore the first-order condition can also be viewed as a cointegrating relationship between capital, output and the user cost as in Ellis and Price (2004) with a unitary cointegrating coefficient between capital and output. The user cost elasticity then provides another restriction on the coefficient of the user cost of capital, Rt(≡ ck t ) in the cointegrating relationship kt = α0 + yt − αcRt (1.8) for cointegrating variables {kt, yt, Rt} where αc ≡ −αR and Rt ≡ ck t . Bean (1981) substitutes investment for the optimal capital stock through the capital accumulation identity (CAI), Kt = (1 − δt)Kt−1 + It (1.9) 12 See footnote 8 above.
  • 21. 10 or ∆Kt = It − δtKt−1 ∆Kt Kt−1 + δt = It Kt−1 which implies that in the long-run steady state with constant growth in capital stock, gk (≡ ∆Kss Kss ) gK + δ = I K K = I gK + δ so that the long-run steady state capital stock, kss = iss − ln(gK ss + δ), in logs (1.10) with cointegrating variables {k, i} . This equation provides another cointegrating relation between the variables for the two-equation VECM of Ellis and Price (2004). Combining equation (1.8) and (1.10) results in the long-run investment equation (4) in Ellis and Price (2004), α0 + y − αcR = i − ln(gK + δ) i = α0 + y − αcR + ln(gK + δ) (1.11) which can also be interpreted as a unique cointegrating relationship in a single error correction mechanism if k, y and R happen to be weakly exogenous to the cointe- grating relations (1.8) and (1.10) in the two-equation VECM.13 13 Otherwise the two-equation VECM is required for efficient estimation. These weak exogeneity restrictions can also be tested on the error-correction coefficients of the VECM. See the discussion in Ellis and Price (2004).
  • 22. 11 1.2 Short Run Investment Dynamics A common way to capture short-run adjustment towards the desired optimal capital stock in the traditional investment models is to assume a distributed lag structure due to various investment adjustment costs. Denote the log of the optimal capital stock in equation (1.6) as k∗ , a simple partial adjustment mechanism between actual and desired capital stock can be written as ∆kt = (1 − λ)(k∗ t − kt−1) (1.12) with the parameter 0 < λ < 1 representing the speed of adjustment towards the opti- mal capital stock. Substituting for k∗ from equation (1.6) gives the partial adjustment model, kt = (1 − λ) 1 1 − σ ln a + (1 − λ)yt − (1 − λ) 1 1 − σ ck t + λkt−1 kt = α0 + (1 − λ)yt − (1 − λ)αcck t + λkt−1 (1.13) which is linear in terms of the underlying parameters. With an inclusion of the disturbance term, εt the model can be estimated by ordinary least squares to find the (absolute value of) long-run user cost elasticity, αc. An alternative formulation based on the first-order condition equation (1.5) given in Gilchrist and Zakrajsek (2007) for example is ∆kt = η + λ ln Yt Kt − 1 1 − σ ln CK t ∆kt = η + λ ln Yt Kt − λαc ln CK t . where the Yt/Kt term measures firms’ future investment opportunities using oper- ating income to capital ratio or sales to capital ratio. To obtain the corresponding distributed lag structure for net investment in the flexible neoclassical model of Hall
  • 23. 12 and Jorgenson (1967) rewrite (1.12) as above, kt = (1 − λ)k∗ t + λkt−1 and by repeated substitution for the lag capital stock term and take a first difference, kt = ∞ s=0 (1 − λ)λs k∗ t−s = ∞ s=0 µsk∗ t−s ∆kt = ∞ s=0 µs∆k∗ t−s. (1.14) This distributed lag function can be estimated empirically by adding a disturbance term, limiting the number of lags and substitute for k∗ from equation (1.6) as before. The capital accumulation identity and growth approximation, ∆kt ∼= ∆Kt Kt−1 = It − δKt−1 Kt−1 = It Kt−1 − δ can also be used to write the equation in terms of gross investment as in Tevlin and Whelan (2003). The partial adjustment model is similar to a linear case of the geometric lag model as discussed in Koyck (1954) and Greene (2003), kt = α + ∞ i=0 (1 − λ)λi yt−i − αc ∞ i=0 (1 − λ)λi ck t−i + εt or kt = α + B(L)yt − αcB(L)ck t + εt where B(L) ≡ (1 − λ)(1 + λL + λ2 L2 + λ3 L3 + . . .) = 1 − λ 1 − λL and the lag weights wi = (1 − λ)λi , 0 ≤ wi < 1 decline geometrically. The short-run elasticity for the user cost term is αc(1 − λ) and the long-run elasticity
  • 24. 13 is αc ∞ i=1 (1 − λ)λi = αc as before. The model can also be interpreted in terms of expectations of the log of user cost based on information available at time t, ck∗ t+1|t and likewise for log output, y∗ t+1|t kt = α + y∗ t+1|t − αcck∗ t+1|t + εt, (1.15) with the expectation formation mechanism, ck∗ t+1|t = λck∗ t|t−1 + (1 − λ)ck∗ t = λLck∗ t+1|t + (1 − λ)ck∗ t y∗ t+1|t = λy∗ t|t−1 + (1 − λ)y∗ t = λLy∗ t+1|t + (1 − λ)y∗ t so that the expectations, ck∗ t+1|t and y∗ t+1|t can be written in terms of the current and past values in the information set as, ck∗ t+1|t = 1 − λ 1 − λL ck t = (1 − λ) ck t + λck t−1 + λ2 ck t−2 + . . . y∗ t+1|t = 1 − λ 1 − λL yt = (1 − λ) yt + λyt−1 + λ2 yt−2 + . . . . Substituting these expressions back into (1.15) results in the geometric distributed lag model given above, kt = α+(1−λ) yt + λyt−1 + λ2 yt−2 + . . . −(1−λ)αc ck t + λck t−1 + λ2 ck t−2 + . . . +εt which can be estimated by nonlinear least squares as discussed in Greene (2003). This geometric distributed lag model is almost a nonlinear version of the partial adjustment model given by (1.13) above except for the absence of the lag term, λkt−1. The autoregressive distributed lag (ARDL) model that encompasses the partial ad- justment model (a restricted version of the ARDL model without lagged explanatory
  • 25. 14 variables) allows a more general lagged response to yt and ck t by also including the lags of the dependent variable kt, kt = µ + p i=1 γikt−i + r j=0 µj yt−j − αcck t−j + εt (1.16) or equivalently, C(L)kt = µ + B(L) yt − αcck t + εt where C(L) = 1 − γ1L − γ2L2 − · · · − γpLp and B(L) = µ0 + µ1L + µ2L2 + · · · + µrLr with the associated distributed lag form, kt = µ C(L) + B(L) C(L) yt − αcck t + 1 C(L) εt kt = µ 1 − γ1 − · · · − γp + ∞ j=0 αjxt−j + ∞ l=0 θlεt−l where xt = yt−αcck t and α0, α1, α2, . . . are the coefficients on 1, L, L2 , . . . in B(L)/C(L) and θ0, θ1, θ2, . . . are the coefficients on 1, L, L2 , . . . in 1/C(L) respectively. The long- run elasticity is ∞ i=0 αi = B(1)/C(1) = 1 here as in the partial adjustment model above. The original partial adjustment model (1.13) can be obtained by setting the num- ber of lags of kt, p in (1.16) to 1 while having no lags for ck t and yt (i.e. r = 0). The lagged coefficient γ1 then corresponds to the speed of adjustment, λ in (1.13) whilst the µ0 coefficient corresponds to (1 − λ). Thus the distributed lag structure under partial adjustment as represented by (1.14) is equivalent to the ARDL model (1.16) with p = 1 and r = 0.
  • 26. 15 The distributed lag form of the ARDL model is called a rational lag model in Jor- genson (1966) and is used in Jorgenson (1963) to write the adjustment process in terms of gross investment, It = w(L) K∗ t − K∗ t−1 + δKt (or in logs via the growth approximation as in Tevlin and Whelan (2003) discussed above) where the adjustment coefficient, w(L) is a product of the power series that cumulatively represents the ad- justment coefficients of the assumed accumulation identities for gross investment at each intermediate stages, w(L) = . . . v2(L)v1(L)v0(L) = s(L)/t(L) with polynomials s(L) and t(L) in the resulting rational function for which the coefficients of the power series are generated. The user cost parameter is then identified from the coefficient estimates under the constraint, ∞ τ=0 wτ = 1. The ARDL model also has an error correction representation that describes how a deviation from the equilibrium relationship in (1.8) influences the dynamic of adjust- ments towards the optimal capital stock. For example, rearranging an ARDL(1,1) model kt = µ + γ1kt−1 + µ0 yt − αcck t + µ1 yt−1 − αcck t−1 + εt in terms of the differences, results in the error correction model ∆kt = µ + µ0∆ yt − αcck t + (γ1 − 1) kt−1 − θ yt−1 − αcck t−1 + εt where θ = − (µ0 + µ1)/(γ1 − 1) so that θ = −1/(γ1 − 1) in the long run. The third term on the right-hand side of the error correction model thus reduces to a deviation from the cointegrating relationship in (1.8). The flexible neoclassical model as discussed so far has a problem as mentioned in Caballero (1999), however, in that the same adjustment coefficient, λ in (1.12) or B(L) in (1.16), is shared by both ck and y and thus impose rather than allow for the effect of the cost of capital on investment in addition to that of output. This problem is remedied by explicitly incorporate adjustment dynamics via the inclusion
  • 27. 16 of adjustment costs of installing new investment goods in the firm’s optimization problem with capital stock as the state variable and thereby separately identifying output and capital stock in (1.5). The neoclassical investment model with adjustment costs can be viewed as a short run counterpart of the long run model discussed above.14 Due to the presence of adjustment costs of installing additional units of capital stock, the firm has to take capital stock for each period as given instead of choosing the capital stock to be installed at each point in time. The capital stock therefore becomes the state variable in the firm’s dynamic optimization problem and the control variable is the investment rate, It/Kt i.e. choosing investment, It hence next period Kt+1 for the given Kt subject to the capital accumulation identity, Kt+1 = (1 − δ)Kt + It. Given a possibly convex adjustment cost function, G(It, Kt) where GI > 0, GII > 0, GK < 0 and GKK > 0, and let the maximized value of the variable input, L∗ t ≡ L∗ (Kt, ht) where ht ≡ (PY t , wt), the firm’s net cash flows maximization problem becomes,15 max {It} V0 = ∞ t=0 E0(1 + rt)−t Π(Kt, ht) − PI t It = ∞ t=0 E0(1 + rt)−t PY t F(Kt, L∗ t ) − wtL∗ t − G(It, Kt) − PI t It s.t. Kt+1 = (1 − δ)Kt + It; K0 given for the short-run profit function, Π(Kt, ht). The first-order condition that corresponds 14 See Chirinko (2008), Chirinko (1993) and Caballero (1999) for discussions on different short-run investment models. 15 See Demers et al. (2003) for this formulation. Appendix A.2 provides the derivation of the results that follow.
  • 28. 17 to the long-run condition (1.1) is, Et PY t+1FK(Kt+1, L∗ t+1) − GK(It+1, Kt+1) = (1 + rt) PI t + GI (It, Kt) − (1 − δ)Et PI t+1 + GI (It+1, Kt+1) (1.17) where the left-hand side of the above expression is the discounted value of the expected future marginal short-run profits, βEtΠK(Kt+1, ht+1) which is the expected next- period marginal revenue product of capital less the marginal rate of decrease in the investment adjustment cost given the larger capital stock in next period. Since the investment adjustment cost falls when the capital stock is larger according to the convex cost assumption GK < 0 and GKK > 0 above, short-run marginal profits is larger than the marginal revenue product of capital alone. The right-hand side of the condition can be thought of as the ‘short-run’ user cost of capital inclusive of investment adjustment costs, CSR t ≡ (1 + rt) PI t + GI (It, Kt) − (1 − δ)Et PI t+1 + GI (It+1, Kt+1) . Comparing this expression with its long-run counterpart in (1.2) the effect of the adjustment costs on the firm’s cost of capital in the short run is therefore to increase the purchase price of investment goods, PI t by an additional amount, GI(It, Kt) given the existing capital stock, Kt. Similarly, the optimal investment decision for the current period also depends on the expected marginal adjustment cost next period EtGI (It+1, Kt+1) as a result of the next period optimal decision in addition to the expected next period purchase price, EtPI t+1. The expected future marginal short-run profits for which this short-run cost of capital is to be compared against in optimiza- tion is also larger than the marginal revenue product of capital by an additional amount, GK(It+1, Kt+1) due to the fall in the adjustment cost given larger capital
  • 29. 18 stock in the next period. As shown in Hayashi (1982), Tobin’s marginal q can be derived from the same optimization problem with adjustment costs. An equivalent expression for the user cost of capital with short run adjustment costs in terms of marginal q, is 16 CSR t ≡ (1 + rt) PI t qm t − (1 − δ) Et PI t+1qm t+1 where marginal q, qm t is the ratio of the marginal value of an additional unit of capital to the purchase price of investment goods, Etλt+1/PI t . This is the case since the first- order condition with respect to investment equates the marginal gain in future cash flow, Etλt+1(= PI t qm t ) to the marginal cost of investment which is the sum of the purchase price of investment goods PI t and the marginal adjustment cost GI(It, Kt). Similarly marginal q can be included in the expression for the Hall-Jorgenson cost of capital in (1.3) that takes into account taxes and depreciation allowances as CK,SR t ≡ PI t PY t rt + δt − Et PI t+1qm t+1 − PI t qm t PI t qm t 1 − ITCt − τtzt 1 − τt . An alternative parallel remedy to the identification problem is to utilize the long- run cointegrating relationships given in the previous section assuming that the gap between the actual capital stock and its optimal value, k − k∗ due to adjustment costs is transitory and can be included as a stationary residual in the cointegrating relationships. This is the approach used in Caballero (1994), Schaller (2006) and Ellis and Price (2004) for aggregate time-series data.17 Caballero (1994) points out that the ordinary least-square estimate of the long run first-order condition (1.6), called ‘static OLS’, is biased downwards in small sample due to its failure to capture the correlation between k − k∗ in the error term and the optimal long-run value as represented by 16 See Appendix A.2 for the derivation and the expression for marginal q in terms of the variables in the optimization problem. 17 Other studies that use panel data are also given in Table 1 of Chirinko (2008).
  • 30. 19 the right hand side of (1.6). The suggested solution is to follow Stock and Watson (1993) procedure of including leads and lags of the first difference of the regressor in order to account for the correlation such that the new error term becomes orthogonal to the regressor. A ‘dynamic OLS’ specification for (1.8) given in Schaller (2006) is ˜kt = α0 + αRRt + p s=−p βs∆Rt−s + εt. (1.18) for different number of lags and leads, p which is chosen according to the Bayesian Information Criterion (BIC) due to degrees of freedom consideration given the limited number of time-series observations available. Tevlin and Whelan (2003) derive an ARDL(1,N) model from a short run quadratic cost minimization problem based on k − k∗ , using k∗ from the long run first-order condition (1.6). The cost minimization solution provides short run dynamics in the form of a partial adjustment model where, in each period, kt adjusts towards a weighted average of expected future k∗ t as a moving target. By specifying output and the cost of capital for k∗ t in (1.6) to follow separate autoregressive processes, the resulting ARDL model, kt = α + λkt−1 + N i=0 βiyt−i + N i=0 γick t−i + ut (1.19) contains separate distributed lag polynomial coefficients, β(L) and γ(L) for yt and ck t that can be written in terms of the common adjustment coefficient, λ of the short run partial adjustment model. Since the variables involved are nonstationary, the estimating equation has an error correction form obtained by rearranging the short run model (1.19) above so that the variables appear in their first differences. Although k∗ t is specified according to (1.6), the implied long-run elasticity for output remains unrestricted in the estimating equilibrium error correction equation however.18 18 See footnote 4 above for the long-run user cost elasticity estimates. Nickell (1985) also describes how this type of adjustment cost model can often be summarized in a simple VECM.
  • 31. 20 In addition, Ellis and Price (2004) construct a vector error correction model (VECM) that can be viewed as generalizing the error correction form of the ARDL framework by allowing endogenous determination of short run adjustment dynamics among capital stock, output and the user cost towards their long run equilibrium cointegrating relationships. The cointegration vectors are based on the long-run re- lations (1.8) and (1.10) derived in section 1.1 above. The cointegration vectors imply testable restrictions on the βij of the reduced rank matrix, Π = αβ in the VECM, ∆Xt = Γ(L)∆Xt−1 + ΠXt−1 + ΦD where ΠXt−1 =          α11 α12 α21 α22 α31 α32 α41 α42             β11 β12 β13 β14 β21 β22 β23 β24             i k y R          t−1 and D may contain deterministic terms and other stationary exogenous variables. The macroeconometric model presented in the next chapter incorporates similar dynamics in a larger VECM representation of a structural cointegrated VAR model that is consistent with the short-run investment models described here in addition to the macromonetary framework as mentioned at the beginning of this chapter.
  • 32. Chapter 2 A Macroeconometric Model of Investment The macroeconometric model presented in this chapter follows the structural coin- tegrated VAR methodology as described in Garratt, Lee, Pesaran and Shin (2006) and Juselius (2006).1 The model is based on theoretically consistent long-run struc- tural relations represented by approximate log-linear equations with the error terms summarizing deviations (or ‘long-run structural shocks’) from those of correspond- ing short-run models. The main long-run relation of interest is the cointegrating relationship (1.8) derived in the previous chapter, k∗ t = α0 + yt − αcRt + ut where k∗ t denotes the optimal long-run capital stock and ut represents the long-run structural shock arising in part because of the cumulative effects of adjustment costs, irreversibility, financial constraints, etc. associated with the investment process. Un- 1 Garratt et al. (2006) also compare alternative approaches to macroeconometric modeling and their corresponding dynamic structures, including those for the type of adjustment cost model used in Tevlin and Whelan (2003) as mentioned at the end of the previous chapter. Nickell (1985) describes how short-run adjustment cost models with explicit optimization can often be summarized by a simple vector error correction model (VECM). 21
  • 33. 22 observable components of the structural relations (e.g. the adjustment gap, kt − k∗ ) are treated as additional error terms in the reduced form relationships that contain ‘long-run reduced form shocks’ as functions of the long-run structural shocks and the unobserved errors. In the case of the cointegrating relationship (1.8), the associated reduced form is the relation (2.6) given in the next section, kt = α0 + yt − αcRt + ξt+1 where ξt+1 = ut+(kt−k∗ t )+. . . is the long-run reduced form shock.2 Given the nonsta- tionarity of the variables involved, the long-run reduced from shocks are then treated as deviations from the long-run cointegrating relations that provide error correcting restrictions in a VECM (vector error correction) representation of a cointegrated VAR model. For the individual investment relation, ξt becomes an error correction term that provides error correction feedback towards the cointegration relations whenever its coefficient in the error correction model is negative. In terms of a single-equation error correction model, ∆kt = a0 + αξt + p−1 i=1 ∆kt−i + vt ∆kt = a0 + α(kt−1 − α0 − yt−1 + αcRt−1) + p−1 i=1 ∆kt−i + vt. The model is therefore subject to testing for nonstationarity and the cointegration property among the observed variables. The rank of cointegration from the test as suggested by the data will also dictate the appropriate number of long-run reduced form relations to be obtained from the structural model and hence the number of re- 2 The long-run reduced form shock, ξt+1 is assigned a (t+1) subscript, as in Garratt et al. (2006), since it may include structural shocks associated with the expectation errors for certain future variables if they are included in the structural relation. See (2.9) and (2.10) in the next section for example.
  • 34. 23 strictions necessary for exact identification as described in section 2.2 below. Further tests of the overidentifying restrictions from these theoretical relations can also be done to ascertain the validity of the long-run theory. 2.1 Long Run Structural Relations for the VECM The aggregate supply side for the long-run general equilibrium model consists of a log- linearized version of the CES production function (1.4) in section 1.1 of the previous chapter with labor augmenting technological progress that pins down the natural (flexible price equilibrium) level of output in a similar fashion to the production function in a real business cycle (RBC) model.3 With labor augmented technology, At = A0egt ut growing at rate g and subject to a stochastic mean-zero shock, ut the production function becomes Yt = {aKσ t + b (AtLt)σ } 1/σ or after log-linear approximation,4 yt ∼= c0 + c1kt + c3 (a0 + gt + uat) + c3lt 3 A general form of the CES production function due to Arrow et al. (1961) is Yt = At φ BK t Kt σ + (1 − φ) BL t Lt σ 1/σ where 1 1−σ is the elasticity of substitution between capi- tal and labor, φ is the capital share parameter, At is the neutral technical progress, and Bi t are factor-biased technical progress. Chirinko (2008) points out that neutral and factor-biased technical progress cannot be separately identified based on the first-order conditions similar to (1.6) or (2.2). Another specification of the CES production function is Yt = Ut {φKσ t + (1 − φ) Lσ t } η/σ where η is the parameter characterizing returns to scale. Constant returns to scale is assumed in this study since the time-series nature of the data does not allow a clear distinction between the effects of economies of scale and technological change. See a comment in chapter 13.2 of Greene (Greene, 2003, p. 284) which discusses the use of firm-level panel data to obtain separate estimates for both effects. 4 See the derivation in Appendix B.
  • 35. 24 and in terms of reduced form shock and parameters, yt = b30 + b31t + β31lt + β34kt + ξ3,t+1 (2.1) The error term representing the reduced form shock, ξ3,t+1, in particular, is pro- portional to the structural technology shock, uat = ln (ut). Thus the log-linearized production function (2.1) provides a cointegrating relationship for long-run aggregate supply to be incorporated into the third row of the VECM as described below. Labor supply is assumed to be completely elastic and equals to the long-run labor demand obtained from the first order condition of the same optimization problem for the representative firm as in section 1.1 of the previous chapter, PY t · MPLt = wt with CES production function, bAσ t Yt Lt 1−σ = wt PY t ≡ Wt or Lt = bAσ t Wt 1/1 − σ Yt (2.2) in logs, lt = 1 1 − σ ln b − 1 − 1 1 − σ ln At + yt − 1 1 − σ ωt as a cointegrating relationship lt = b0 − b1t + yt + αRωt (2.3) for cointegrating variables {lt, yt, ωt} where ωt is the log of real wage rate and b1 =
  • 36. 25 (1 − 1/1 − σ) g = (1 − αc) g = (1 + αR) g since ln At = a0 + gt + uat. The coefficient for log real wage, αR is the same as that for the log of user cost of capital in the first order condition for capital in section 1.1 of the previous chapter. The long-run real wage elasticity of labor demand is therefore the same as the user cost elasticity of cap- ital according to the theory. This equivalence provides an additional cross-equation overidentifying restriction that can be tested as discussed in Barrell et al. (2007). The labor demand first order condition provides another cointegrating relationship for the first row of the VECM below, lt = b10 − b11t + β12yt − β13ωt + ξ1,t+1 (2.4) where ξ1,t+1 is the structural shock representing short-run deviations from the optimal labor demand. In a similar manner to the discussion surrounding the cointegrating re- lationship (1.8) for capital in the previous chapter, output, yt in (2.3) is not separately identified from labor based on the long-run first order condition alone and therefore has a unitary cointegrating coefficient. The long run aggregate supply relation (2.1) above provides another cointegrating vector that, together with the two cointegrating vectors for capital (1.8) and (1.10) in section 1.1 of the previous chapter, help to identify the long-run equilibrium output level given the sufficient number of restric- tions for exact identification as described in section 2.2 below. Thus the cointegrating relationship (2.3) also imposes a restriction on the the output coefficient relative to labor demand. With both restrictions, the cointegrating vector (1, −β12, β13) in (2.4) is restricted to (1, −1, β25) according to the theory where β25 is the reduced form coefficient for the user cost of capital in (1.8) that represents the main structural parameter of interest αR, the user cost elasticity. The remaining element required to complete the long run general equilibrium model is the standard equilibrium relationship for aggregate demand relating invest-
  • 37. 26 ment to savings given output, that together with the standard Fisher condition and a yield curve relationship, will identify the long-run equilibrium real interest rates given the sufficient number of restrictions for exact identification. A log-linear ap- proximation for the investment-saving (IS) relation, Yt = Ct + It + Gt + NXt is5 yt = d0 + d1ct + d2it + d3gt + d4nxt (2.5) where the government expenditure, gt is considered exogenous, and consumption, ct and investment, it depend on the short-term and long-term interest rates respectively.6 Investment is given by the long-run investment relations (1.8) and (1.10) in section 1.1 of the previous chapter. The reduced form long-run relationship for the investment equation, discussed at the beginning of this chapter, is kt = b20 + yt − β25Rt + ξ2,t+1 (2.6) where the reduced form error, ξ2,t+1 represents deviations from the investment first- order condition (1.6). In addition, the capital accumulation identity (CAI) from (1.10) that relates capital stock to investment can be incorporated into the IS relation as yt = d0 + d1ct + d2 kt + ln gK + δ + d3gt + d4nxt with the corresponding reduced form equation, yt = b40 + β44kt + β46ct + β49gt + β47nxt + ξ4,t+1 (2.7) where the reduced form error, ξ4,t+1 represents variations from the assumed pattern of depreciation rate in (1.10). In order to incorporate consumption into the aggregate 5 See Appendix B for the derivation. 6 nxt is defined here as the natural logarithm of the ratio of real exports to imports, nxt ≡ ln(Xt/IMt) in order to avoid taking log of negative numbers.
  • 38. 27 demand, consider the consumption-saving problem for a representative household, max {Ct} E0 ∞ t=0 βt u (Ct) s.t. Kt+1 = Rc t+1 (Kt + WtL∗ t − Ct); K0 given where β is the rate of time preference, Rc t+1 ≡ (1 + rrt+1) is the rate of return on the after-tax short term real interest rate, rrt+1 and Wt is the real wage rate. Labor supply, L∗ is assumed to be completely elastic and equal to labor demand (2.2) in the long run. The term (Kt + WtL∗ t − Ct) represents gross savings assuming that the representative household’s total asset holding is a claim on the aggregate capital stock, Kt (or the present value of capital services in current and future production). The resulting first-order condition is the usual Euler equation, u (Ct) = βEtRc t+1u (Ct+1) . With constant relative risk aversion (CRRA) utility, u (C) = C1−θ (1 − θ) for θ > 0 and given the transition equation for the aggregate asset holding, Kt+1 above, the optimal level of consumption in terms of the state variable, Kt can be written as7 Ct = Kt + WtL∗ t − βEtRc1−θ t+1 1/θ Kt (2.8) which is the total wealth for the period, Kt + WtL∗ t less the optimal savings. By log-linear approximation, ct ∼= b0 + b1kt + b2ωt + b2lt − b3 ln Et (1 + rrt+1) (2.9) where ωt is the log of real wage rate and Rc t+1 ≡ (1 + rrt+1) as defined above. The 7 See the derivation in Appendix A.3 along the line of Dixit (1990).
  • 39. 28 coefficients are as derived in the appendix B.3 with the constant term, b0 being a function of the rate of time preference, β and the relative risk aversion coefficient, θ. In order to distinguish the short-term nominal interest rate, rs t from inflation, πt+1, the real rate of return in this expression can be substituted for via a Fisher equation similar to the Fisher Inflation Parity (FIP) in Garratt et al. (2006), (1 + rs t ) = Et (1 + rrt+1) Et (1 + πt+1) exp (ηfip,t+1) where rs t is the tax-adjusted nominal interest rate on capital asset held over the period t and ηfip,t+1 is the associated risk premium that is assumed to follow a stationary process with a finite mean and variance. Define the log of short-term nominal return as rt ≡ ln (1 + rs t ) and using the Fisher relation above, the log of expected real return becomes ln Et (1 + rrt+1) = rt − ln (1 + Etπt+1) − ηfip,t+1. Using log-approximation, ln (1 + πt+1) ≈ πt+1 and assume stationary expectations error, ηe π,t+1 in the long run for Etπt+1 = πt+1 exp ηe π,t+1 as discussed in Garratt et al. (2006), thus ln Et (1 + rrt+1) = rt − πt+1 − ηe π,t+1 − ηfip,t+1. (2.10) Substituting this expression into the log-linear consumption function (2.9) above yields ct = b0 + b1kt + b2ωt + b2lt − b3 rt − πt+1 − ηe π,t+1 − ηfip,t+1 (2.11) with the corresponding reduced form cointegrating relationship, ct = b50 + β51lt + β51ωt + β54kt − β58rrt + ξ5,t+1 (2.12)
  • 40. 29 where rrt = rt − πt+1 and the reduced form shock, ξ5,t+1 is a linear combination of the long-run structural shocks, ηe π,t+1 and ηfip,t+1 in addition to other disturbances that result in short-run deviations from the cointegrating relationship. The last relation for the model is a reduced form yield curve relationship (Y C) relating the log short-term real return, rrt to the log of user cost of capital, Rt in (1.8) of the previous chapter that contains a long-term interest rate component, rl t − Et(PI t+1 − PI t )/PI t as in (1.3). With the Y C relation, Rt = b60 + b68rrt + ξ6,t+1 (2.13) where the reduced form error, ξ6,t+1 also reflects the stationary expectations error on the difference between the overall inflation, πt+1 and the investment goods price inflation, πI t+1 = PI t+1 − PI t PI t in (1.3), the aggregate demand side for the long- run general equilibrium model is then given by the IS relation (2.7), the long-run investment relation (2.6) and the reduced form consumption function (2.12). The ag- gregate supply and aggregate demand sides are thus linked by the above investment relations that together provide a complete description of the long-run macroeconomet- ric model. There is no long-run restriction on inflation except for that its expectations error, ηe π,t+1 is stationary and πt+1 moves together with the log nominal interest re- turn, rt in line with the stationary long-run equilibrium real interest rate according to the Fisher relation (2.10). Output price, PY t per se is not separately determined in the model but is part of the relative investment goods price PI t /PY t in the expression for the endogenous real user cost of capital, Rt in (1.8) that also contains other com- ponents such as the long-term nominal interest rate, rl t and investment goods price inflation, PI t+1 − PI t PI t .
  • 41. 30 2.2 A Vector Error Correction representation for the Macroeconometric Model The econometric formulation of the model follows the modeling structure of Gar- ratt, Lee, Pesaran and Shin (2006) and involves a vector of nine variables zt = (lt, yt, wt, kt, Rt, ct, nxt, rrt, gt) as defined in the previous section with the log of real government expenditure, gt being treated as a weakly exogenous or ‘long-run forc- ing’ (Granger and Lin, 1995) variable for zt = (yt, gt) . Government expenditure, being long-run forcing, can influence other variables in the cointegration set but is not affected by any of the reduced form shocks above that represent short-run devi- ations from the cointegrating relationships. The long-run reduced form errors from the six cointegrating relations (2.4), (2.6), (2.1), (2.7), (2.12) and (2.13) above can be written as a linear combination of the cointegrating variables and deterministic intercept and trends (to ensure that the errors have zero means) as ξt = β zt−1 − b0 − b1(t − 1) (2.14) where ξt = (ξ1,t+1, ξ2,t+1, ξ3,t+1, ξ4,t+1, ξ5,t+1, ξ6,t+1) , β =                 1 −1 β25 0 0 0 0 0 0 0 −1 0 1 β25 0 0 0 0 −β31 1 0 −β34 0 0 0 0 0 0 1 0 −β44 0 −β46 −β47 0 −β49 −β51 0 −β51 −β54 0 1 0 +β58 0 0 0 0 0 1 0 0 −β68 0                
  • 42. 31 b0 = (b10, b20, b30, b40, b50, b60) and b1 = (b11, 0, −b31, 0, 0, 0) . The six long-run cointegrating relations is reproduced again here for convenience: lt = b10 − b11t + yt − β25ωt + ξ1,t+1 (2.4) Ld kt = b20 + yt − β25Rt + ξ2,t+1 (2.6) Investment yt = b30 + b31t + β31lt + β34kt + ξ3,t+1 (2.1) LRAS yt = b40 + β44kt + β46ct + β47nxt + β49gt + ξ4,t+1 (2.7) IS ct = b50 + β51lt + β51ωt + β54kt − β58rrt + ξ5,t+1 (2.12) Consumption Rt = b60 + b68rrt + ξ6,t+1 (2.13) Y C . Given that the variables in zt = (yt, gt) are difference-stationary i.e. integrated of order one I(1), the long-run reduced from shocks in ξt which represent deviations from the long-run cointegrating relations, can be included as the error correction terms in a VEC(p−1) representation of an otherwise unrestricted pth order cointegrated VAR model as ∆zt = a0 + αξt + p−1 i=1 Γi∆zt−i + vt. or in terms of (2.14), ∆zt = a0 + α [β zt−1 − b0 − b1(t − 1)] + p−1 i=1 Γi∆zt−i + vt
  • 43. 32 which corresponds to the standard reduced form VECM,8 ∆zt = a + bt + Πzt−1 + p−1 i=1 Γi∆zt−i + vt = a + Π∗z∗ t−1 + p−1 i=1 Γi∆zt−i + vt (2.15) where a = a0 +α (b0 − b1), b = αb1 and Π = αβ , or alternatively, z∗ t−1 = zt−1, t and Π∗ = αβ∗ with the trend coefficient included in the cointegration vectors β∗ = (β , −b1). The matrix α is the matrix of adjustment coefficients that indicate the extent to which the reduced form errors in ξt, that represent deviations from the cointegrating relationships, provide correction feedbacks on ∆zt. Since the variable gt is taken to be weakly exogenous, the last row of the α matrix is zero. Thus the last row in the Π matrix is also zero and the system can be written as a conditional VEC(p − 1) model, ∆yt = ay + αyb0 + αy [β zt−1 − b1(t − 1)] + p−1 i=1 Γyi∆zt−i + ψy0∆gt + uyt. (2.16) where the αy matrix has eight rows corresponding to the eight endogenous variables in yt, ψy0 is an 8×1 vector coefficient on ∆gt and the 8×1 vector of disturbances, uyt are i.i.d. (0, Σy). The disturbances in uyt are uncorrelated with vgt in vt = vyt, vgt with the variance-covariance matrix, Σ =    Σyy Σyg Σgy σ2 g   . The endogenous dis- turbance vector vyt in vt, conditionally written as vyt = Σyg(σ2 g)−1 vgt + uyt, has the uyt component being uncorrelated with vgt under the variance-covariance matrix 8 There are also other error-correction representations of an unrestricted VAR(p) model with the same long-run level matrix Π = − (I − Π1 − . . . − Πp). If the level zt enters with lag t − p on the right-hand side as zt−p instead of as first lag zt−1, for example, then the matrix Γi will be different and become cumulative long-run effect, Γi = − (I − Π1 − . . . − Πi) instead of the transitory effects when Γi = − (Πi+1 + . . . + Πp) in the representation (2.15) above. The model’s explanatory power is the same but the coefficient estimates and p-values can be different. See a summary in Pfaff (2006) and also Juselius (2006) for a discussion on alternative ECM representations.
  • 44. 33 Σy ≡ Σyy − Σyg(σ2 g)−1 Σgy. In order to statistically separately identify the 9 × 6 cointegrating matrix, β in Π that contains six cointegrating vectors, 62 = 36 restrictions based on six restric- tions on each of the six cointegrating vectors are needed. Six restrictions come from normalizing the coefficients of the variables on the left-hand side of the long-run re- lationships above to one and therefore 62 − 6 = 30 more restrictions are needed in order to separately identify β and α in Π. These remaining restrictions for exact identification are more than provided for by the zero and equality coefficient restric- tions for the first three and the last two cointegrating relations in the β matrix and the trend coefficient vector, b1 above as suggested by the theory in the previous sub- section. The consumption relation on the fifth row of β , for example, contains six restrictions in β and another zero trend coefficient restriction for the fifth element of b1. The consumption relation is therefore overidentified by the theory. The remain- ing IS relation containing five restrictions on the fourth row of β is just identified with an additional zero restriction on the trend coefficient, b41. The excess restric- tions on other cointegrating relations can be taken as over-identifying restrictions that can be imposed and tested relative to the just-identified system. This is the iden- tification approach discussed in Pesaran and Shin (2002) and Pesaran et al. (2000). The VECM is estimated using the maximum likelihood (ML) procedure given the long-run restrictions on the matrix of cointegrating vectors, β . The selection of the just-identifying restrictions is in accordance with the theoretical relevance of the remaining over-identifying restrictions in the main investment equation of interest. Over-identifying restrictions are tested using log-likelihood ratio tests based on the restricted and unrestricted likelihood from the estimation. The outcomes from this procedure are discussed along with the subsequent results in chapter 4.
  • 45. Chapter 3 Data for the U.S. and Canadian Economies The data used in this dissertation are aggregate time-series data for the United States and Canada that represent a large and a small open-economy respectively. Several other studies that use the data from either of these countries are mentioned at the beginning of chapter 1. The data set consists of quarterly time series on the vari- ables zt = (lt, yt, wt, kt, Rt, ct, nxt, rrt, gt) in the VECM of the previous chapter for the period between the fourth quarter of 1962 and the second quarter of 2006. All national account variables are in real terms, seasonally adjusted and expressed in natural logarithms. Capital stock and user cost series, kt and Rt, are calculated from business machinery and equipment (and software) investment with the corresponding implicit aggregate price index. The calculation for kt and its depreciation rate follows the perpetual inventory method and smoothing procedure described in Appendix 2 of Diewert (2008). The log short-term real return measure is calculated based on the investment goods price inflation and multiplied by the relative investment goods price so that rrt = [ln(1+rt)−πI t+1]×PI t /PY t . The following sections provide more details on the data source and variable construction for each country. The constructed series 34
  • 46. 35 are given in the Appendix C. 3.1 U.S. Data 3.1.1 National Account Variables The national account data on output, expenditure and their implicit prices are ob- tained from the Bureau of Economic Analysis (BEA) at the U.S. Department of Commerce and consist of quarterly time series for seasonally adjusted real and nom- inal gross domestic product and its components for the July 31, 2008 revision of the National Income and Product Account (NIPA) Table 1.1.6 and Table 1.1.5 re- spectively. Quarterly real output series yt is calculated as the natural logarithm of the reported annualized real GDP (Line 1 of Table 1.1.6 in billions of chained 2000 dollars) divided by 400. The series for personal consumption expenditures (Line 2), ct and government consumption expenditures and gross investment (Line 20), gt are calculated in the same manner, yt = ln (‘Gross domestic product’ ÷ 400) ct = ln (‘Personal consumption expenditures’ ÷ 400) gt = ln (‘Government consumption expenditures and gross investment’ ÷ 400) . Net exports, nxt is calculated as the natural logarithm of the ratio of exports (Line 14) to imports (Line 17) of goods and services in order to avoid taking log of negative numbers, nxt = ln(Xt/IMt), Xt = ‘Exports of goods and services’ ÷ 400 IMt = ‘Imports of goods and services’ ÷ 400 . Additionally, a narrower measure for output as real gross value added of private business (from Line 2 of NIPA Table 1.3.6) is also used in order to correspond with
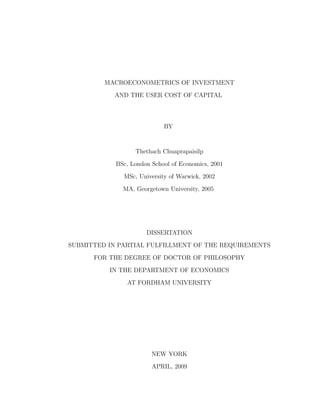
  • 47. 36 1960 1965 1970 1975 1980 1985 1990 1995 2000 2005 1.5 2.0 2.5 3.0 y_t y_b 1960 1965 1970 1975 1980 1985 1990 1995 2000 2005 −0.025 0.000 0.025 0.050 Dy_t Dy_b Figure 3.1: Log of GDP, yt and business value added, yb and their first differences. the business sector non-residential capital stock, kt in the investment equation and to allow comparison with some other studies,1 yb = ln (‘Business gross value added’ ÷ 400) . Another way to measure output when equipment and software capital is used in the investment equation is to subtract residential investment and investment in non-residential structure from GDP. This can be done using Whelan (2002) ‘chain- subtraction’ procedure since the available data for real variables are in chained dollar aggregates (NIPA Table 1.1.6). This output measure, yc is suitable for the model in this study because the long run investment-saving relation (2.7) remains balanced so 1 The nominal business sector gross value added is calculated as GDP minus gross value added of households and institutions (including services of owner-occupied housing) and gross value added of general government. See Table 2.1 in BEA (2008) for details. Some cointegration works such as Ellis and Price (2004) for the UK, AbIorwerth and Danforth (2004) for Canada and Caballero (1994) for the U.S. use aggregate real GDP or GNP in the investment equation. Shaller (2006) single-equation DOLS model and Tevlin and Whelan (2003) single-equation ARDL model use private business output for estimation.
  • 48. 37 1960 1965 1970 1975 1980 1985 1990 1995 2000 2005 2.0 2.5 3.0 y_t y_c 1960 1965 1970 1975 1980 1985 1990 1995 2000 2005 −0.02 0.00 0.02 0.04 Dy_t Dy_c Figure 3.2: Log of GDP, yt and GDP less (chain-subtracted) residential investment and investment in non-residential structure, yc and their first differences. that net export is national savings less investment, S − I = NX in the long run, given stationary change in private inventories. The data used in the calculation of the capital stock for equipment and software in- vestment and its user cost of capital come from the Federal Reserve Board’s FRB/US model and the corresponding NIPA Underlying Tables 5.5.5U (Private Fixed Invest- ment in Equipment and Software by Type) and 5.5.6U (Real Private Fixed Investment in Equipment and Software by Type, Chained Dollars). In the the FRB/US model as well as the in the NIPA tables, nominal fixed investment in nonresidential equip- ment and software, EPDN (Line 10 of NIPA Table 1.1.5 or Line 2 of Table 5.5.5U) can be further divided into high-tech equipment and software, EPDCN (computers, software, and telecommunication equipment on Line 4 of Table 5.5.5U) and the rest of the equipment and software investment, EPDON(= EPDN − EPDCN).
  • 49. 38 The capital stocks associated with these investment series can be constructed using the perpetual inventory method and depreciation rate smoothing procedure as described in Appendix 2 of Diewert (2008). For the equipment and software (E&S) capital stock Kt, the underlying nominal investment series, EPDN is divided by real series, EPD (Line 10 of NIPA Table 1.1.6 or Line 2 of Table 5.5.6U) in millions of chained (2000) dollars to obtained the implicit price index for equipment investment goods, PI . The values of the implicit price index for the fourth quarters are then used to deflate annual year-end current cost net stock of nonresidential equipment and software from Line 3 of the BEA’s Fixed Assets Accounts Table 2.1 (multiplied by 1000 to convert from billion to million dollars) in order to obtain a corresponding real net stock series. The quarterly real investment series, EPD in annual values is divided by 4 to obtain quarterly values to be used in conjunction with the annual real net stock series in order to back out annual ‘balancing depreciation rates’ according to the perpetual inventory formula i.e. δt = (Kt − Kt+1 + It) /Kt where It = Itq1 + Itq2 + Itq3 + Itq4. The annual balancing depreciation rates are then smoothed by running a linear regression with the corresponding quarterly rates calculated from the regression line, δt = 0.1178 + 0.0006647t, to reflect the rising trend in the depreciation rates. Quar- terly E&S capital stock series, Kt is then calculated from the initial year-end stock in 1959 cumulating forward based on the quarterly real investment series (EPD ÷ 4) and quarterly values, δt of the annual depreciation rates (divided by four) for each year by using the perpetual inventory formula, Kt+1 = (1 − δt+1) Kt + It+1. Simi- lar procedure is also used to calculate the high-tech and non high-tech capital stock series, Kc t and Ko t based on investment in computers, software, and communication equipment (real EPDC and nominal EPDCN) and E&S investment excluding com- puters, software, and communication equipment (EPDO and EPDON) and their corresponding implicit price indices together with the current cost net stocks derived
  • 50. 39 1960 1965 1970 1975 1980 1985 1990 1995 2000 2005 −2.5 0.0 2.5 kt c kt kt o 1960 1965 1970 1975 1980 1985 1990 1995 2000 2005 0.00 0.02 0.04 ∆kt o ∆kt ∆kt c Figure 3.3: Log of equipment and software (kt), high-tech (kc t ) and non high-tech (ko t ) capital stocks and their first differences.
  • 51. 40 from Line 3 (nonresidential equipment and software), Line 5 (computers and periph- eral equipment), Line 6 (software) and Line 7 (communication equipment) of the BEA’s Fixed Assets Accounts Table 2.1 (multiplied by 1000 to convert from billion to million dollars). The only difference is that the smoothed depreciation rates used for the non high-tech stock takes a constant value of 0.128408 which is an average of the original balancing depreciation rates that show no discernable trend over the entire sample. Smoothed depreciation rates used for the high-tech stock are obtained from the regression line, δt = 0.121 + 0.003833t of the original balancing depreciation rates. Dividing the capital stock series by 100,000 and taking log results in the kt, kc t and ko t series as shown in Figure 3.3 and also given in Appendix C. The steeper rise in the real high-tech capital stock series, kc t and the fall of the user cost variable Rc t , as calculated below, are largely due to the fall in the relative price of high-tech investment goods over the sample period as shown in Figure 3.4. 3.1.2 User Costs calculation The user cost of capital corresponding to different types of capital stock described above is calculated according to equation (1.3) in section 1.1 of chapter 1 using the corresponding smoothed depreciation rates δt, implicit prices for investment goods, PI t and GDP deflator, PY t . Other components of the user cost of capital, Rt in- cluding after-tax real financial cost of capital for producers’ durable equipment2 (RPD), marginal federal corporate income tax rates (TRFCIM), investment tax credit rates and present value of depreciation allowances are obtained from the Fed- 2 The cost of finance is a weighted average of the cost of debt and equity finance. The cost of debt is the yield on 5-year Treasury bonds plus a risk premium measured by the spread between the BAA bond rate and the yield on 10-year Treasury bonds, and allows for the tax deductibility of interest payments. The expected real return to equity as the equity cost of finance is measured using effective nominal Moody’s AAA corporate bond rate, minus the average rate of inflation expected to prevail over the coming 30 years, plus an equity premium obtained by inverting the Gordon growth formula (as a residual in the theoretical identity linking the dividend-price ratio, expected future growth rate of real dividends and the real interest rate).
  • 52. 41 1960 1965 1970 1975 1980 1985 1990 1995 2000 2005 2.5 5.0 7.5 10.0 12.5 15.0 17.5 20.0 22.5 25.0 PIc/PY PI/PY PIo/PY Figure 3.4: Relative prices of equipment and software (PI ), high-tech (PIc ) and non high-tech (PIo ) investment.
  • 53. 42 eral Reserve Board’s FRB/US model.3 The present values of depreciation allowance for E&S investment (TAPDD) are calculated following the description in Appendix A of Gilchrist and Zakrajsek (2007) as a weighted average of the original series for high-tech (TAPDDC) and non high-tech (TAPDDO) investment using nominal in- vestment series as the weights, zt = Ic t It × zc t + Io t It × zo t where zt is TAPDD, zc t is TAPDDC, zo t is TAPDDO and It, Ic t , Io t are nominal EPDN, EPDCN, EPDON for E&S, high-tech and non high-tech investment respec- tively. The investment tax credit rates for E&S investment (TAPDT) are calculated from the rates for high-tech (TAPDTC) and non high-tech (TAPDTO) investment in the same manner. The tax rates used also conform with the description given in Appendix A (page 267) and Appendix B.3 (page 297) of Gravelle (1994). The log of user cost of capital for E&S, high-tech and non high-tech investment, Rt, Rc t and Ro t are shown in Figure 3.5. In addition to the long-term user cost, the log short-term real return measures, rrp t , rrpc t and rrpo t are calculated based on the corresponding in- vestment goods price inflation and multiplied by the relative investment goods price so that rrp t = [ln(1 + rt) − πI t+1] × PI t /PY t where rt is the 3-month certificates of de- posit rate (from the International Monetary Fund’s International Financial Statistics database) net of federal average marginal income tax on interest received (from the National Bureau of Economic Research’s NBER TAXSIM database). The calculated log short-term real returns rrp t , rrpc t and rrpo t are shown in Figure 3.6. 3 Courtesy of the Macroeconomic and Quantitative Studies division for the tax variables in par- ticular.
  • 54. 43 1960 1965 1970 1975 1980 1985 1990 1995 2000 2005 −2 −1 0 1 Rt c Rt Rt o 1960 1965 1970 1975 1980 1985 1990 1995 2000 2005 −0.10 −0.05 0.00 0.05 0.10 0.15 DR_t DRc_t DRo_t Figure 3.5: Log of user cost of capital for equipment and software (Rt), high-tech (Rc t ) and non high-tech (Ro t ) investment and their first differences.
  • 55. 44 1960 1970 1980 1990 2000 2010 0.0 0.5 1.0 rrt p rrt pc rrt po 1960 1970 1980 1990 2000 2010 −0.5 0.0 0.5 ∆rrt pc 1960 1970 1980 1990 2000 2010 −0.025 0.000 0.025 0.050 rrt p rrt po 1960 1970 1980 1990 2000 2010 0.00 0.05 0.10 0.15 rrt p rrt po Figure 3.6: Log of short-term real returns for equipment and software (rrp t ), high-tech (rrpc t ) and non high-tech (rrpo t ) investment goods prices and their first differences.
  • 56. 45 1960 1965 1970 1975 1980 1985 1990 1995 2000 2005 2.4 2.5 2.6 2.7 ωt 1960 1965 1970 1975 1980 1985 1990 1995 2000 2005 −0.01 0.00 0.01 ∆ωt Figure 3.7: Log of real wage, ωt and its first difference. 3.1.3 Employment and Wages The data for employment and wages are obtained from the U.S. Bureau of Labor Statistics (BLS). Log of real wage, ωt is the log of seasonally adjusted average private hourly earnings from the BLS (extrapolated backward from 1964q1 using the variations in manufacturing hourly earnings for earlier values) divided by the GDP deflator. The labor variable, lt as total work hours is calculated based on the BLS’s seasonally adjusted total non-farm employment and average weekly hours: lt = Employment × Hours × 52 ÷ 100, 000, 000. Average weekly hours prior to 1964q1 are obtained by backward extrapolation based on variation in manufacturing hours. The plots of log of real wage, ωt and total hours, lt and their first differences are shown in Figures 3.7 and 3.8. Figures 3.9 and 3.10 give the plots of the constructed data series for the U.S. and their first differences.
  • 57. 46 1960 1965 1970 1975 1980 1985 1990 1995 2000 2005 0.25 0.50 0.75 lt 1960 1965 1970 1975 1980 1985 1990 1995 2000 2005 −0.02 −0.01 0.00 0.01 0.02 ∆lt Figure 3.8: Log of total hours, lt and its first difference.
  • 58. 47 1960 1980 2000 0.25 0.50 0.75 1.00 lt 1960 1980 2000 2.0 2.5 3.0 3.5 yt 1960 1980 2000 2.4 2.5 2.6 2.7 wt 1960 1980 2000 2 3 4 kt 1960 1980 2000 −2.0 −1.5 −1.0 Rt 1960 1980 2000 2 3 ct 1960 1980 2000 −0.25 0.00 nxt 1960 1980 2000 0.05 0.10 0.15 0.20 rrpt 1960 1980 2000 1.0 1.5 gt Figure 3.9: United States data. All variables are in logs.
  • 59. 48 1980 2000 −0.02 0.00 0.02 ∆lt 1980 2000 0.000 0.025 ∆yt ∆Rt 1980 2000 −0.01 0.00 0.01 0.02 ∆wt 1980 2000 0.01 0.02 ∆kt 1980 2000 −0.1 0.0 0.1 1980 2000 −0.02 0.00 0.02 ∆ct ∆gt 1980 2000 0.0 0.1 ∆nxt 1980 2000 0.00 0.05 ∆rrpt 1980 2000 0.000 0.025 Figure 3.10: United States data in first differences.
  • 60. 49 3.2 Canadian Data A similar data set is also constructed for the Canadian economy. National ac- count variables are obtained from the Organization of Economic Cooperation and Development (OECD) quarterly national account database. Seasonally adjusted real GDP, private final consumption expenditure, government final consumption expen- diture, gross fixed capital formation, exports of goods and services and imports of goods and services series are in millions of constant (2002) Canadian dollars (CAN.LNBARSA.2002.S1). GDP deflator comes from the corresponding implicit price index series (CAN.DNBSA.2002.S1). The log series are obtained by dividing the original quarterly series by 400 and take log as above. The capital stock series is calculated from machinery and equipment (M&E) in- vestment, which also contains a software component and is comparable with the U.S. E&S investment, by using perpetual inventory method and Diewert (2008) deprecia- tion smoothing procedure as described above. The quarterly M&E investment data and the corresponding implicit price index are obtained from Statistics Canada’s CANSIM II database Table 380-0002, expenditure-based Gross Domestic Product (Series v1992056: D100115) and Table Table 380-0002 (Series v1997749: D100458). The corresponding annual asset values for business sector M&E stock, for which annual balancing depreciation rates are backed out, are obtained from Table 8 in Ap- pendix 2 of Diewert (2008) and correspond to the national totals from CANSIM Table 378-0004 (National Balance Sheet Accounts, by Sectors) for machinery and equipment (Series v34677) less the government sector values from Table 378-0004 (Series v32577). Smoothed depreciation rates follow the regression line δt = 0.12 + 0.00137854t. The resulting quarterly capital stock series is divided by 10,000 prior to taking log. The user cost variable is similarly calculated and follows that in Schaller (2006) but with longer-term interest rates and variable smoothed depreciation rates. The long- term interest rates are calculated from the average yield on government bonds with
  • 61. 50 maturities greater than 10 years in the IMF’s IFS database plus the difference between the rates on 90-day prime corporate paper and treasury bill rates and add a constant fixed risk premium of eight percent so that the calculated user cost is nonnegative. Data for the tax variables are obtained from Schaller (2006), courtesy of Professor Schaller, and supplemented with those from other sources including Treff and Perry (2003), McKenzie and Thompson (1997) and Department of Finance Canada (2007) for the corporate income tax rates and investment tax credit rates. The present values of depreciation allowances are calculated from the formula and description in the data appendix of Schaller (2006) using the rates on 90-day prime corporate paper as the discount rate. Short-term real rates of return are calculated using the corresponding annualized investment goods price inflation and multiplied by the relative investment goods price as described in the previous section where rt is the 90-day prime corporate paper rates net of the top 5% marginal income tax rates obtained from Saez and Veall (2003) and OECD (2006). Seasonally adjusted civilian employment series from the OECD’s Quarterly Labour Force Statistics database is extrapolated backward from 1965q1 so that earlier val- ues have their annual averages equal to the annual average values obtained from Statistics Canada’s Historical Statistics of Canada (Catalogue no. 11-516-XIE Series D290-317). Total labor hours are then calculated based on the employment series and average annual hours actually worked per worker obtained from the OECD database4 : lt = Employment × Hours ÷ 4, 000, 000. The constructed data series for Canada in natural logarithms and their corresponding growth rates are shown in Figures 3.11 and 3.12. 4 Since no quarterly work hours data are available for the sample period, the annual average value is simply divided by four for each quarter and thus implying no quarterly variation within a given year as a result.
  • 62. 51 1960 1980 2000 1.25 1.50 1.75 2.00 lt 1960 1980 2000 2.0 2.5 3.0 3.5 yt 1960 1980 2000 0.4 0.6 0.8 wt 1960 1980 2000 2 3 4 kt 1960 1980 2000 −3 −2 −1 0 Rt 1960 1980 2000 1.5 2.0 2.5 3.0 ct 1960 1980 2000 −0.1 0.0 0.1 0.2 nxt 1960 1980 2000 −0.2 0.0 0.2 rrpt 1960 1980 2000 0.5 1.0 1.5 2.0 gt Figure 3.11: Canadian data. All variables are in logs.
  • 63. 52 1960 1980 2000 −0.02 0.00 0.02 ∆lt 1960 1980 2000 0.00 0.02 ∆yt 1960 1980 2000 0.00 0.02 ∆wt 1960 1980 2000 0.01 0.02 ∆kt 1960 1980 2000 −1 0 1 2 ∆Rt 1960 1980 2000 0.000 0.025 ∆ct 1960 1980 2000 −0.05 0.00 0.05 0.10 ∆nxt 1960 1980 2000 −0.2 0.0 0.2 0.4 ∆rrpt 1960 1980 2000 −0.025 0.000 0.025 0.050 ∆gt Figure 3.12: Canadian data in first differences.
  • 64. Chapter 4 VECM Estimation Procedure and Results This chapter describes the estimation and testing procedures for the Vector Error Correction Model of the macroeconomy from section 2.2 of chapter 2 that are applied to the U.S. and Canadian data. The description follows the structural cointegrated VAR methodology as laid out in Garratt, Lee, Pesaran and Shin (2006) and Juselius (2006). The results of alternative empirical specifications for estimating the user cost elasticity of investment are also discussed in section 4.3. 4.1 Univariate Unit-Root Tests Prior to estimating the VECM (2.15) or (2.16) in chapter 2, the first step in the anal- ysis is to ascertain whether the data suggest that the variables in zt are integrated of order one, I(1) and are cointegrated with similar cointegration ranks as the number of long-run reduced form theoretical relationships postulated in section 2.1 of chapter 2. In a univariate setting, several unit-root tests are available to decide whether an in- dividual variable time series, yt can be described by a non-stationary autoregressive process with one root for its lag polynomial lying on the unit circle and hence whether 53
  • 65. 54 the series is difference-stationary i.e. I(1) as opposed to being stationary i.e. I(0).1 A zero-mean detrended time series yt represented by an autoregressive process, a(L)yt = p i=0 aiyt−i = εt where a(L) = p i=0 aiLi is the lag polynomial of the lag operator Li yt = yt−i and εt is a serially uncorrelated white noise stationary process, has an autoregressive unit root if one of the roots, λj of the polynomial2 a(L) = p i=0 aiLi = p j=1 (1 − λjL) equals unity in absolute value i.e. one root (real or complex) lies on the unit circle. The yt series with a unit root is non-stationary I(1) and needs to be differenced once in order to remove the unit root and become weakly stationary. To test whether yt contains one unit root against the stationary alternative (all roots lie inside the unit circle, |λj| < 1) when the error process εt may also be serially correlated and yt may be trending, the augmented Dickey-Fuller (ADF) test due to Dickey and Fuller (1981) can be implemented by running the regression, ∆yt = α + µt + βyt−1 + k i=1 γi∆yt−i + ut where the augmented lag length, k can be chosen using a general-to-specific approach starting from a largest lag length and remove the last lagged difference if it is found to be insignificant, or chosen according to some information criteria such as the Akaike Information Criterion (AIC) and the Schwarz Criterion (SC), or by testing for the 1 For discussions on the unit root concepts given here see Doornik and Hendry (2007a), Pfaff (2006), Greene (2003) and Maddala and Kim (1998) where several other unit root tests are also provided. 2 λj are inverses of the roots of the characteristic equation, a(L) = 0.
  • 66. 55 absence of serial correlation in the residuals. The trend and drift terms can consecu- tively be removed if µ and α are not significant. The critical values for the t-statistics have been tabulated by Engle and Yoo (1987) and Phillips and Ouliaris (1990) for different cases. MacKinnon (1991) also provides estimates from response surface re- gressions that can be used to derive the critical values for small sample sizes. The ADF-test results below are based on these derived critical values of the t-statistics for the cases with a constant, α or constant and trend terms, α + µt included in the regression. The null hypothesis, H0 : β = 0 implies the presence of a unit root and the first difference series, ∆yt can be represented by a stationary AR(k) process so that yt is difference-stationary i.e. I(1). Trending behavior differs under the null and the stationary alternative. The process yt will have a zero mean under the stationary alternative if the α term is not included whereas the presence of α indicates a trend in yt under the unit root null when β = 0. ADF test may have low power against the stationary alternative for a near unit-root process in small sample and a large lag length, k however and several other alternative tests as discussed in Maddala and Kim (1998) and Pfaff (2006) can also be used. The ADF test results for individual time series of the variables in zt are given in Tables 4.1 and 4.2 for the U.S. and Canadian data respectively for the maximum augmented lag length of four and effective sample size of 172 from 1963q3 to 2006q2. The null hypothesis of a unit root cannot be rejected for most variables at the optimal lag length chosen according to the signif- icance of the longest lag difference coefficient and the Akaike Information Criterion (AIC). The unit root null is rejected for the log of output (yt, yb, yc), employment (lt), consumption (ct) and net export (nxt) series in the U.S. data, and capital stock (kt), user cost (Rt) and short-term real returns (rrp t ) in the Canadian data however. Even though the unit root hypothesis is rejected for these series, most of the estimated ˆβ coefficients are close to zero and the implied AR coefficients (= 1+ ˆβ) are close to one
  • 67. 56 Table 4.1: ADF unit root tests for the U.S. data. lt yt yb yc wt kt kc t ko t Test statistic -3.520* -4.363** -4.306** -4.176** -1.765 -2.559 -2.479 -2.940 1 + ˆβ 0.94900 0.89550 0.88637 0.89710 0.98818 0.99530 0.99360 0.99689 Lag length 1 2 2 2 3 3 3 3 Rt Rc t Ro t ct nxt rrp t gt Test statistic -1.867 -2.833 -2.583 -4.091** -3.134* -2.548 -2.921 1 + ˆβ 0.96364 0.93117 0.93218 0.92563 0.93793 0.92458 0.95373 Lag length 4 4 4 3 4 3 4 United States Data. ADF regressions: ∆yt = α + µt + βyt−1 + γ1∆yt−1 + . . . + γk∆yt−k + ut. Exclude time trend in the regressions of Ro t and nxt. Critical values derived from the response surfaces in MacKinnon (1991): 5% = −3.44, 1% = −4.01 with a constant and time trend; 5% = −2.88, 1% = −3.47 without time trend, for an effective sample size of 172, 1963q3- 2006q2. Optimal lag length, k chosen according to the AIC and significance of the last lagged difference with a maximum of 4 lags. Table 4.2: ADF unit root tests for Canadian data. lt yt wt kt Rt Test statistic -2.834 -2.903 -0.9327 -5.215** -4.074** 1 + ˆβ 0.95656 0.96552 0.98416 0.98281 0.63690 Lag length 1 1 4 1 2 ct nxt rrp t gt Test statistic -2.386 -2.287 -3.273* -3.034 1 + ˆβ 0.97280 0.93758 0.70794 0.97218 Lag length 3 0 3 4 Canadian Data. ADF regressions: ∆yt = α + µt + βyt−1 + γ1∆yt−1 + . . . + γk∆yt−k + ut. Exclude time trend in the regressions of nxt and rrp t . Critical values derived from the response surfaces in MacKinnon (1991): 5% = −3.44, 1% = −4.01 with a constant and time trend; 5% = −2.88, 1% = −3.47 without time trend, for an effective sample size of 172, 1963q3-2006q2. Optimal lag length, k chosen according to the AIC and significance of the last lagged difference with a maximum of 4 lags.