More Related Content
Similar to Elecciones 2011
Similar to Elecciones 2011 (20)
Elecciones 2011
- 1. SEVILLA
Censo 546,944
Participación 62.73% 343,098
Abstenciones 37.27% 203,846
Votos en blanco 2.78% 9,346
Votos nulos 1.86% 6,380
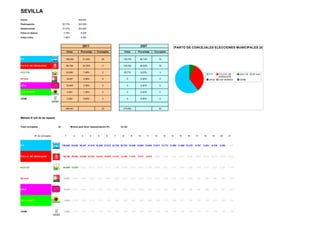
2011 2007 REPARTO DE CONCEJALES ELECCIONES MUNICIPALES 2011
Votos Porcentaje Concejales Votos Porcentaje Concejales
P.P. 166,040 51.49% 20 128,776 46.14% 15
P.S.O.E. DE ANDALUCÍA 99,168 30.76% 11 124,534 44.62% 15
IULV CA 24,066 7.46% 2 25,772 9.23% 3
P.P. P.S.O.E. DE IULV CA EP And
ANDALUCÍA
EP And 16,097 4.99% 0 0 0.00% 0 UPyD LOS VERDES CENB
UPyD 10,945 3.39% 0 0 0.00% 0
LOS VERDES 4,063 1.26% 0 0 0.00% 0
CENB 2,062 0.64% 0 0 0.00% 0
322,441 33 279,082 33
Metodo D´ont de de reparto
Total concejales 33 Mínimo para tener representación 5% 16,122
Nº de concejales 1 2 3 4 5 6 7 8 9 10 11 12 13 14 15 16 17 18 19 20 21
P.P. 166,040 83,020 55,347 41,510 33,208 27,673 23,720 20,755 18,449 16,604 15,095 13,837 12,772 11,860 11,069 10,378 9,767 9,224 8,739 8,302 7,907
P.S.O.E. DE ANDALUCÍA 99,168 49,584 33,056 24,792 19,834 16,528 14,167 12,396 11,019 9,917 9,015 8,264 7,628 7,083 6,611 6,198 5,833 5,509 5,219 4,958 4,722
IULV CA 24,066 12,033 8,022 6,017 4,813 4,011 3,438 3,008 2,674 2,407 2,188 2,006 1,851 1,719 1,604 1,504 1,416 1,337 1,267 1,203 1,146
EP And 16,097 8,049 5,366 4,024 3,219 2,683 2,300 2,012 1,789 1,610 1,463 1,341 1,238 1,150 1,073 1,006 947 894 847 805 767
UPyD 10,945 5,473 3,648 2,736 2,189 1,824 1,564 1,368 1,216 1,095 995 912 842 782 730 684 644 608 576 547 521
LOS VERDES 4,063 2,032 1,354 1,016 813 677 580 508 451 406 369 339 313 290 271 254 239 226 214 203 193
CENB 2,062 1,031 687 516 412 344 295 258 229 206 187 172 159 147 137 129 121 115 109 103 98
- 2. 2011
P.P. 166,040 51.49% 20
P.S.O.E. DE ANDALUCÍA 99,168 30.76% 11
IULV CA 24,066 7.46% 2
EP And 16,097 4.99% 0
UPyD 10,945 3.39% 0
LOS VERDES 4,063 1.26% 0
CENB 2,062 0.64% 0
- 3. 2007
128,776 46.14% 15
124,534 44.62% 15
25,772 9.23% 3
0 0.00% 0
0 0.00% 0
0 0.00% 0
0 0.00% 0