Statistiques officielles des électeurs
•
0 likes•372 views

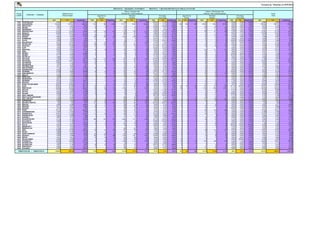
Statistiques mensuelles des électeurs – Elections du 14.10.2012 : Situation au 10.03.2012

Recommended
More Related Content
Viewers also liked
Viewers also liked (17)
Similar to Statistiques officielles des électeurs
Similar to Statistiques officielles des électeurs (20)
More from Gil Durand
More from Gil Durand (20)
Statistiques officielles des électeurs
- 1. Toestand op / Situation au 10/03/2012 PROVINCIE / KIESKRING ANTWERPEN - PROVINCE / CIRCONSCRIPTION ELECTORALE D'ANVERS Kiezers - Europese Unie Kiezers - Niet Europese Unie Niscode Belgische kiezers Electeurs de l' Union Européenne Electeurs - Hors Union Européenne Totaal CodeINS Gemeente / Commune Electeurs belges Total Ingeschreven Potentieel Percentage Ingeschreven Potentieel Percentage Inscrits Potentiel Pourcentage Inscrits Potentiel Pourcentage M/H V/F Totaal/Total M/H V/F Totaal/Total M/H V/F Totaal/Total M/H V/F Totaal/Total M/H V/F Totaal/Total M/H V/F Totaal/Total M/H V/F Totaal/Total M/H V/F Totaal/Total 11001 AARTSELAAR 5.534 5.879 11.413 26 12 38 128 102 230 20,31% 11,76% 16,52% 3 1 4 36 50 86 8,33% 2,00% 4,65% 5.563 5.892 11.455 11002 ANTWERPEN 154.649 167.591 322.240 1.182 908 2.090 17.317 15.925 33.242 6,83% 5,70% 6,29% 403 202 605 10.099 8.832 18.931 3,99% 2,29% 3,20% 156.234 168.701 324.935 11004 BOECHOUT 4.857 5.087 9.944 16 14 30 110 91 201 14,55% 15,38% 14,93% 0 1 1 26 35 61 0,00% 2,86% 1,64% 4.873 5.102 9.975 11005 BOOM 5.962 6.394 12.356 29 14 43 274 184 458 10,58% 7,61% 9,39% 11 11 22 184 167 351 5,98% 6,59% 6,27% 6.002 6.419 12.421 11007 BORSBEEK 3.733 4.139 7.872 8 4 12 158 154 312 5,06% 2,60% 3,85% 0 1 1 55 53 108 0,00% 1,89% 0,93% 3.741 4.144 7.885 11008 BRASSCHAAT 13.325 14.655 27.980 139 128 267 1.105 1.058 2.163 12,58% 12,10% 12,34% 3 1 4 108 161 269 2,78% 0,62% 1,49% 13.467 14.784 28.251 11009 BRECHT 10.466 10.957 21.423 41 27 68 598 404 1.002 6,86% 6,68% 6,79% 2 1 3 25 24 49 8,00% 4,17% 6,12% 10.509 10.985 21.494 11013 EDEGEM 7.871 8.738 16.609 38 25 63 277 242 519 13,72% 10,33% 12,14% 3 2 5 94 101 195 3,19% 1,98% 2,56% 7.912 8.765 16.677 11016 ESSEN 5.605 5.825 11.430 183 162 345 1.438 1.298 2.736 12,73% 12,48% 12,61% 1 0 1 34 23 57 2,94% 0,00% 1,75% 5.789 5.987 11.776 11018 HEMIKSEM 3.893 4.099 7.992 12 4 16 97 85 182 12,37% 4,71% 8,79% 0 0 0 52 43 95 0,00% 0,00% 0,00% 3.905 4.103 8.008 11021 HOVE 3.055 3.387 6.442 7 7 14 60 44 104 11,67% 15,91% 13,46% 1 1 2 10 10 20 10,00% 10,00% 10,00% 3.063 3.395 6.458 11022 KALMTHOUT 6.273 6.650 12.923 53 53 106 785 714 1.499 6,75% 7,42% 7,07% 1 0 1 15 24 39 6,67% 0,00% 2,56% 6.327 6.703 13.030 11023 KAPELLEN 9.569 10.245 19.814 129 122 251 875 843 1.718 14,74% 14,47% 14,61% 2 2 4 50 57 107 4,00% 3,51% 3,74% 9.700 10.369 20.069 11024 KONTICH 7.822 8.266 16.088 22 21 43 216 165 381 10,19% 12,73% 11,29% 1 2 3 52 68 120 1,92% 2,94% 2,50% 7.845 8.289 16.134 11025 LINT 3.340 3.407 6.747 8 5 13 53 40 93 15,09% 12,50% 13,98% 0 0 0 7 7 14 0,00% 0,00% 0,00% 3.348 3.412 6.760 11029 MORTSEL 9.026 9.984 19.010 30 28 58 323 336 659 9,29% 8,33% 8,80% 1 4 5 120 121 241 0,83% 3,31% 2,07% 9.057 10.016 19.073 11030 NIEL 3.432 3.730 7.162 8 6 14 84 65 149 9,52% 9,23% 9,40% 1 1 2 26 32 58 3,85% 3,13% 3,45% 3.441 3.737 7.178 11035 RANST 7.319 7.340 14.659 10 9 19 120 86 206 8,33% 10,47% 9,22% 2 0 2 29 17 46 6,90% 0,00% 4,35% 7.331 7.349 14.680 11037 RUMST 5.717 5.938 11.655 13 9 22 99 96 195 13,13% 9,38% 11,28% 3 2 5 29 30 59 10,34% 6,67% 8,47% 5.733 5.949 11.682 11038 SCHELLE 3.080 3.256 6.336 2 3 5 53 43 96 3,77% 6,98% 5,21% 0 0 0 20 22 42 0,00% 0,00% 0,00% 3.082 3.259 6.341 11039 SCHILDE 7.054 7.565 14.619 144 110 254 657 593 1.250 21,92% 18,55% 20,32% 1 0 1 27 37 64 3,70% 0,00% 1,56% 7.199 7.675 14.874 11040 SCHOTEN 12.387 13.527 25.914 76 53 129 615 557 1.172 12,36% 9,52% 11,01% 3 1 4 96 110 206 3,13% 0,91% 1,94% 12.466 13.581 26.047 11044 STABROEK 6.804 7.120 13.924 25 12 37 250 181 431 10,00% 6,63% 8,58% 1 0 1 22 29 51 4,55% 0,00% 1,96% 6.830 7.132 13.962 11050 WIJNEGEM 3.453 3.768 7.221 10 8 18 100 94 194 10,00% 8,51% 9,28% 2 1 3 21 23 44 9,52% 4,35% 6,82% 3.465 3.777 7.242 11052 WOMMELGEM 4.671 4.980 9.651 8 3 11 142 122 264 5,63% 2,46% 4,17% 0 0 0 32 26 58 0,00% 0,00% 0,00% 4.679 4.983 9.662 11053 WUUSTWEZEL 7.115 7.245 14.360 45 39 84 593 476 1.069 7,59% 8,19% 7,86% 0 0 0 29 33 62 0,00% 0,00% 0,00% 7.160 7.284 14.444 11054 ZANDHOVEN 5.040 5.108 10.148 8 6 14 100 89 189 8,00% 6,74% 7,41% 0 0 0 22 10 32 0,00% 0,00% 0,00% 5.048 5.114 10.162 11055 ZOERSEL 8.199 8.669 16.868 52 32 84 291 244 535 17,87% 13,11% 15,70% 2 3 5 20 32 52 10,00% 9,38% 9,62% 8.253 8.704 16.957 11056 ZWIJNDRECHT 7.174 7.538 14.712 17 12 29 168 166 334 10,12% 7,23% 8,68% 4 1 5 66 60 126 6,06% 1,67% 3,97% 7.195 7.551 14.746 11057 MALLE 5.552 5.846 11.398 10 4 14 203 179 382 4,93% 2,23% 3,66% 1 0 1 22 25 47 4,55% 0,00% 2,13% 5.563 5.850 11.413 12002 BERLAAR 4.286 4.450 8.736 8 10 18 66 61 127 12,12% 16,39% 14,17% 1 0 1 18 21 39 5,56% 0,00% 2,56% 4.295 4.460 8.755 12005 BONHEIDEN 5.671 6.093 11.764 6 11 17 112 118 230 5,36% 9,32% 7,39% 0 2 2 16 21 37 0,00% 9,52% 5,41% 5.677 6.106 11.783 12007 BORNEM 8.073 8.539 16.612 17 11 28 133 84 217 12,78% 13,10% 12,90% 3 0 3 42 33 75 7,14% 0,00% 4,00% 8.093 8.550 16.643 12009 DUFFEL 6.403 6.907 13.310 6 7 13 133 139 272 4,51% 5,04% 4,78% 1 0 1 33 44 77 3,03% 0,00% 1,30% 6.410 6.914 13.324 12014 HEIST-OP-DEN-BERG 16.037 16.682 32.719 14 6 20 234 165 399 5,98% 3,64% 5,01% 1 2 3 62 69 131 1,61% 2,90% 2,29% 16.052 16.690 32.742 12021 LIER 12.867 13.908 26.775 26 21 47 312 284 596 8,33% 7,39% 7,89% 38 44 82 180 210 390 21,11% 20,95% 21,03% 12.931 13.973 26.904 12025 MECHELEN 28.289 30.555 58.844 86 66 152 1.095 912 2.007 7,85% 7,24% 7,57% 25 8 33 1.186 1.255 2.441 2,11% 0,64% 1,35% 28.400 30.629 59.029 12026 NIJLEN 8.723 8.969 17.692 18 10 28 98 87 185 18,37% 11,49% 15,14% 1 1 2 24 23 47 4,17% 4,35% 4,26% 8.742 8.980 17.722 12029 PUTTE 6.643 6.855 13.498 10 2 12 119 70 189 8,40% 2,86% 6,35% 1 0 1 23 23 46 4,35% 0,00% 2,17% 6.654 6.857 13.511 12030 PUURS 6.428 6.714 13.142 16 10 26 86 65 151 18,60% 15,38% 17,22% 2 0 2 20 21 41 10,00% 0,00% 4,88% 6.446 6.724 13.170 12034 SINT-AMANDS 3.134 3.193 6.327 8 6 14 41 46 87 19,51% 13,04% 16,09% 1 0 1 24 31 55 4,17% 0,00% 1,82% 3.143 3.199 6.342 12035 SINT-KATELIJNE-WAVER 7.726 8.056 15.782 9 6 15 238 160 398 3,78% 3,75% 3,77% 1 1 2 39 35 74 2,56% 2,86% 2,70% 7.736 8.063 15.799 12040 WILLEBROEK 8.969 9.579 18.548 14 16 30 239 184 423 5,86% 8,70% 7,09% 4 6 10 177 190 367 2,26% 3,16% 2,72% 8.987 9.601 18.588 13001 ARENDONK 4.395 4.538 8.933 25 26 51 629 575 1.204 3,97% 4,52% 4,24% 0 0 0 16 25 41 0,00% 0,00% 0,00% 4.420 4.564 8.984 13002 BAARLE-HERTOG 502 525 1.027 131 98 229 522 481 1.003 25,10% 20,37% 22,83% 0 0 0 0 2 2 0,00% 0,00% 0,00% 633 623 1.256 13003 BALEN 8.368 8.456 16.824 19 15 34 360 318 678 5,28% 4,72% 5,01% 0 0 0 12 25 37 0,00% 0,00% 0,00% 8.387 8.471 16.858 13004 BEERSE 6.317 6.567 12.884 28 21 49 329 267 596 8,51% 7,87% 8,22% 0 0 0 23 27 50 0,00% 0,00% 0,00% 6.345 6.588 12.933 13006 DESSEL 3.518 3.564 7.082 12 8 20 188 125 313 6,38% 6,40% 6,39% 1 0 1 10 7 17 10,00% 0,00% 5,88% 3.531 3.572 7.103 13008 GEEL 14.310 14.914 29.224 23 15 38 522 401 923 4,41% 3,74% 4,12% 2 2 4 105 103 208 1,90% 1,94% 1,92% 14.335 14.931 29.266 13010 GROBBENDONK 4.387 4.403 8.790 9 5 14 103 82 185 8,74% 6,10% 7,57% 0 0 0 12 21 33 0,00% 0,00% 0,00% 4.396 4.408 8.804 13011 HERENTALS 10.701 11.226 21.927 32 20 52 264 217 481 12,12% 9,22% 10,81% 8 3 11 97 79 176 8,25% 3,80% 6,25% 10.741 11.249 21.990 13012 HERENTHOUT 3.461 3.595 7.056 0 2 2 81 65 146 0,00% 3,08% 1,37% 0 0 0 7 8 15 0,00% 0,00% 0,00% 3.461 3.597 7.058 13013 HERSELT 5.867 5.791 11.658 8 2 10 113 87 200 7,08% 2,30% 5,00% 0 0 0 14 25 39 0,00% 0,00% 0,00% 5.875 5.793 11.668 13014 HOOGSTRATEN 6.115 6.145 12.260 266 210 476 2.093 1.747 3.840 12,71% 12,02% 12,40% 2 1 3 39 25 64 5,13% 4,00% 4,69% 6.383 6.356 12.739 13016 HULSHOUT 4.003 4.108 8.111 9 5 14 63 49 112 14,29% 10,20% 12,50% 0 0 0 6 12 18 0,00% 0,00% 0,00% 4.012 4.113 8.125 13017 KASTERLEE 7.147 7.153 14.300 15 13 28 241 185 426 6,22% 7,03% 6,57% 1 0 1 12 20 32 8,33% 0,00% 3,13% 7.163 7.166 14.329 13019 LILLE 6.472 6.373 12.845 17 12 29 159 122 281 10,69% 9,84% 10,32% 4 3 7 14 22 36 28,57% 13,64% 19,44% 6.493 6.388 12.881 13021 MEERHOUT 3.931 4.002 7.933 6 4 10 70 78 148 8,57% 5,13% 6,76% 1 0 1 21 13 34 4,76% 0,00% 2,94% 3.938 4.006 7.944 13023 MERKSPLAS 3.188 3.053 6.241 14 7 21 246 207 453 5,69% 3,38% 4,64% 0 0 0 13 7 20 0,00% 0,00% 0,00% 3.202 3.060 6.262 13025 MOL 12.968 13.356 26.324 69 57 126 874 738 1.612 7,89% 7,72% 7,82% 4 7 11 90 127 217 4,44% 5,51% 5,07% 13.041 13.420 26.461 13029 OLEN 4.668 4.750 9.418 6 4 10 84 77 161 7,14% 5,19% 6,21% 0 0 0 12 19 31 0,00% 0,00% 0,00% 4.674 4.754 9.428 13031 OUD-TURNHOUT 4.597 4.697 9.294 54 40 94 615 580 1.195 8,78% 6,90% 7,87% 0 0 0 11 13 24 0,00% 0,00% 0,00% 4.651 4.737 9.388 13035 RAVELS 4.035 4.098 8.133 192 177 369 1.784 1.617 3.401 10,76% 10,95% 10,85% 0 1 1 18 25 43 0,00% 4,00% 2,33% 4.227 4.276 8.503 13036 RETIE 4.031 3.941 7.972 35 28 63 353 289 642 9,92% 9,69% 9,81% 0 0 0 13 15 28 0,00% 0,00% 0,00% 4.066 3.969 8.035 13037 RIJKEVORSEL 4.283 4.293 8.576 9 9 18 242 180 422 3,72% 5,00% 4,27% 0 1 1 5 4 9 0,00% 25,00% 11,11% 4.292 4.303 8.595 13040 TURNHOUT 14.548 15.609 30.157 75 39 114 1.426 1.149 2.575 5,26% 3,39% 4,43% 12 3 15 270 262 532 4,44% 1,15% 2,82% 14.635 15.651 30.286 13044 VORSELAAR 3.044 3.110 6.154 4 2 6 50 34 84 8,00% 5,88% 7,14% 0 0 0 6 3 9 0,00% 0,00% 0,00% 3.048 3.112 6.160 13046 VOSSELAAR 4.087 4.180 8.267 38 22 60 201 155 356 18,91% 14,19% 16,85% 0 1 1 9 16 25 0,00% 6,25% 4,00% 4.125 4.203 8.328 13049 WESTERLO 9.685 9.634 19.319 13 9 22 220 134 354 5,91% 6,72% 6,21% 1 2 3 31 36 67 3,23% 5,56% 4,48% 9.699 9.645 19.344 13053 LAAKDAL 6.195 6.252 12.447 7 8 15 133 108 241 5,26% 7,41% 6,22% 0 0 0 12 10 22 0,00% 0,00% 0,00% 6.202 6.260 12.462 PROVINCIE / PROVINCE 630.049 665.766 1.295.815 3.705 2.880 6.585 42.160 37.118 79.278 8,79% 7,76% 8,31% 567 326 893 14.150 13.189 27.339 4,01% 2,47% 3,27% 634.321 668.972 1.303.293
- 2. Toestand op / Situation au 10/03/2012 HET BRUSSELS HOOFDSTEDELIJK GEWEST - LA REGION DE BRUXELLES - CAPITALE Kiezers - Europese Unie Kiezers - Niet Europese Unie Niscode Belgische kiezers Electeurs de l' Union européenne Electeurs - Hors Union Européenne Totaal CodeINS Gemeente / Commune Electeurs belges Total Ingeschreven Potentieel Percentage Ingeschreven Potentieel Percentage Inscrits Potentiel Pourcentage Inscrits Potentiel Pourcentage M/H V/F Totaal/Total M/H V/F Totaal/Total M/H V/F Totaal/Total M/H V/F Totaal/Total M/H V/F Totaal/Total M/H V/F Totaal/Total M/H V/F Totaal/Total M/H V/F Totaal/Total 21001 ANDERLECHT 26.780 30.061 56.841 651 562 1.213 8.016 7.510 15.526 8,12% 7,48% 7,81% 125 60 185 3.134 2.704 5.838 3,99% 2,22% 3,17% 27.556 30.683 58.239 ANDERLECHT 21002 OUDERGEM 8.593 10.314 18.907 263 289 552 2.194 2.429 4.623 11,99% 11,90% 11,94% 15 13 28 304 302 606 4,93% 4,30% 4,62% 8.871 10.616 19.487 AUDERGHEM 21003 SINT-AGATHA-BERCHEM 6.582 7.743 14.325 107 100 207 989 1.016 2.005 10,82% 9,84% 10,32% 14 17 31 317 329 646 4,42% 5,17% 4,80% 6.703 7.860 14.563 BERCHEM-SAINTE-AGATHE 21004 BRUSSEL 39.253 40.003 79.256 954 860 1.814 14.091 13.591 27.682 6,77% 6,33% 6,55% 315 164 479 5.379 4.705 10.084 5,86% 3,49% 4,75% 40.522 41.027 81.549 BRUXELLES 21005 ETTERBEEK 9.716 11.114 20.830 348 441 789 5.673 6.980 12.653 6,13% 6,32% 6,24% 36 19 55 811 767 1.578 4,44% 2,48% 3,49% 10.100 11.574 21.674 ETTERBEEK 21006 EVERE 9.711 12.055 21.766 136 144 280 1.814 1.895 3.709 7,50% 7,60% 7,55% 41 43 84 685 696 1.381 5,99% 6,18% 6,08% 9.888 12.242 22.130 EVERE 21007 VORST 12.531 14.676 27.207 373 426 799 4.491 4.610 9.101 8,31% 9,24% 8,78% 58 29 87 1.095 1.114 2.209 5,30% 2,60% 3,94% 12.962 15.131 28.093 FOREST 21008 GANSHOREN 6.487 8.321 14.808 109 131 240 1.011 1.062 2.073 10,78% 12,34% 11,58% 22 9 31 400 362 762 5,50% 2,49% 4,07% 6.618 8.461 15.079 GANSHOREN 21009 ELSENE 17.837 19.312 37.149 714 718 1.432 11.326 12.972 24.298 6,30% 5,53% 5,89% 84 49 133 2.014 1.654 3.668 4,17% 2,96% 3,63% 18.635 20.079 38.714 IXELLES 21010 JETTE 13.320 16.292 29.612 229 218 447 2.263 2.333 4.596 10,12% 9,34% 9,73% 44 25 69 880 950 1.830 5,00% 2,63% 3,77% 13.593 16.535 30.128 JETTE 21011 KOEKELBERG 5.165 5.732 10.897 98 109 207 1.294 1.237 2.531 7,57% 8,81% 8,18% 32 16 48 540 526 1.066 5,93% 3,04% 4,50% 5.295 5.857 11.152 KOEKELBERG 21012 SINT-JANS-MOLENBEEK 22.068 24.354 46.422 298 282 580 4.931 4.581 9.512 6,04% 6,16% 6,10% 135 63 198 3.046 2.806 5.852 4,43% 2,25% 3,38% 22.501 24.699 47.200 MOLENBEEK-SAINT-JEAN 21013 SINT-GILLIS (BIJ-BRUSSEL) 9.898 9.898 19.796 762 798 1.560 6.611 6.854 13.465 11,53% 11,64% 11,59% 92 53 145 1.508 1.257 2.765 6,10% 4,22% 5,24% 10.752 10.749 21.501 SAINT-GILLES 21014 SINT-JOOST-TEN-NODE 5.660 5.546 11.206 85 104 189 2.293 2.273 4.566 3,71% 4,58% 4,14% 40 27 67 1.166 995 2.161 3,43% 2,71% 3,10% 5.785 5.677 11.462 SAINT-JOSSE-TEN-NOODE 21015 SCHAARBEEK 29.339 31.466 60.805 622 654 1.276 8.829 9.351 18.180 7,04% 6,99% 7,02% 304 185 489 4.484 4.195 8.679 6,78% 4,41% 5,63% 30.265 32.305 62.570 SCHAERBEEK 21016 UKKEL 20.212 25.168 45.380 684 777 1.461 6.894 7.804 14.698 9,92% 9,96% 9,94% 41 32 73 847 929 1.776 4,84% 3,44% 4,11% 20.937 25.977 46.914 UCCLE 21017 WATERMAAL-BOSVOORDE 7.156 8.890 16.046 241 267 508 1.272 1.438 2.710 18,95% 18,57% 18,75% 12 10 22 166 194 360 7,23% 5,15% 6,11% 7.409 9.167 16.576 WATERMAEL-BOITSFORT 21018 SINT-LAMBRECHTS-WOLUWE 12.339 16.133 28.472 403 469 872 4.590 5.726 10.316 8,78% 8,19% 8,45% 27 21 48 545 628 1.173 4,95% 3,34% 4,09% 12.769 16.623 29.392 WOLUWE-SAINT-LAMBERT 21019 SINT-PIETERS-WOLUWE 9.900 12.063 21.963 521 562 1.083 3.725 4.345 8.070 13,99% 12,93% 13,42% 18 10 28 310 360 670 5,81% 2,78% 4,18% 10.439 12.635 23.074 WOLUWE-SAINT-PIERRE TOTALEN / TOTAUX 272.547 309.141 581.688 7.598 7.911 15.509 92.307 98.007 190.314 8,23% 8,07% 8,15% 1.455 845 2.300 27.631 25.473 53.104 5,27% 3,32% 4,33% 281.600 317.897 599.497
- 3. Toestand op / Situation au 10/03/2012 PROVINCIE / KIESKRING VLAAMS-BRABANT - CIRCONSCRIPTION ELECTORALE DE BRABANT FLAMAND Kiezers - Europese Unie Kiezers - Niet Europese Unie Niscode Belgische kiezers Electeurs de l' Union européenne Electeurs - Hors Union Européenne Totaal CodeINS Gemeente / Commune Electeurs belges Total Ingeschreven Potentieel Percentage Ingeschreven Potentieel Percentage Inscrits Potentiel Pourcentage Inscrits Potentiel Pourcentage M/H V/F Totaal/Total M/H V/F Totaal/Total M/H V/F Totaal/Total M/H V/F Totaal/Total M/H V/F Totaal/Total M/H V/F Totaal/Total M/H V/F Totaal/Total M/H V/F Totaal/Total 23002 ASSE 10.671 11.801 22.472 49 27 76 645 571 1.216 7,60% 4,73% 6,25% 15 7 22 220 234 454 6,82% 2,99% 4,85% 10.735 11.835 22.570 23003 BEERSEL 8.286 8.966 17.252 104 80 184 679 656 1.335 15,32% 12,20% 13,78% 8 6 14 77 97 174 10,39% 6,19% 8,05% 8.398 9.052 17.450 23009 BEVER 820 821 1.641 6 5 11 21 21 42 28,57% 23,81% 26,19% 0 0 0 1 5 6 0,00% 0,00% 0,00% 826 826 1.652 23016 DILBEEK 14.187 15.793 29.980 146 126 272 934 840 1.774 15,63% 15,00% 15,33% 13 16 29 188 228 416 6,91% 7,02% 6,97% 14.346 15.935 30.281 23023 GALMAARDEN 3.284 3.421 6.705 6 4 10 42 40 82 14,29% 10,00% 12,20% 0 1 1 5 15 20 0,00% 6,67% 5,00% 3.290 3.426 6.716 23024 GOOIK 3.586 3.672 7.258 10 7 17 54 43 97 18,52% 16,28% 17,53% 4 4 8 9 12 21 44,44% 33,33% 38,10% 3.600 3.683 7.283 23025 GRIMBERGEN 12.153 13.894 26.047 75 60 135 857 822 1.679 8,75% 7,30% 8,04% 9 2 11 224 259 483 4,02% 0,77% 2,28% 12.237 13.956 26.193 23027 HALLE 13.209 14.331 27.540 52 48 100 572 530 1.102 9,09% 9,06% 9,07% 12 12 24 171 211 382 7,02% 5,69% 6,28% 13.273 14.391 27.664 23032 HERNE 2.507 2.677 5.184 10 3 13 46 28 74 21,74% 10,71% 17,57% 0 0 0 3 8 11 0,00% 0,00% 0,00% 2.517 2.680 5.197 23033 HOEILAART 3.268 3.648 6.916 79 70 149 506 518 1.024 15,61% 13,51% 14,55% 2 1 3 51 49 100 3,92% 2,04% 3,00% 3.349 3.719 7.068 23038 KAMPENHOUT 4.264 4.452 8.716 17 17 34 117 121 238 14,53% 14,05% 14,29% 1 0 1 13 19 32 7,69% 0,00% 3,13% 4.282 4.469 8.751 23039 KAPELLE-OP-DEN-BOS 3.543 3.784 7.327 7 8 15 59 50 109 11,86% 16,00% 13,76% 1 0 1 9 11 20 11,11% 0,00% 5,00% 3.551 3.792 7.343 23044 LIEDEKERKE 4.697 5.060 9.757 6 8 14 109 105 214 5,50% 7,62% 6,54% 2 4 6 59 62 121 3,39% 6,45% 4,96% 4.705 5.072 9.777 23045 LONDERZEEL 6.910 7.202 14.112 15 14 29 169 109 278 8,88% 12,84% 10,43% 2 1 3 35 35 70 5,71% 2,86% 4,29% 6.927 7.217 14.144 23047 MACHELEN (BRAB.) 4.355 4.816 9.171 23 22 45 398 375 773 5,78% 5,87% 5,82% 7 3 10 149 182 331 4,70% 1,65% 3,02% 4.385 4.841 9.226 23050 MEISE 6.766 7.250 14.016 37 24 61 306 267 573 12,09% 8,99% 10,65% 12 1 13 72 70 142 16,67% 1,43% 9,15% 6.815 7.275 14.090 23052 MERCHTEM 5.968 6.268 12.236 14 9 23 147 135 282 9,52% 6,67% 8,16% 1 1 2 59 73 132 1,69% 1,37% 1,52% 5.983 6.278 12.261 23060 OPWIJK 5.123 5.441 10.564 5 4 9 79 82 161 6,33% 4,88% 5,59% 0 1 1 29 32 61 0,00% 3,13% 1,64% 5.128 5.446 10.574 23062 OVERIJSE 7.444 8.150 15.594 225 200 425 1.557 1.541 3.098 14,45% 12,98% 13,72% 5 3 8 135 147 282 3,70% 2,04% 2,84% 7.674 8.353 16.027 23064 PEPINGEN 1.669 1.768 3.437 2 6 8 15 16 31 13,33% 37,50% 25,81% 0 0 0 6 4 10 0,00% 0,00% 0,00% 1.671 1.774 3.445 23077 SINT-PIETERS-LEEUW 10.727 11.660 22.387 129 127 256 1.244 1.167 2.411 10,37% 10,88% 10,62% 9 5 14 191 240 431 4,71% 2,08% 3,25% 10.865 11.792 22.657 23081 STEENOKKERZEEL 4.207 4.506 8.713 18 12 30 190 186 376 9,47% 6,45% 7,98% 2 0 2 33 35 68 6,06% 0,00% 2,94% 4.227 4.518 8.745 23086 TERNAT 5.812 6.070 11.882 15 14 29 128 114 242 11,72% 12,28% 11,98% 5 1 6 25 25 50 20,00% 4,00% 12,00% 5.832 6.085 11.917 23088 VILVOORDE 12.668 14.024 26.692 172 151 323 1.378 1.350 2.728 12,48% 11,19% 11,84% 19 10 29 500 565 1.065 3,80% 1,77% 2,72% 12.859 14.185 27.044 23094 ZAVENTEM 9.418 10.421 19.839 91 88 179 1.780 1.780 3.560 5,11% 4,94% 5,03% 11 2 13 331 343 674 3,32% 0,58% 1,93% 9.520 10.511 20.031 23096 ZEMST 8.368 8.885 17.253 35 21 56 214 176 390 16,36% 11,93% 14,36% 1 1 2 32 31 63 3,13% 3,23% 3,17% 8.404 8.907 17.311 23097 ROOSDAAL 4.228 4.461 8.689 9 6 15 98 87 185 9,18% 6,90% 8,11% 1 1 2 22 25 47 4,55% 4,00% 4,26% 4.238 4.468 8.706 23098 DROGENBOS 1.455 1.809 3.264 36 30 66 273 265 538 13,19% 11,32% 12,27% 1 1 2 31 37 68 3,23% 2,70% 2,94% 1.492 1.840 3.332 23099 KRAAINEM 3.642 3.967 7.609 181 201 382 1.144 1.265 2.409 15,82% 15,89% 15,86% 4 4 8 103 112 215 3,88% 3,57% 3,72% 3.827 4.172 7.999 23100 LINKEBEEK 1.572 1.751 3.323 41 50 91 188 200 388 21,81% 25,00% 23,45% 2 1 3 17 14 31 11,76% 7,14% 9,68% 1.615 1.802 3.417 23101 SINT-GENESIUS-RODE 5.495 6.110 11.605 133 142 275 955 956 1.911 13,93% 14,85% 14,39% 3 0 3 113 113 226 2,65% 0,00% 1,33% 5.631 6.252 11.883 23102 WEMMEL 4.995 5.764 10.759 46 57 103 535 525 1.060 8,60% 10,86% 9,72% 14 3 17 121 109 230 11,57% 2,75% 7,39% 5.055 5.824 10.879 23103 WEZEMBEEK-OPPEM 3.955 4.476 8.431 159 155 314 991 1.021 2.012 16,04% 15,18% 15,61% 3 3 6 79 107 186 3,80% 2,80% 3,23% 4.117 4.634 8.751 23104 LENNIK 3.416 3.617 7.033 12 9 21 88 83 171 13,64% 10,84% 12,28% 0 2 2 16 21 37 0,00% 9,52% 5,41% 3.428 3.628 7.056 23105 AFFLIGEM 4.777 4.971 9.748 9 7 16 79 69 148 11,39% 10,14% 10,81% 2 1 3 34 36 70 5,88% 2,78% 4,29% 4.788 4.979 9.767 24001 AARSCHOT 11.407 12.027 23.434 14 16 30 232 191 423 6,03% 8,38% 7,09% 1 4 5 25 44 69 4,00% 9,09% 7,25% 11.422 12.047 23.469 24007 BEGIJNENDIJK 3.988 4.034 8.022 4 2 6 59 42 101 6,78% 4,76% 5,94% 0 0 0 7 8 15 0,00% 0,00% 0,00% 3.992 4.036 8.028 24008 BEKKEVOORT 2.409 2.449 4.858 1 2 3 25 28 53 4,00% 7,14% 5,66% 0 0 0 5 8 13 0,00% 0,00% 0,00% 2.410 2.451 4.861 24009 BERTEM 3.413 3.637 7.050 20 17 37 170 176 346 11,76% 9,66% 10,69% 1 1 2 12 22 34 8,33% 4,55% 5,88% 3.434 3.655 7.089 24011 BIERBEEK 3.612 3.685 7.297 6 7 13 76 85 161 7,89% 8,24% 8,07% 1 0 1 12 19 31 8,33% 0,00% 3,23% 3.619 3.692 7.311 24014 BOORTMEERBEEK 4.549 4.745 9.294 17 11 28 142 84 226 11,97% 13,10% 12,39% 0 0 0 16 18 34 0,00% 0,00% 0,00% 4.566 4.756 9.322 24016 BOUTERSEM 2.980 3.044 6.024 9 7 16 51 47 98 17,65% 14,89% 16,33% 0 0 0 9 13 22 0,00% 0,00% 0,00% 2.989 3.051 6.040 24020 DIEST 8.942 9.411 18.353 17 9 26 240 185 425 7,08% 4,86% 6,12% 4 4 8 79 99 178 5,06% 4,04% 4,49% 8.963 9.424 18.387 24028 GEETBETS 2.352 2.405 4.757 4 5 9 44 45 89 9,09% 11,11% 10,11% 0 1 1 8 11 19 0,00% 9,09% 5,26% 2.356 2.411 4.767 24033 HAACHT 5.344 5.730 11.074 11 10 21 96 69 165 11,46% 14,49% 12,73% 1 1 2 13 12 25 7,69% 8,33% 8,00% 5.356 5.741 11.097 24038 HERENT 7.611 8.181 15.792 24 11 35 193 190 383 12,44% 5,79% 9,14% 3 4 7 48 64 112 6,25% 6,25% 6,25% 7.638 8.196 15.834 24041 HOEGAARDEN 2.465 2.673 5.138 6 3 9 65 55 120 9,23% 5,45% 7,50% 1 1 2 14 14 28 7,14% 7,14% 7,14% 2.472 2.677 5.149 24043 HOLSBEEK 3.751 3.783 7.534 8 9 17 57 52 109 14,04% 17,31% 15,60% 0 0 0 6 6 12 0,00% 0,00% 0,00% 3.759 3.792 7.551 24045 HULDENBERG 3.390 3.605 6.995 20 13 33 222 223 445 9,01% 5,83% 7,42% 0 1 1 21 20 41 0,00% 5,00% 2,44% 3.410 3.619 7.029 24048 KEERBERGEN 4.754 4.984 9.738 45 48 93 309 282 591 14,56% 17,02% 15,74% 0 1 1 17 19 36 0,00% 5,26% 2,78% 4.799 5.033 9.832 24054 KORTENAKEN 3.153 3.156 6.309 2 1 3 32 32 64 6,25% 3,13% 4,69% 0 0 0 13 11 24 0,00% 0,00% 0,00% 3.155 3.157 6.312 24055 KORTENBERG 6.774 7.079 13.853 42 23 65 540 505 1.045 7,78% 4,55% 6,22% 0 0 0 83 118 201 0,00% 0,00% 0,00% 6.816 7.102 13.918 24059 LANDEN 5.905 6.353 12.258 19 13 32 134 131 265 14,18% 9,92% 12,08% 2 0 2 27 37 64 7,41% 0,00% 3,13% 5.926 6.366 12.292 24062 LEUVEN 32.600 34.502 67.102 160 125 285 3.117 3.198 6.315 5,13% 3,91% 4,51% 25 13 38 1.071 840 1.911 2,33% 1,55% 1,99% 32.785 34.640 67.425 24066 LUBBEEK 5.412 5.579 10.991 26 19 45 127 115 242 20,47% 16,52% 18,60% 0 3 3 10 20 30 0,00% 15,00% 10,00% 5.438 5.601 11.039 24086 OUD-HEVERLEE 4.202 4.287 8.489 16 9 25 113 118 231 14,16% 7,63% 10,82% 2 2 4 15 21 36 13,33% 9,52% 11,11% 4.220 4.298 8.518 24094 ROTSELAAR 6.164 6.315 12.479 18 16 34 124 120 244 14,52% 13,33% 13,93% 1 2 3 18 19 37 5,56% 10,53% 8,11% 6.183 6.333 12.516 24104 TERVUREN 5.951 6.579 12.530 202 174 376 1.658 1.650 3.308 12,18% 10,55% 11,37% 3 2 5 109 123 232 2,75% 1,63% 2,16% 6.156 6.755 12.911 24107 TIENEN 12.384 13.560 25.944 19 11 30 289 290 579 6,57% 3,79% 5,18% 1 1 2 125 129 254 0,80% 0,78% 0,79% 12.404 13.572 25.976 24109 TREMELO 5.723 5.893 11.616 11 10 21 167 125 292 6,59% 8,00% 7,19% 1 0 1 13 20 33 7,69% 0,00% 3,03% 5.735 5.903 11.638 24130 ZOUTLEEUW 3.269 3.438 6.707 1 1 2 48 46 94 2,08% 2,17% 2,13% 0 0 0 10 11 21 0,00% 0,00% 0,00% 3.270 3.439 6.709 24133 LINTER 2.823 2.920 5.743 1 0 1 23 25 48 4,35% 0,00% 2,08% 0 0 0 5 9 14 0,00% 0,00% 0,00% 2.824 2.920 5.744 24134 SCHERPENHEUVEL-ZICHEM 8.992 9.354 18.346 15 7 22 184 130 314 8,15% 5,38% 7,01% 0 1 1 27 40 67 0,00% 2,50% 1,49% 9.007 9.362 18.369 24135 TIELT-WINGE 4.148 4.248 8.396 9 1 10 58 40 98 15,52% 2,50% 10,20% 0 0 0 12 13 25 0,00% 0,00% 0,00% 4.157 4.249 8.406 24137 GLABBEEK 2.069 2.101 4.170 2 0 2 26 15 41 7,69% 0,00% 4,88% 0 0 0 2 3 5 0,00% 0,00% 0,00% 2.071 2.101 4.172 PROVINCIE / PROVINCE 387.981 415.464 803.445 2.723 2.392 5.115 25.218 24.408 49.626 10,80% 9,80% 10,31% 218 140 358 4.995 5.357 10.352 4,36% 2,61% 3,46% 390.922 417.996 808.918
- 4. Situation au / Toestand op 10/03/2012 PROVINCE DE BRABANT WALLON / CIRCONSCRIPTION ELECTORALE DE NIVELLES - PROVINCIE WAALS-BRABANT / KIESKRING NIJVEL Electeurs de l' Union européenne Electeurs - Hors Union Européenne CodeINS Electeurs belges Kiezers - Europese Unie Kiezers - Niet Europese Unie Total Niscode Commune / Gemeente Belgische kiezers Totaal Inscrits Potentiel Pourcentage Inscrits Potentiel Pourcentage Ingeschreven Potentieel Percentage Ingeschreven Potentieel Percentage H/M F/V Total/Totaal H/M F/V Total/Totaal H/M F/V Total/Totaal H/M F/V Total/Totaal H/M F/V Total/Totaal H/M F/V Total/Totaal H/M F/V Total/Totaal H/M F/V Total/Totaal 25005 BEAUVECHAIN 2.457 2.547 5.004 25 28 53 137 129 266 18,25% 21,71% 19,92% 2 1 3 16 17 33 12,50% 5,88% 9,09% 2.484 2.576 5.060 25014 BRAINE-L'ALLEUD 13.128 14.944 28.072 190 177 367 1.230 1.214 2.444 15,45% 14,58% 15,02% 6 3 9 109 144 253 5,50% 2,08% 3,56% 13.324 15.124 28.448 25015 BRAINE-LE-CHATEAU 3.448 3.793 7.241 46 29 75 265 235 500 17,36% 12,34% 15,00% 3 0 3 16 15 31 18,75% 0,00% 9,68% 3.497 3.822 7.319 25018 CHAUMONT-GISTOUX 4.069 4.345 8.414 58 40 98 268 245 513 21,64% 16,33% 19,10% 2 1 3 23 22 45 8,70% 4,55% 6,67% 4.129 4.386 8.515 25023 COURT-SAINT-ETIENNE 3.370 3.665 7.035 55 44 99 241 193 434 22,82% 22,80% 22,81% 3 3 6 43 34 77 6,98% 8,82% 7,79% 3.428 3.712 7.140 25031 GENAPPE 5.398 5.700 11.098 49 70 119 294 287 581 16,67% 24,39% 20,48% 1 0 1 38 40 78 2,63% 0,00% 1,28% 5.448 5.770 11.218 25037 GREZ-DOICEAU 4.500 4.922 9.422 59 54 113 311 302 613 18,97% 17,88% 18,43% 2 5 7 23 26 49 8,70% 19,23% 14,29% 4.561 4.981 9.542 25043 INCOURT 1.774 1.858 3.632 13 13 26 74 74 148 17,57% 17,57% 17,57% 0 0 0 4 6 10 0,00% 0,00% 0,00% 1.787 1.871 3.658 25044 ITTRE 2.243 2.463 4.706 54 35 89 173 129 302 31,21% 27,13% 29,47% 0 0 0 8 10 18 0,00% 0,00% 0,00% 2.297 2.498 4.795 25048 JODOIGNE 4.753 5.238 9.991 49 44 93 222 200 422 22,07% 22,00% 22,04% 3 2 5 32 31 63 9,38% 6,45% 7,94% 4.805 5.284 10.089 25050 LA HULPE 2.347 2.624 4.971 72 74 146 370 398 768 19,46% 18,59% 19,01% 2 5 7 29 44 73 6,90% 11,36% 9,59% 2.421 2.703 5.124 25068 MONT-SAINT-GUIBERT 2.457 2.627 5.084 29 17 46 114 101 215 25,44% 16,83% 21,40% 2 0 2 12 14 26 16,67% 0,00% 7,69% 2.488 2.644 5.132 25072 NIVELLES 9.273 10.714 19.987 98 93 191 649 628 1.277 15,10% 14,81% 14,96% 6 6 12 76 93 169 7,89% 6,45% 7,10% 9.377 10.813 20.190 25084 PERWEZ 2.919 3.171 6.090 21 17 38 125 112 237 16,80% 15,18% 16,03% 2 1 3 10 13 23 20,00% 7,69% 13,04% 2.942 3.189 6.131 25091 RIXENSART 7.243 8.185 15.428 166 165 331 782 834 1.616 21,23% 19,78% 20,48% 7 9 16 66 89 155 10,61% 10,11% 10,32% 7.416 8.359 15.775 25105 TUBIZE 7.418 8.244 15.662 418 343 761 1.412 1.294 2.706 29,60% 26,51% 28,12% 7 3 10 117 140 257 5,98% 2,14% 3,89% 7.843 8.590 16.433 25107 VILLERS-LA-VILLE 3.664 3.901 7.565 25 27 52 163 131 294 15,34% 20,61% 17,69% 0 3 3 20 16 36 0,00% 18,75% 8,33% 3.689 3.931 7.620 25110 WATERLOO 8.906 10.482 19.388 216 234 450 1.629 1.719 3.348 13,26% 13,61% 13,44% 10 8 18 182 198 380 5,49% 4,04% 4,74% 9.132 10.724 19.856 25112 WAVRE 11.393 12.913 24.306 123 136 259 846 879 1.725 14,54% 15,47% 15,01% 10 6 16 131 140 271 7,63% 4,29% 5,90% 11.526 13.055 24.581 25117 CHASTRE 2.472 2.680 5.152 19 18 37 91 88 179 20,88% 20,45% 20,67% 3 2 5 19 22 41 15,79% 9,09% 12,20% 2.494 2.700 5.194 25118 HELECINE 1.174 1.261 2.435 13 13 26 50 46 96 26,00% 28,26% 27,08% 1 1 2 4 3 7 25,00% 33,33% 28,57% 1.188 1.275 2.463 25119 LASNE 4.680 5.032 9.712 109 98 207 614 561 1.175 17,75% 17,47% 17,62% 3 3 6 39 48 87 7,69% 6,25% 6,90% 4.792 5.133 9.925 25120 ORP-JAUCHE 2.972 3.244 6.216 28 10 38 108 98 206 25,93% 10,20% 18,45% 3 0 3 16 9 25 18,75% 0,00% 12,00% 3.003 3.254 6.257 25121 OTTIGNIES-LOUVAIN-LA-NEUVE 10.315 11.158 21.473 113 94 207 953 1.066 2.019 11,86% 8,82% 10,25% 10 11 21 206 218 424 4,85% 5,05% 4,95% 10.438 11.263 21.701 25122 RAMILLIES 2.235 2.282 4.517 20 16 36 66 77 143 30,30% 20,78% 25,17% 1 0 1 3 8 11 33,33% 0,00% 9,09% 2.256 2.298 4.554 25123 REBECQ 3.509 3.819 7.328 173 140 313 404 366 770 42,82% 38,25% 40,65% 0 0 0 18 14 32 0,00% 0,00% 0,00% 3.682 3.959 7.641 25124 WALHAIN 2.336 2.407 4.743 13 18 31 79 77 156 16,46% 23,38% 19,87% 2 0 2 8 9 17 25,00% 0,00% 11,76% 2.351 2.425 4.776 PROVINCE / PROVINCIE 130.453 144.219 274.672 2.254 2.047 4.301 11.670 11.483 23.153 19,31% 17,83% 18,58% 91 73 164 1.268 1.423 2.691 7,18% 5,13% 6,09% 132.798 146.339 279.137