Download as PDF, PPTX

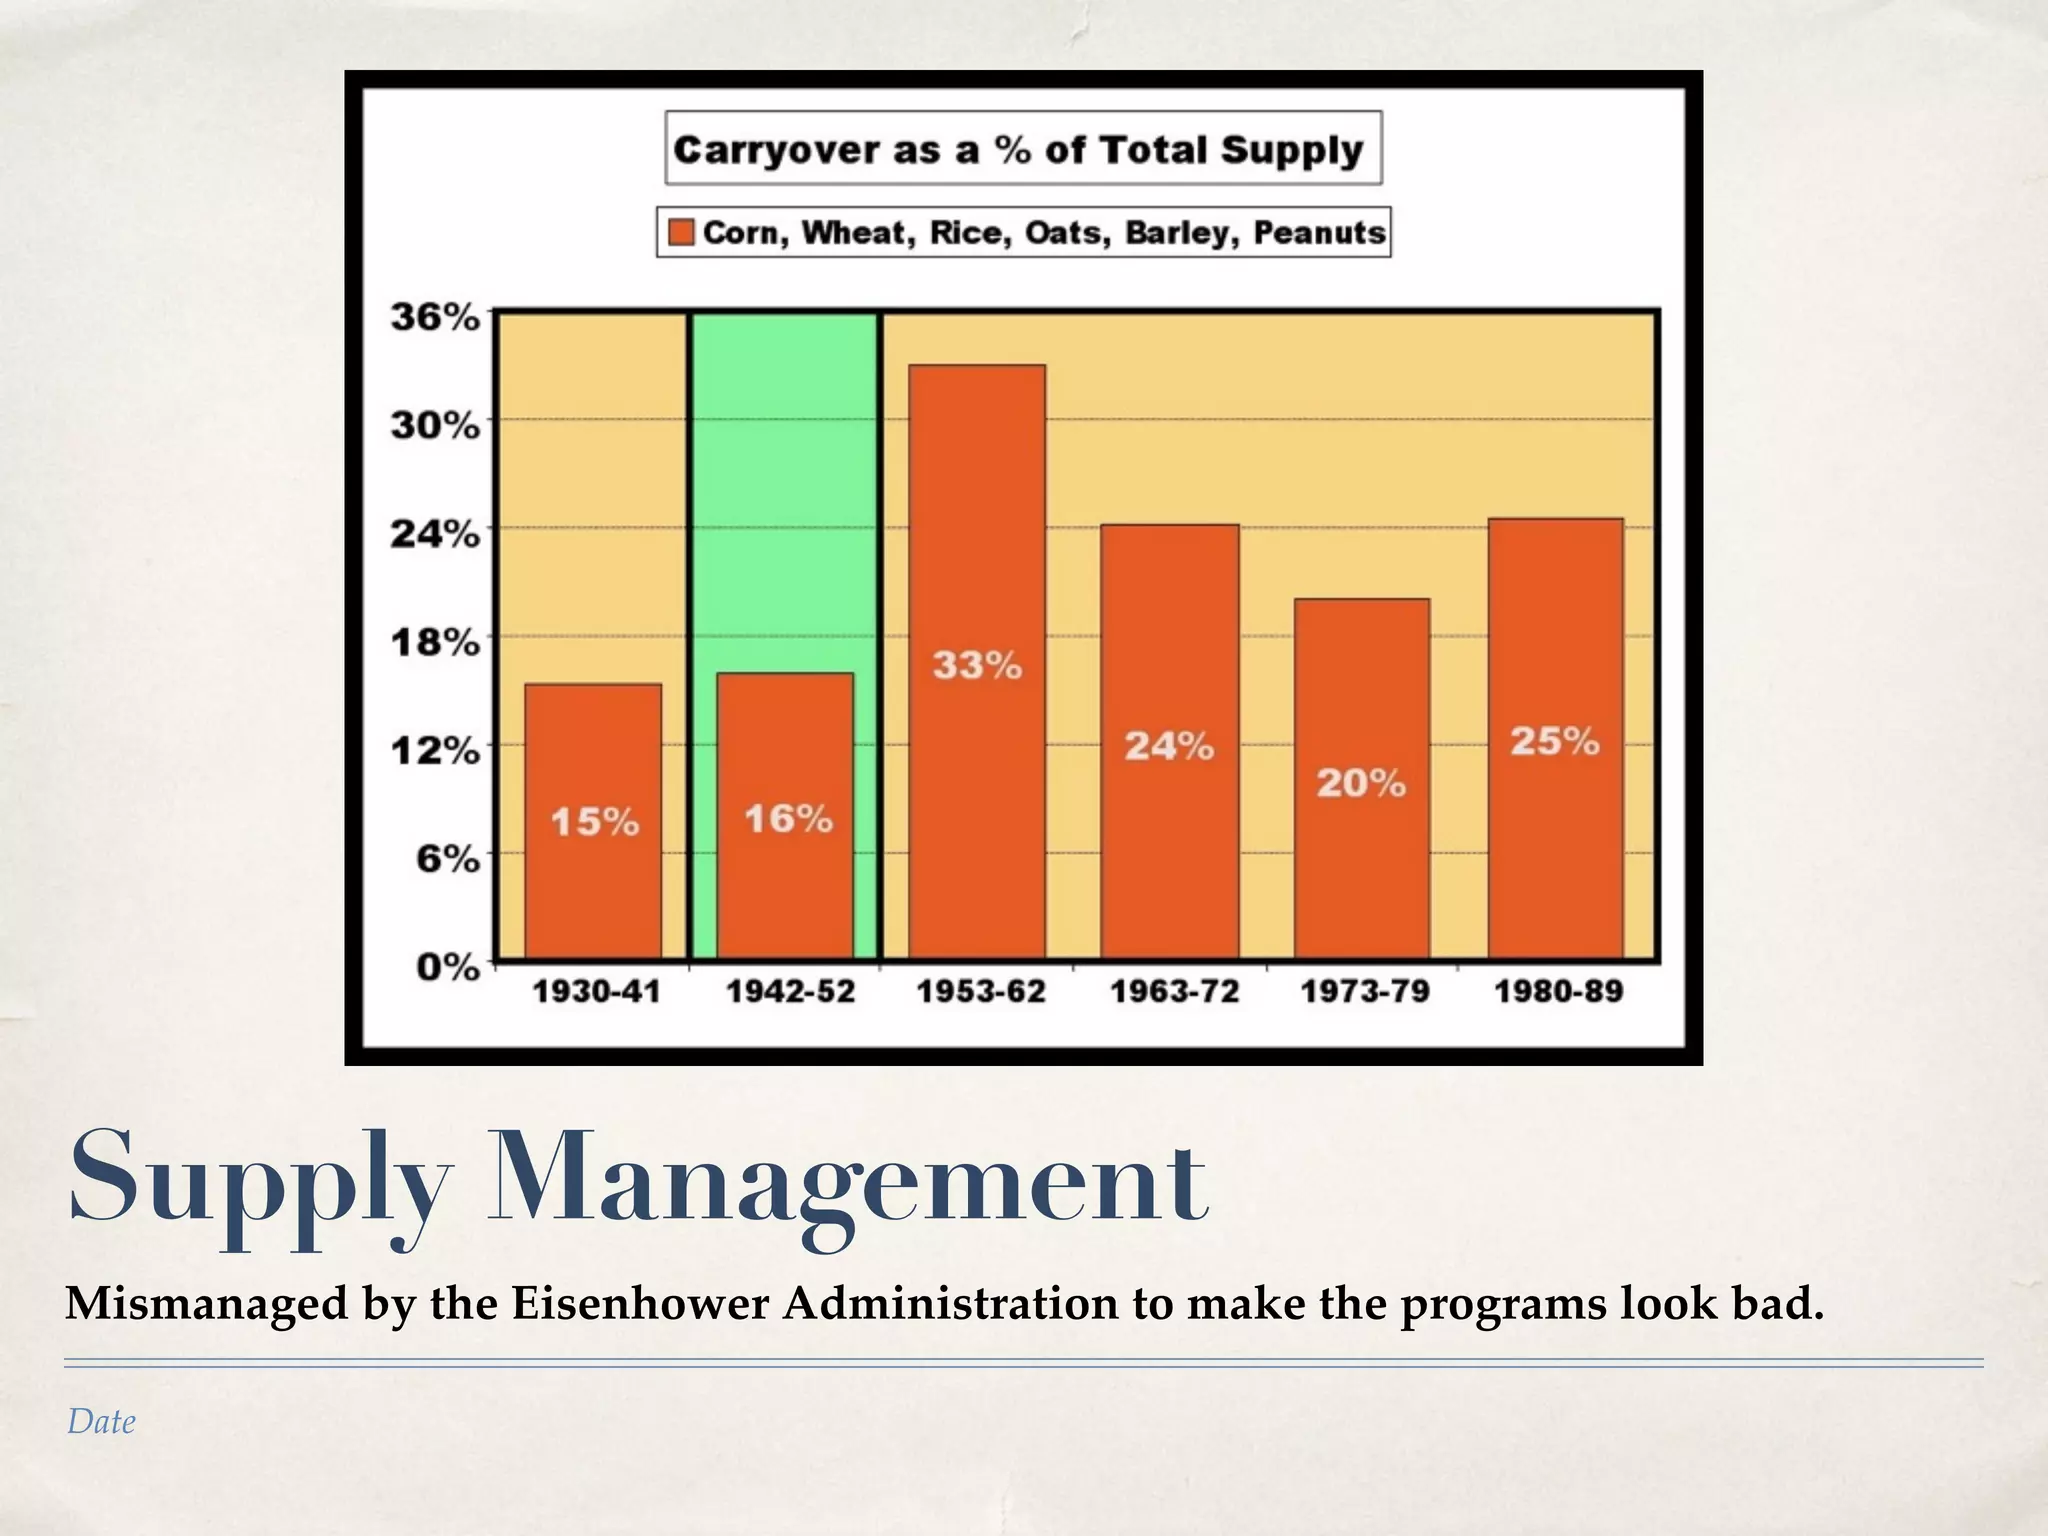
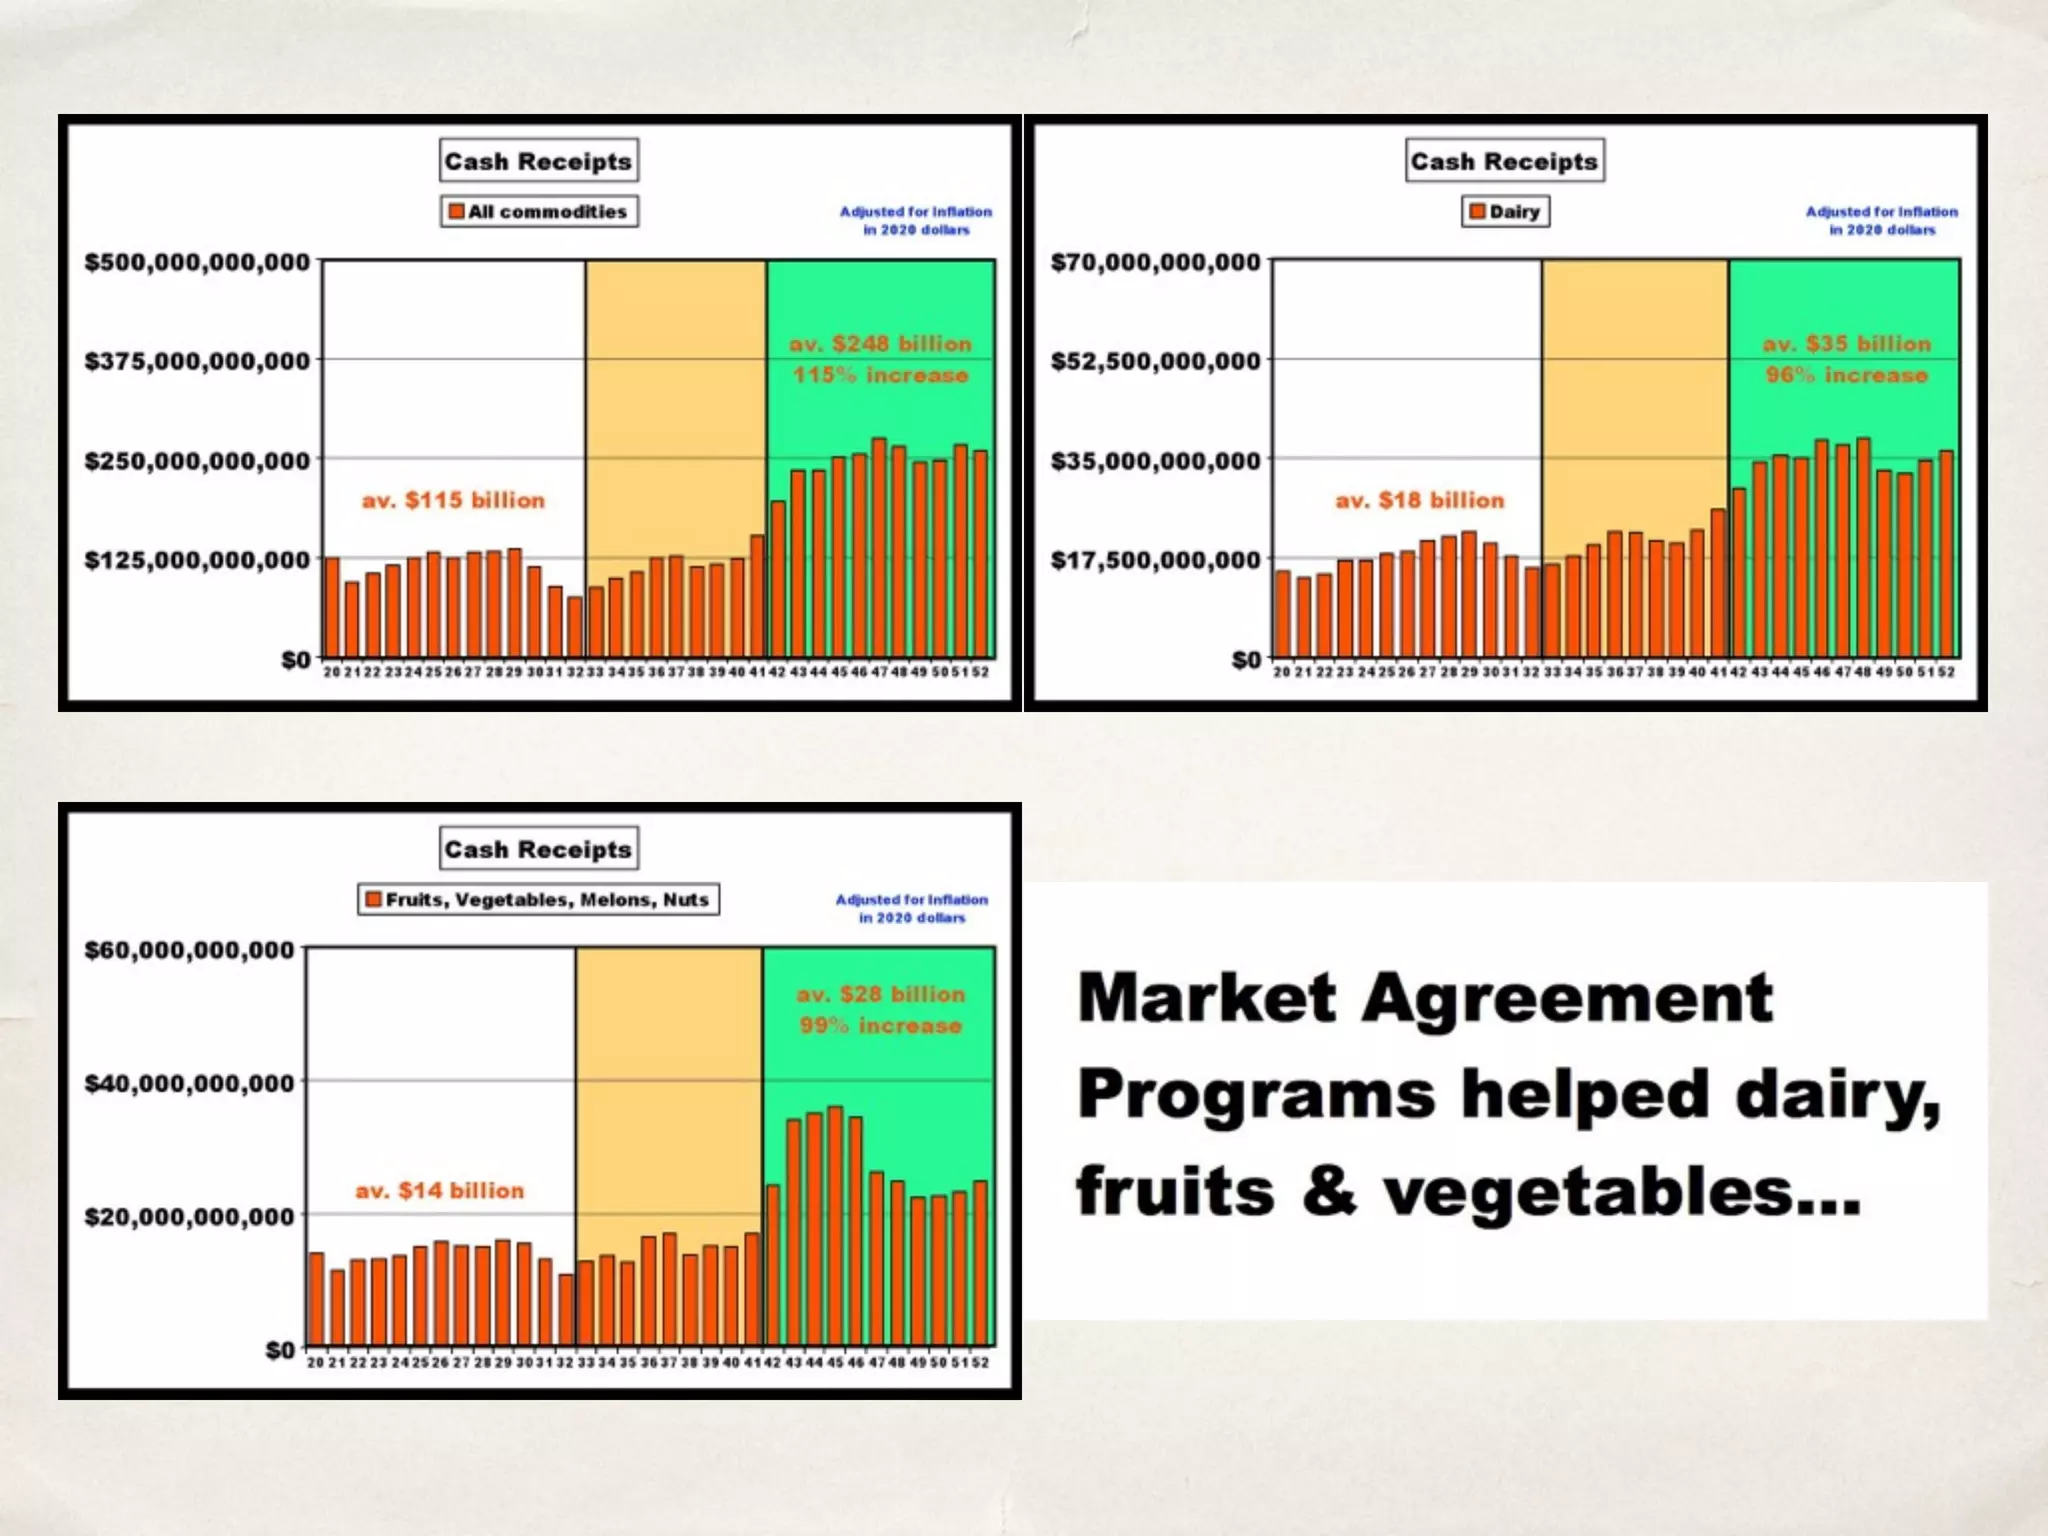
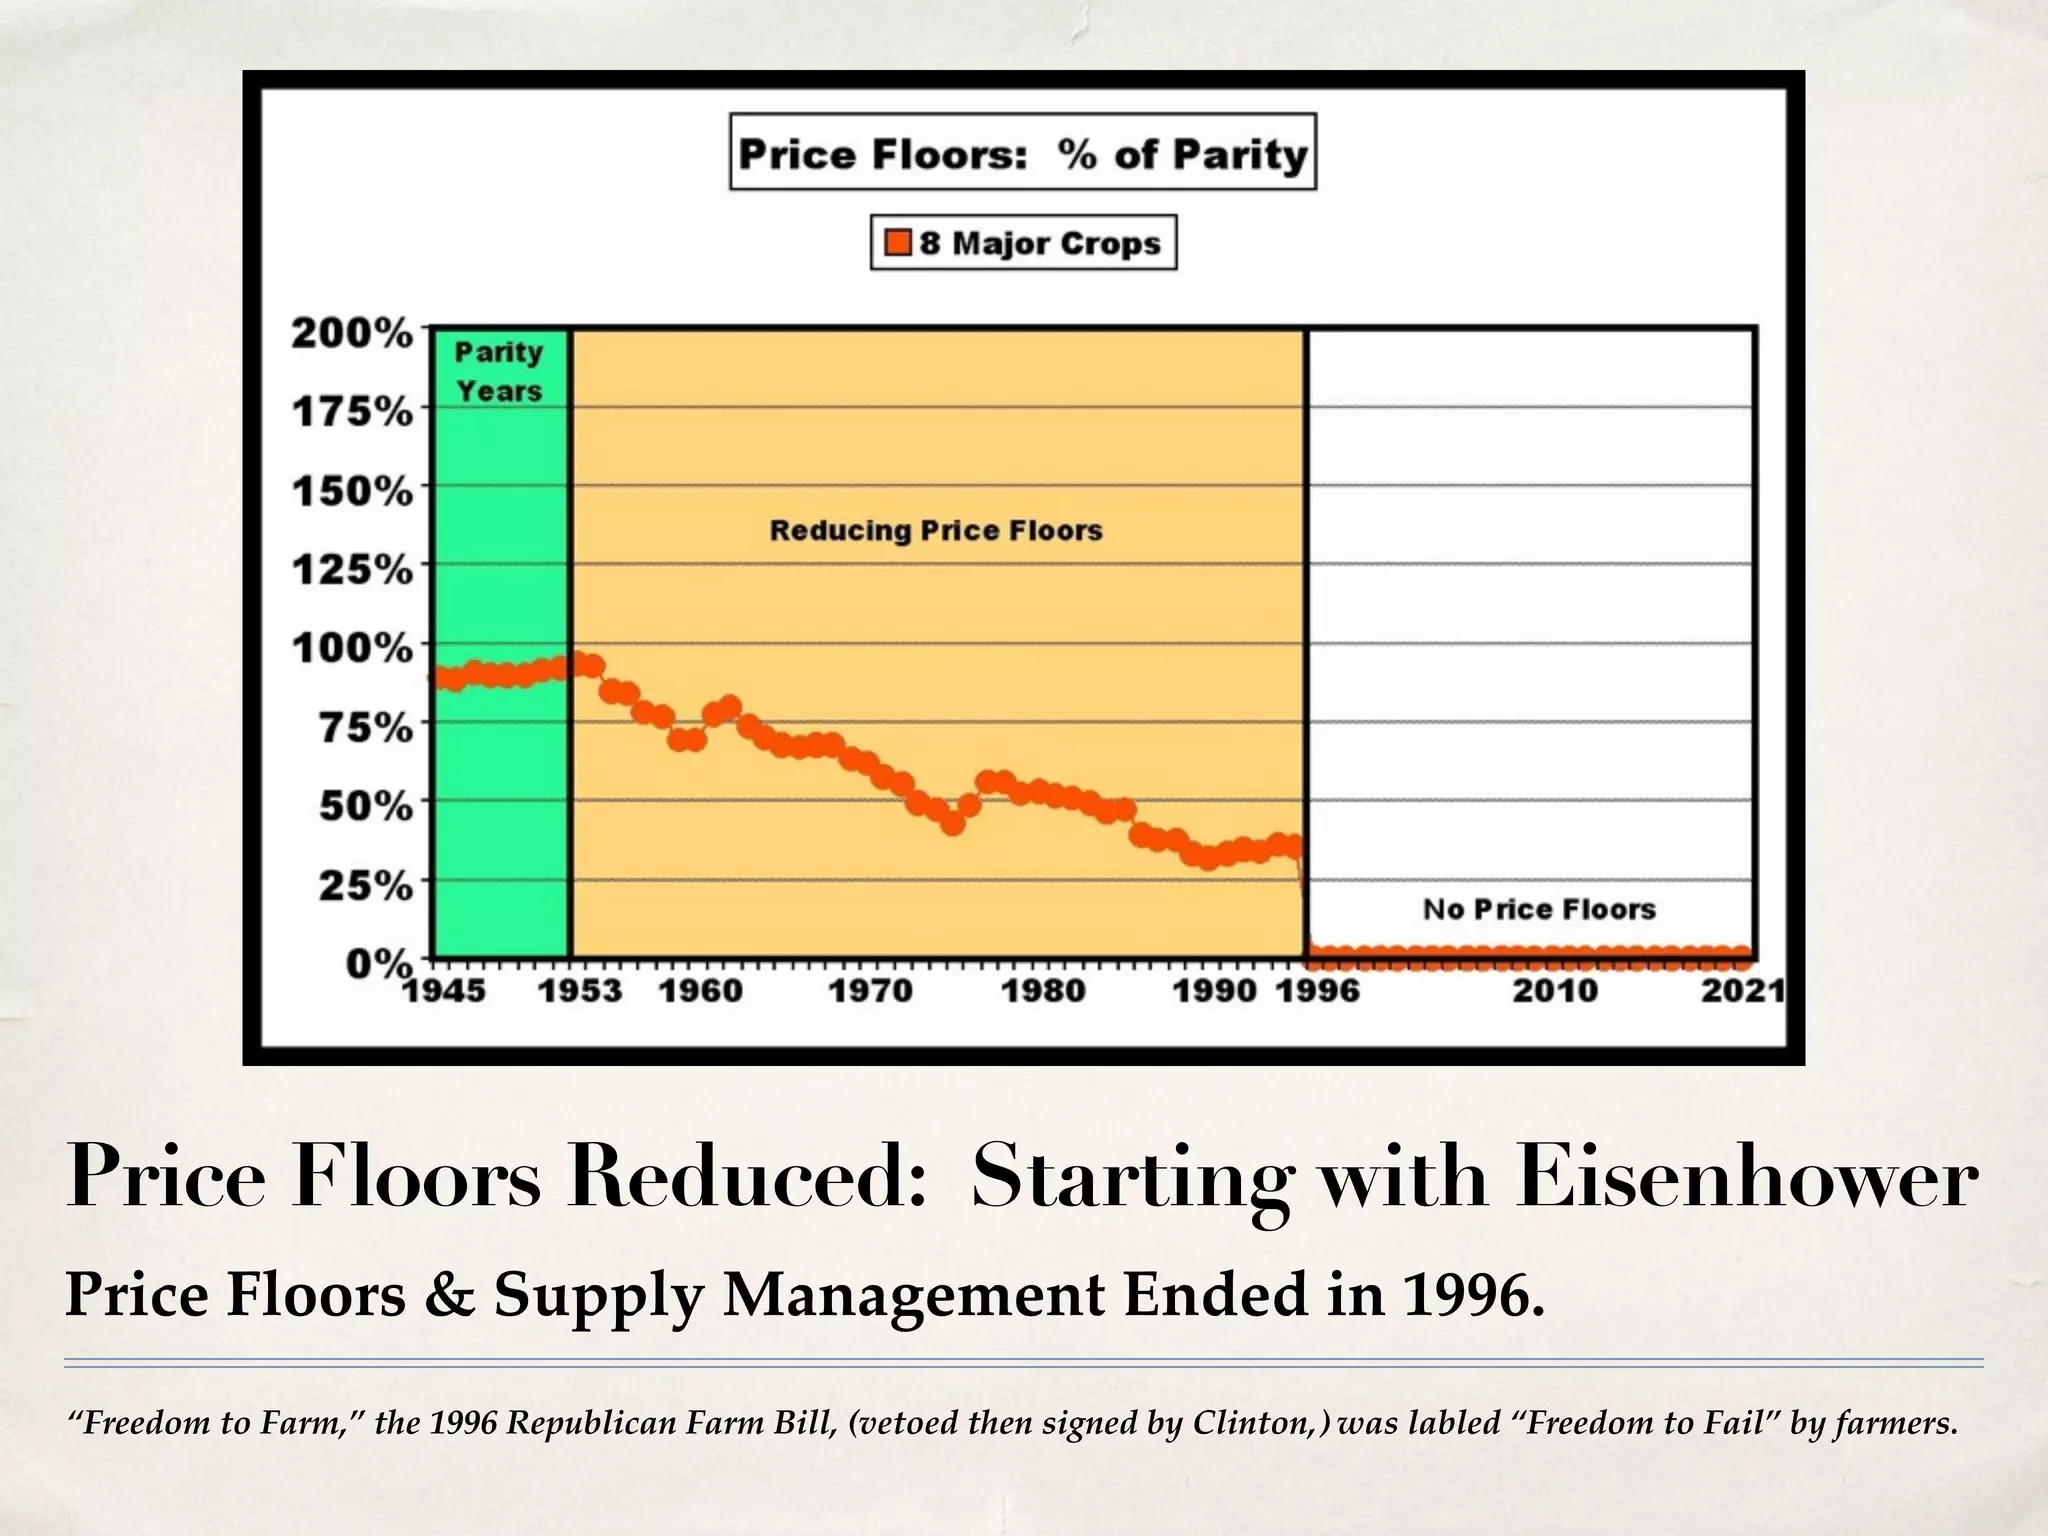
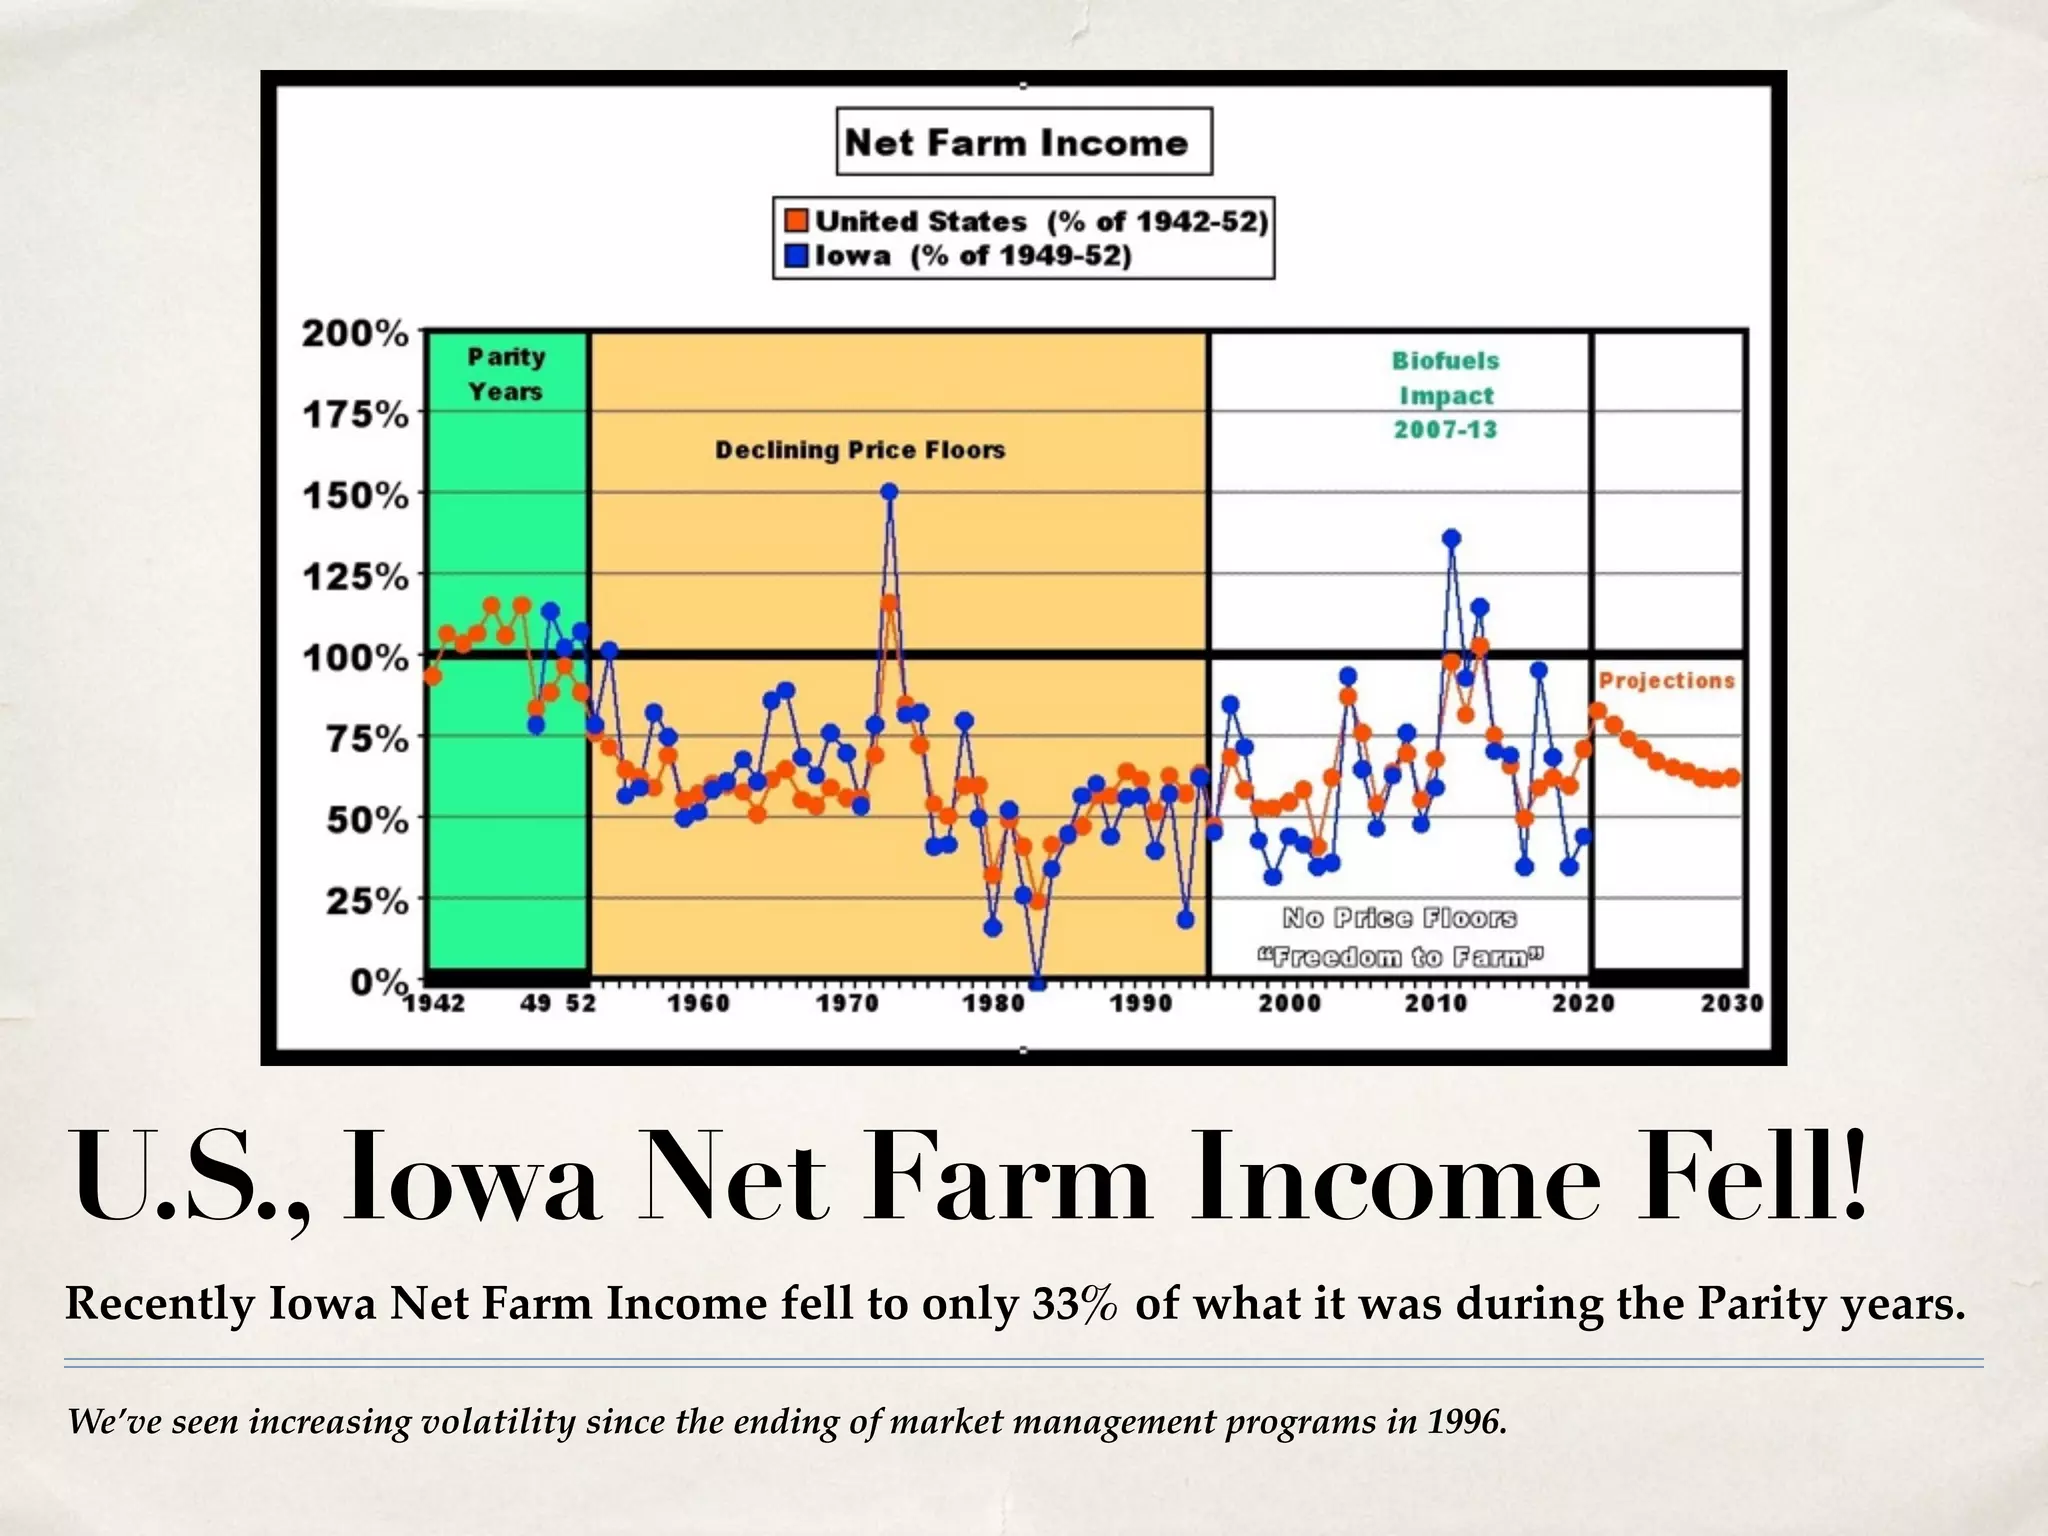
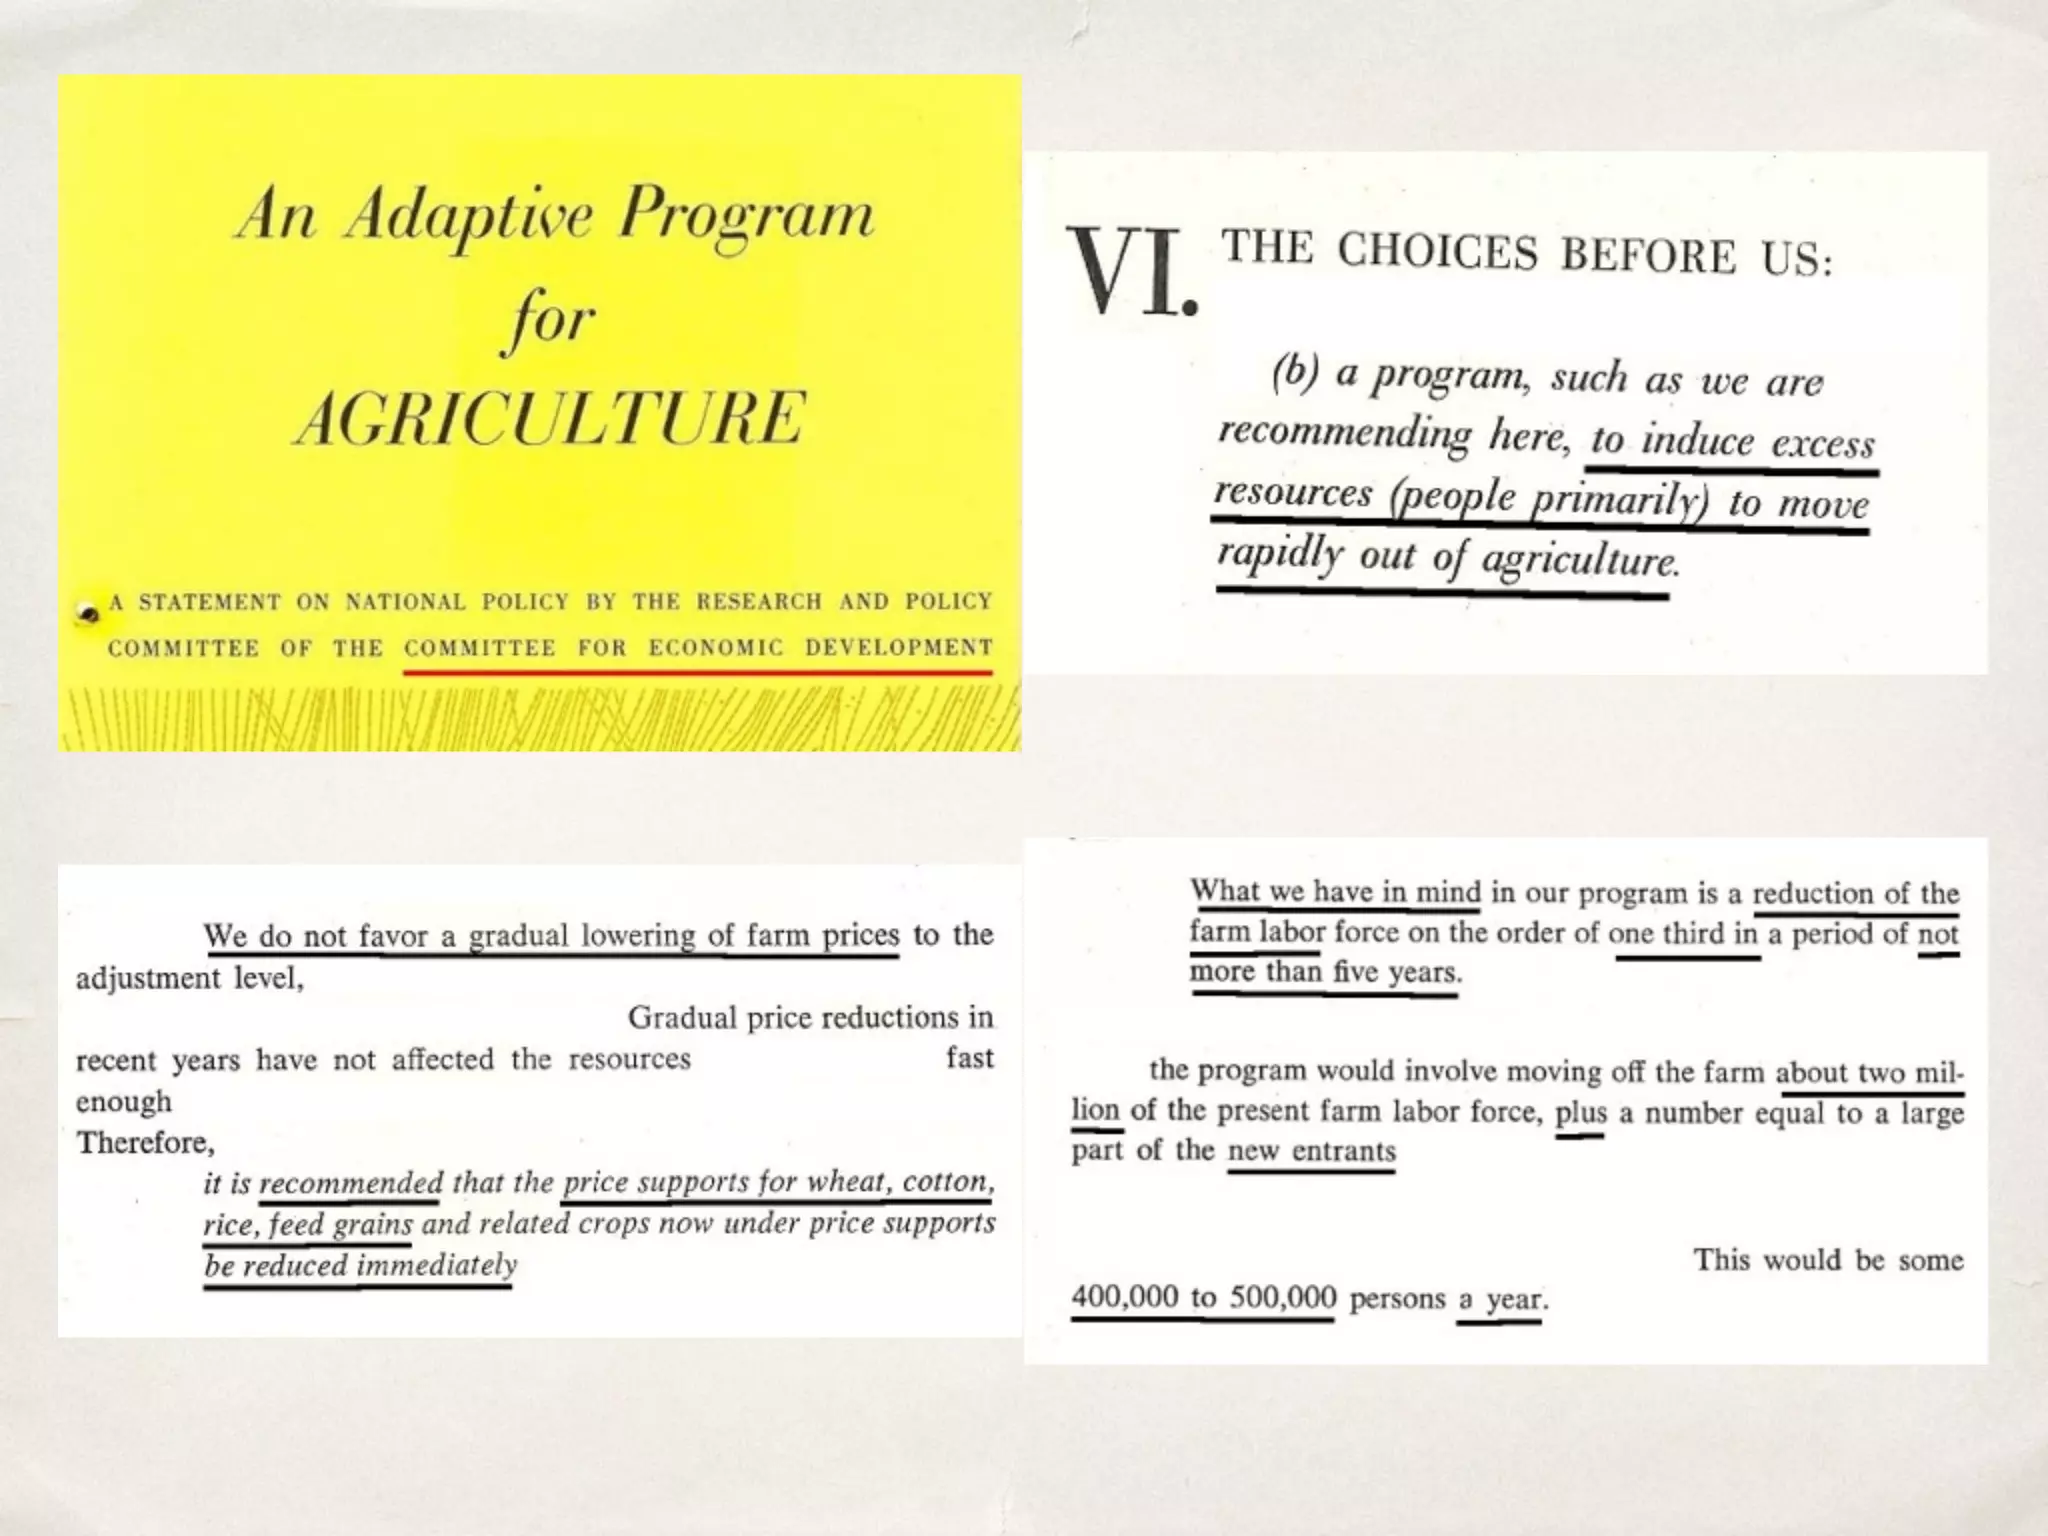
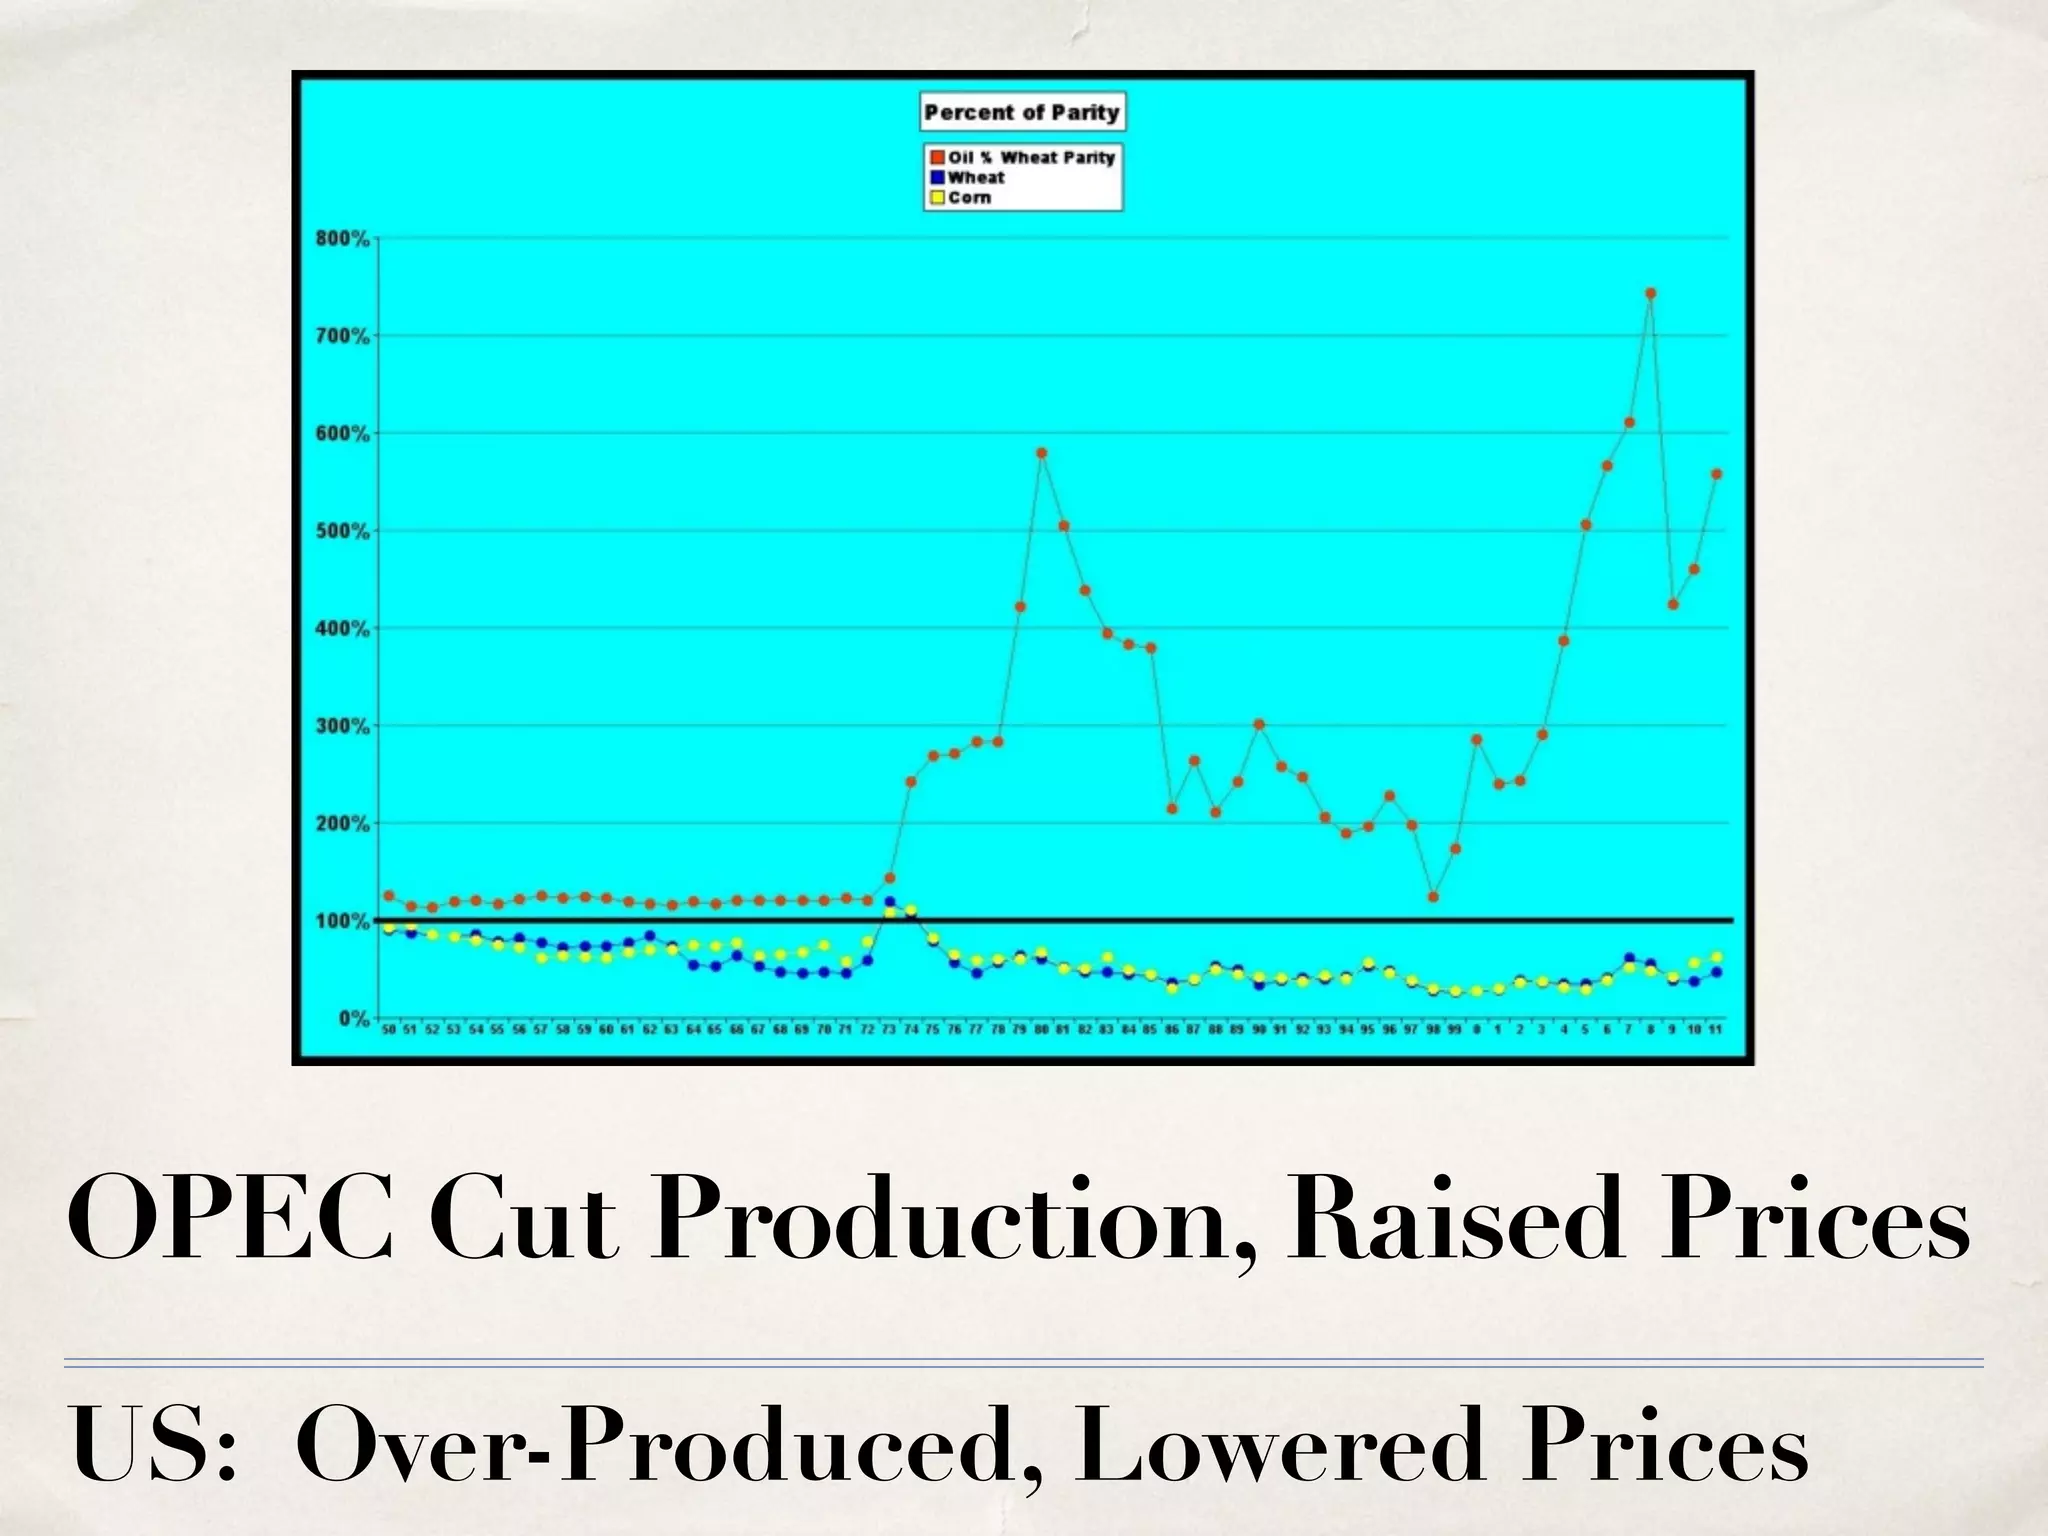
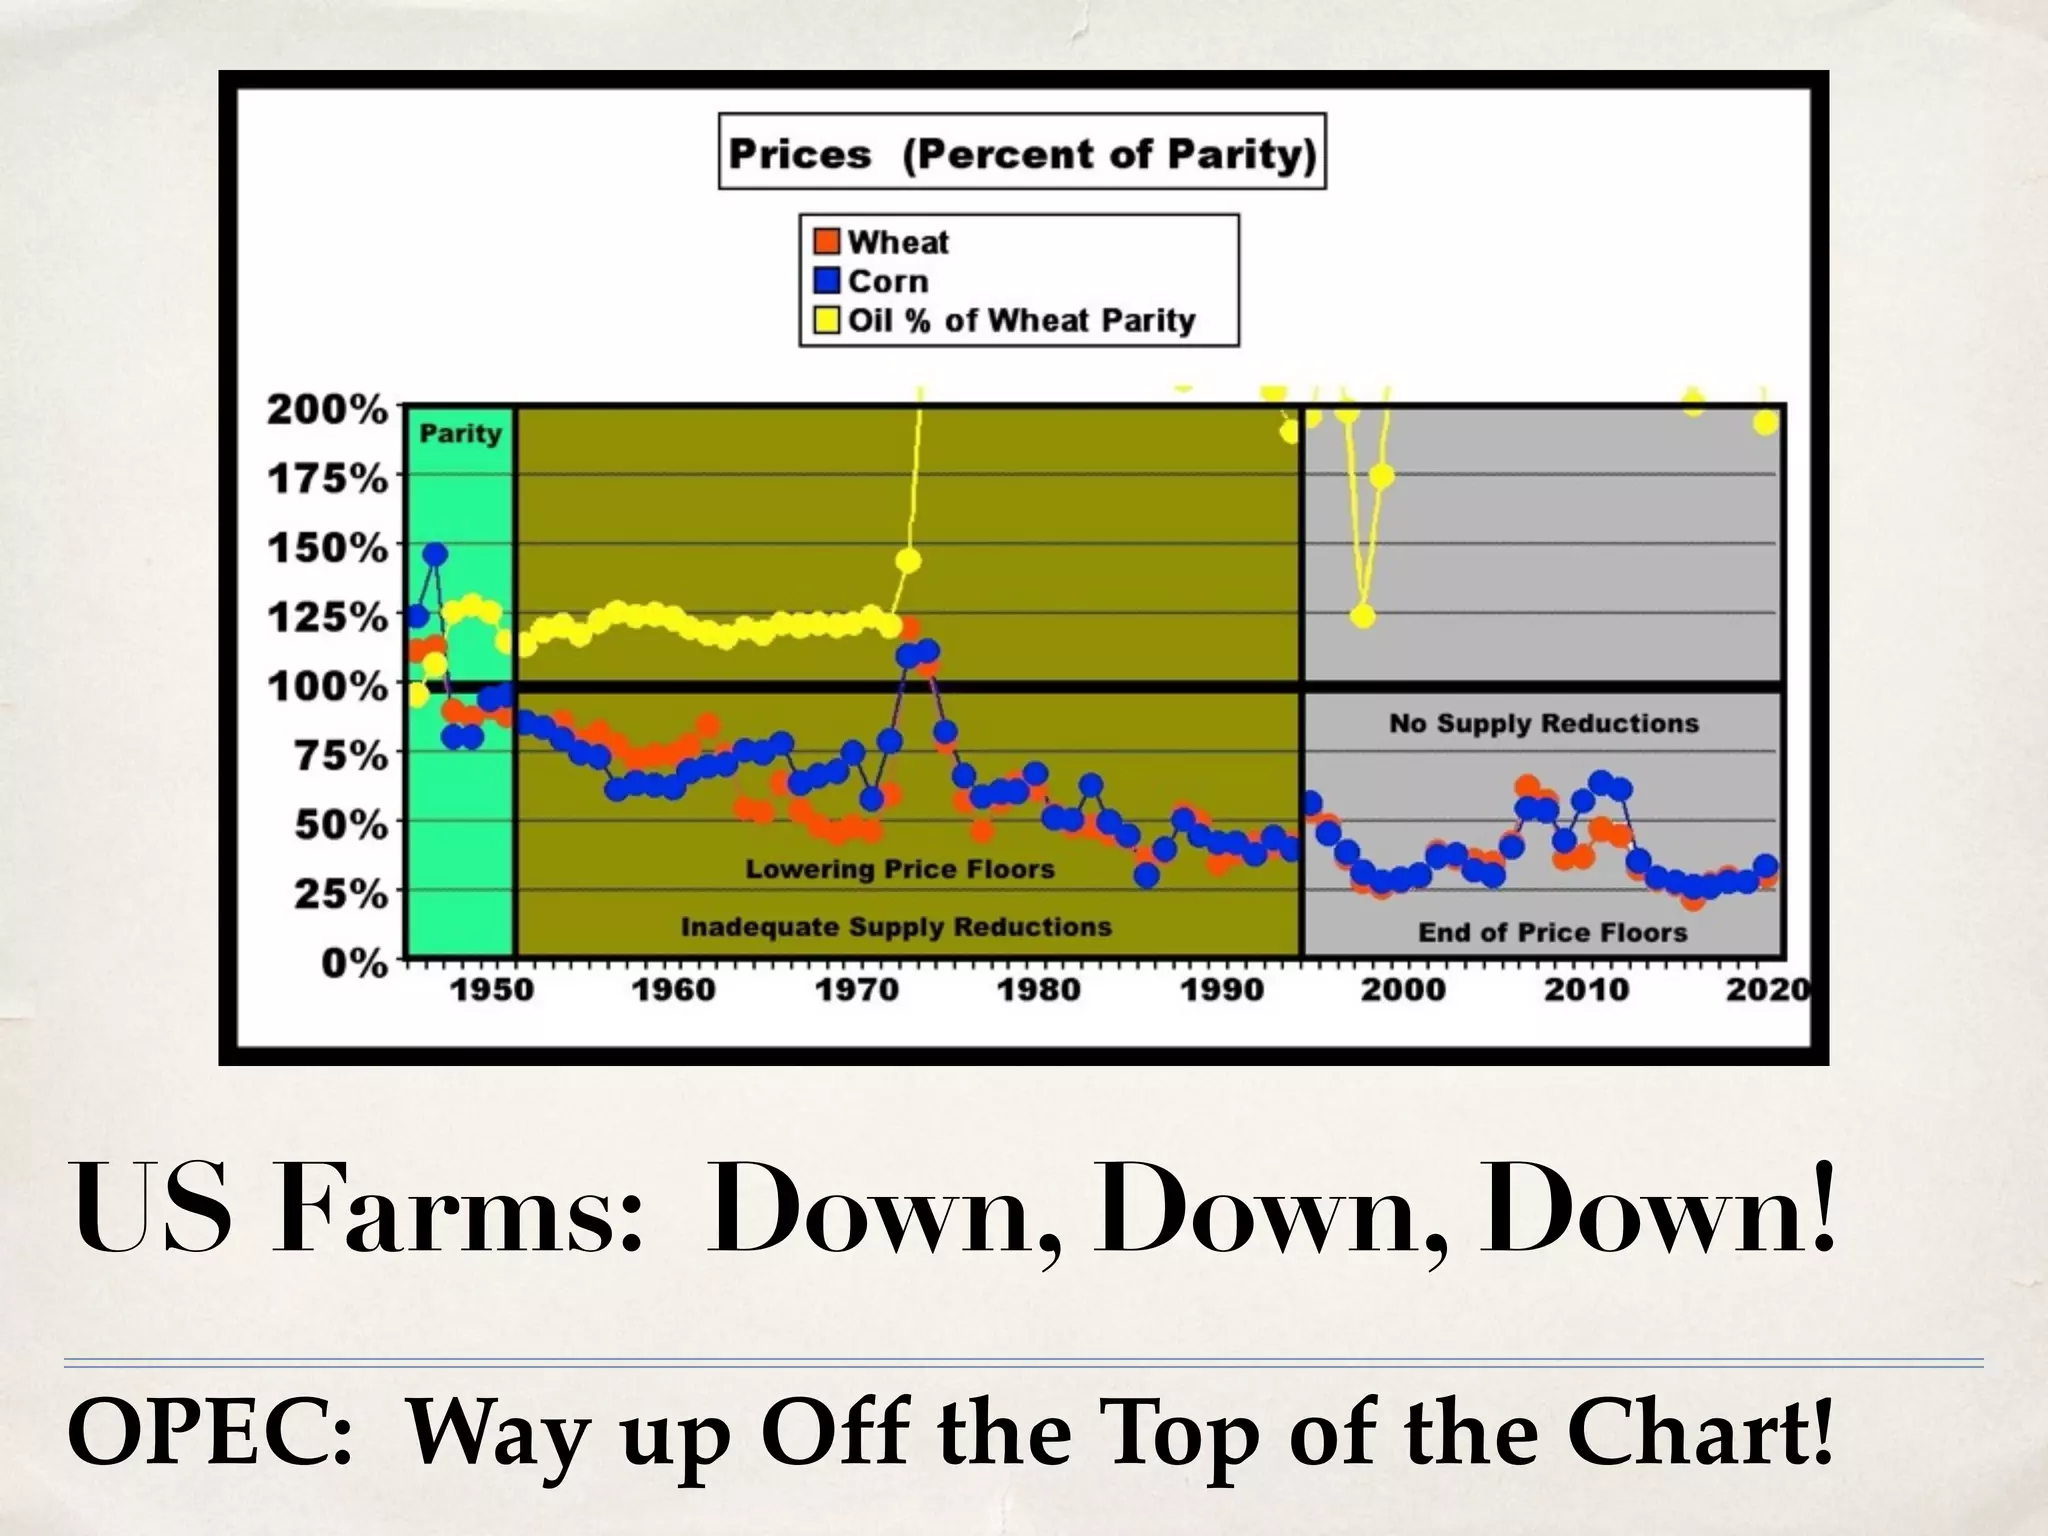
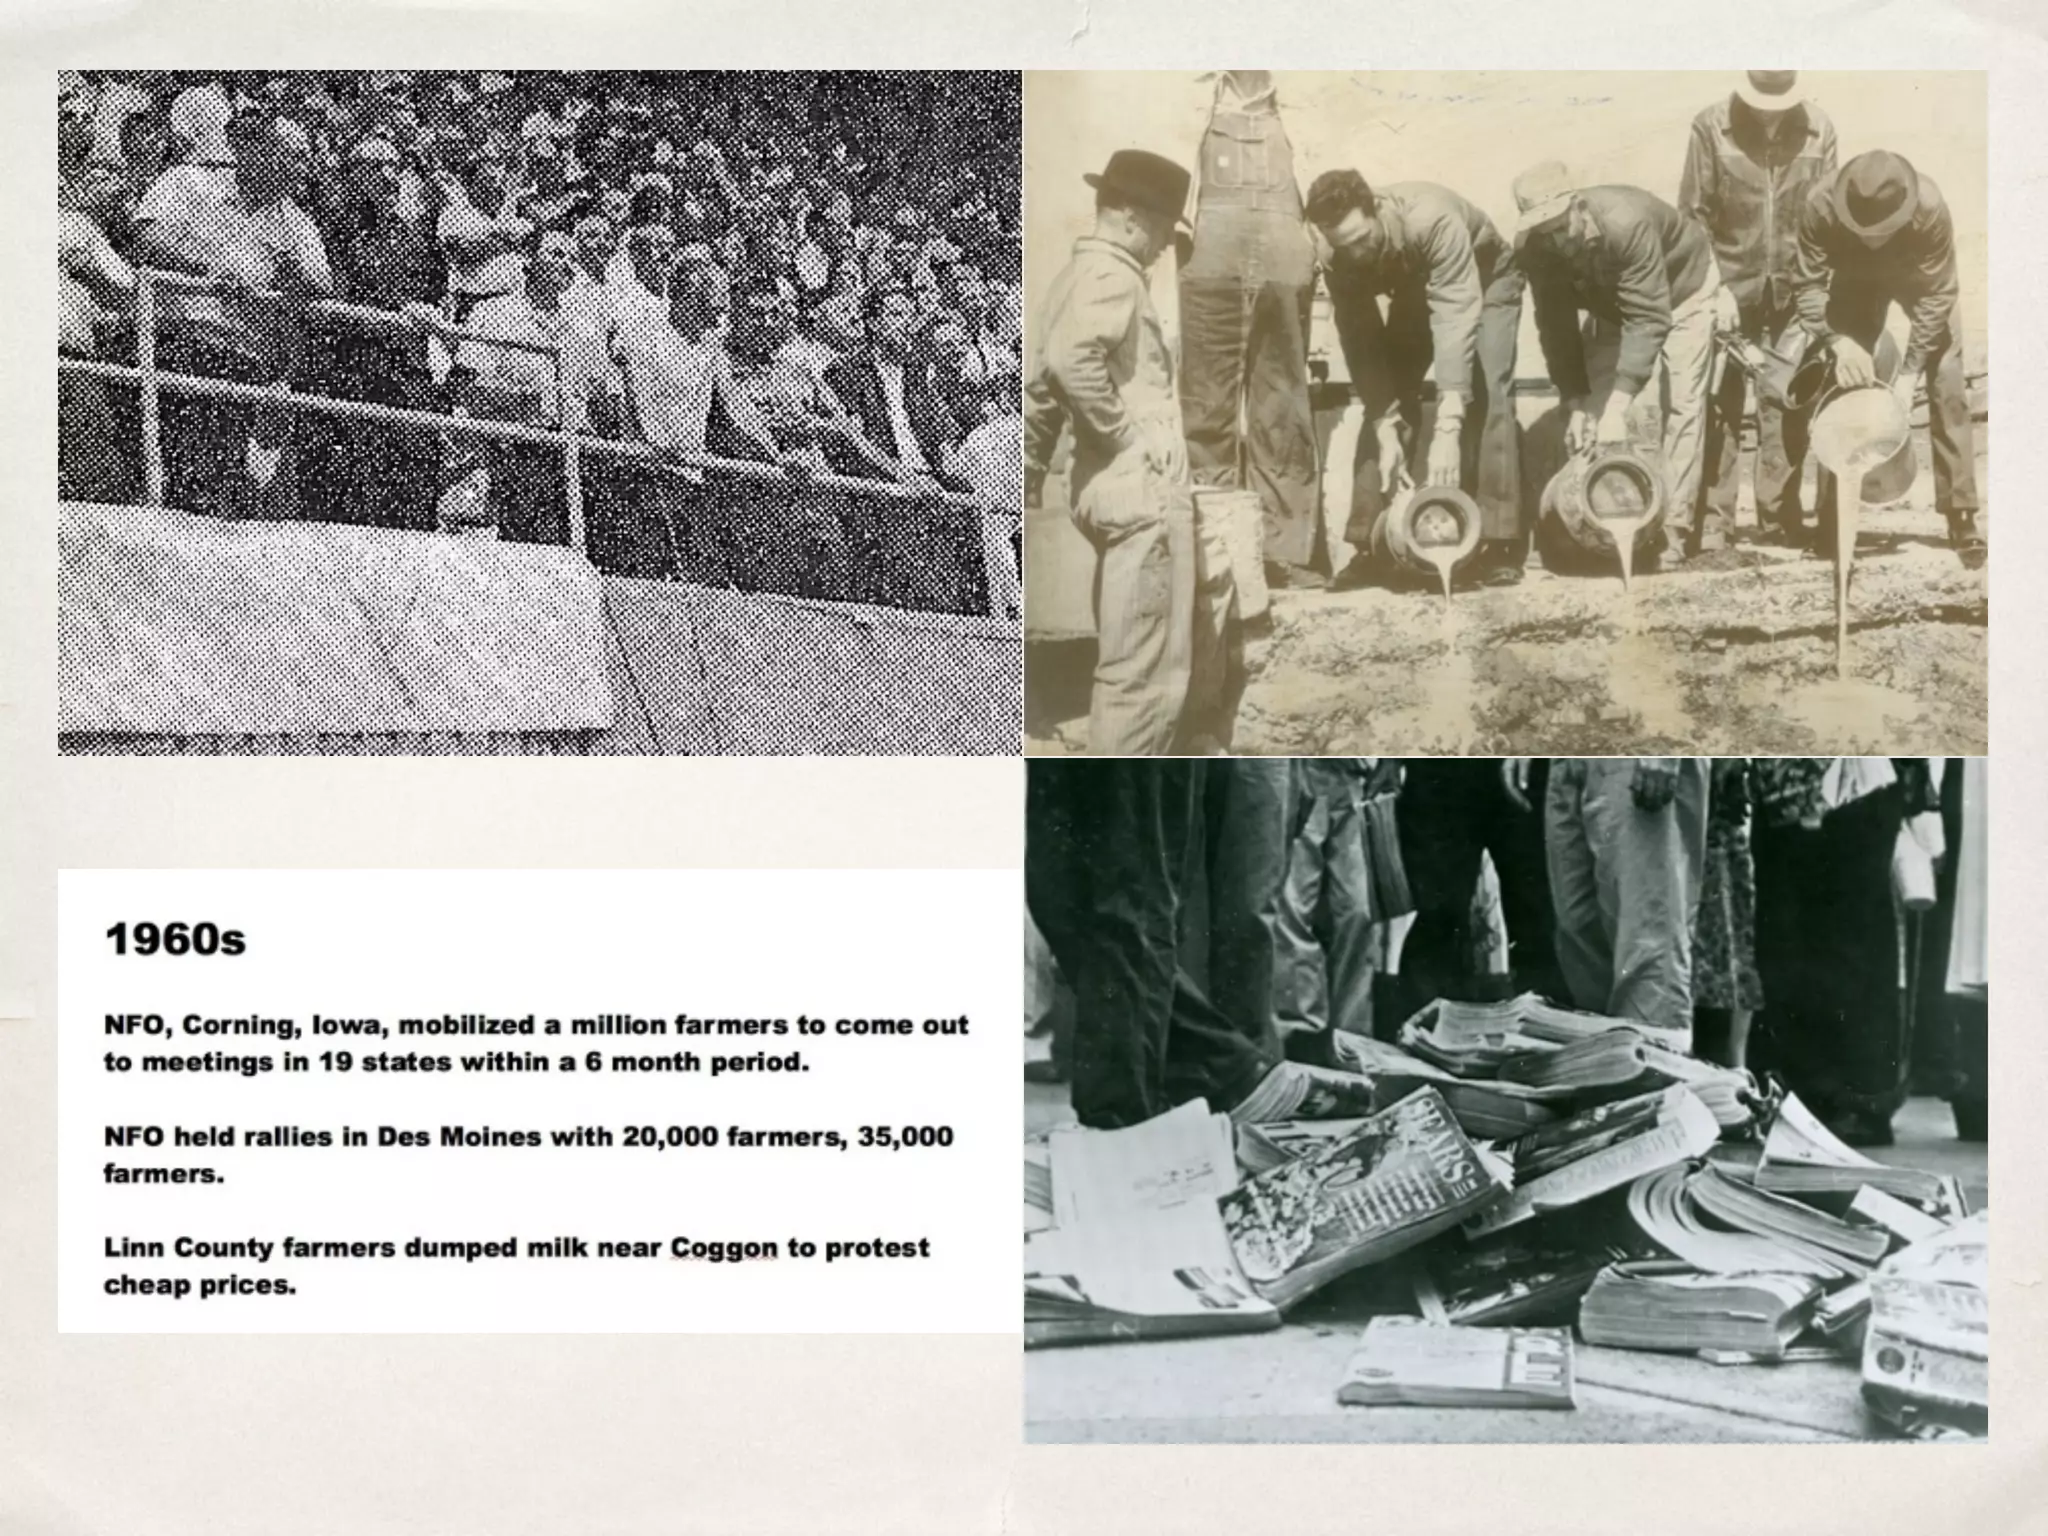
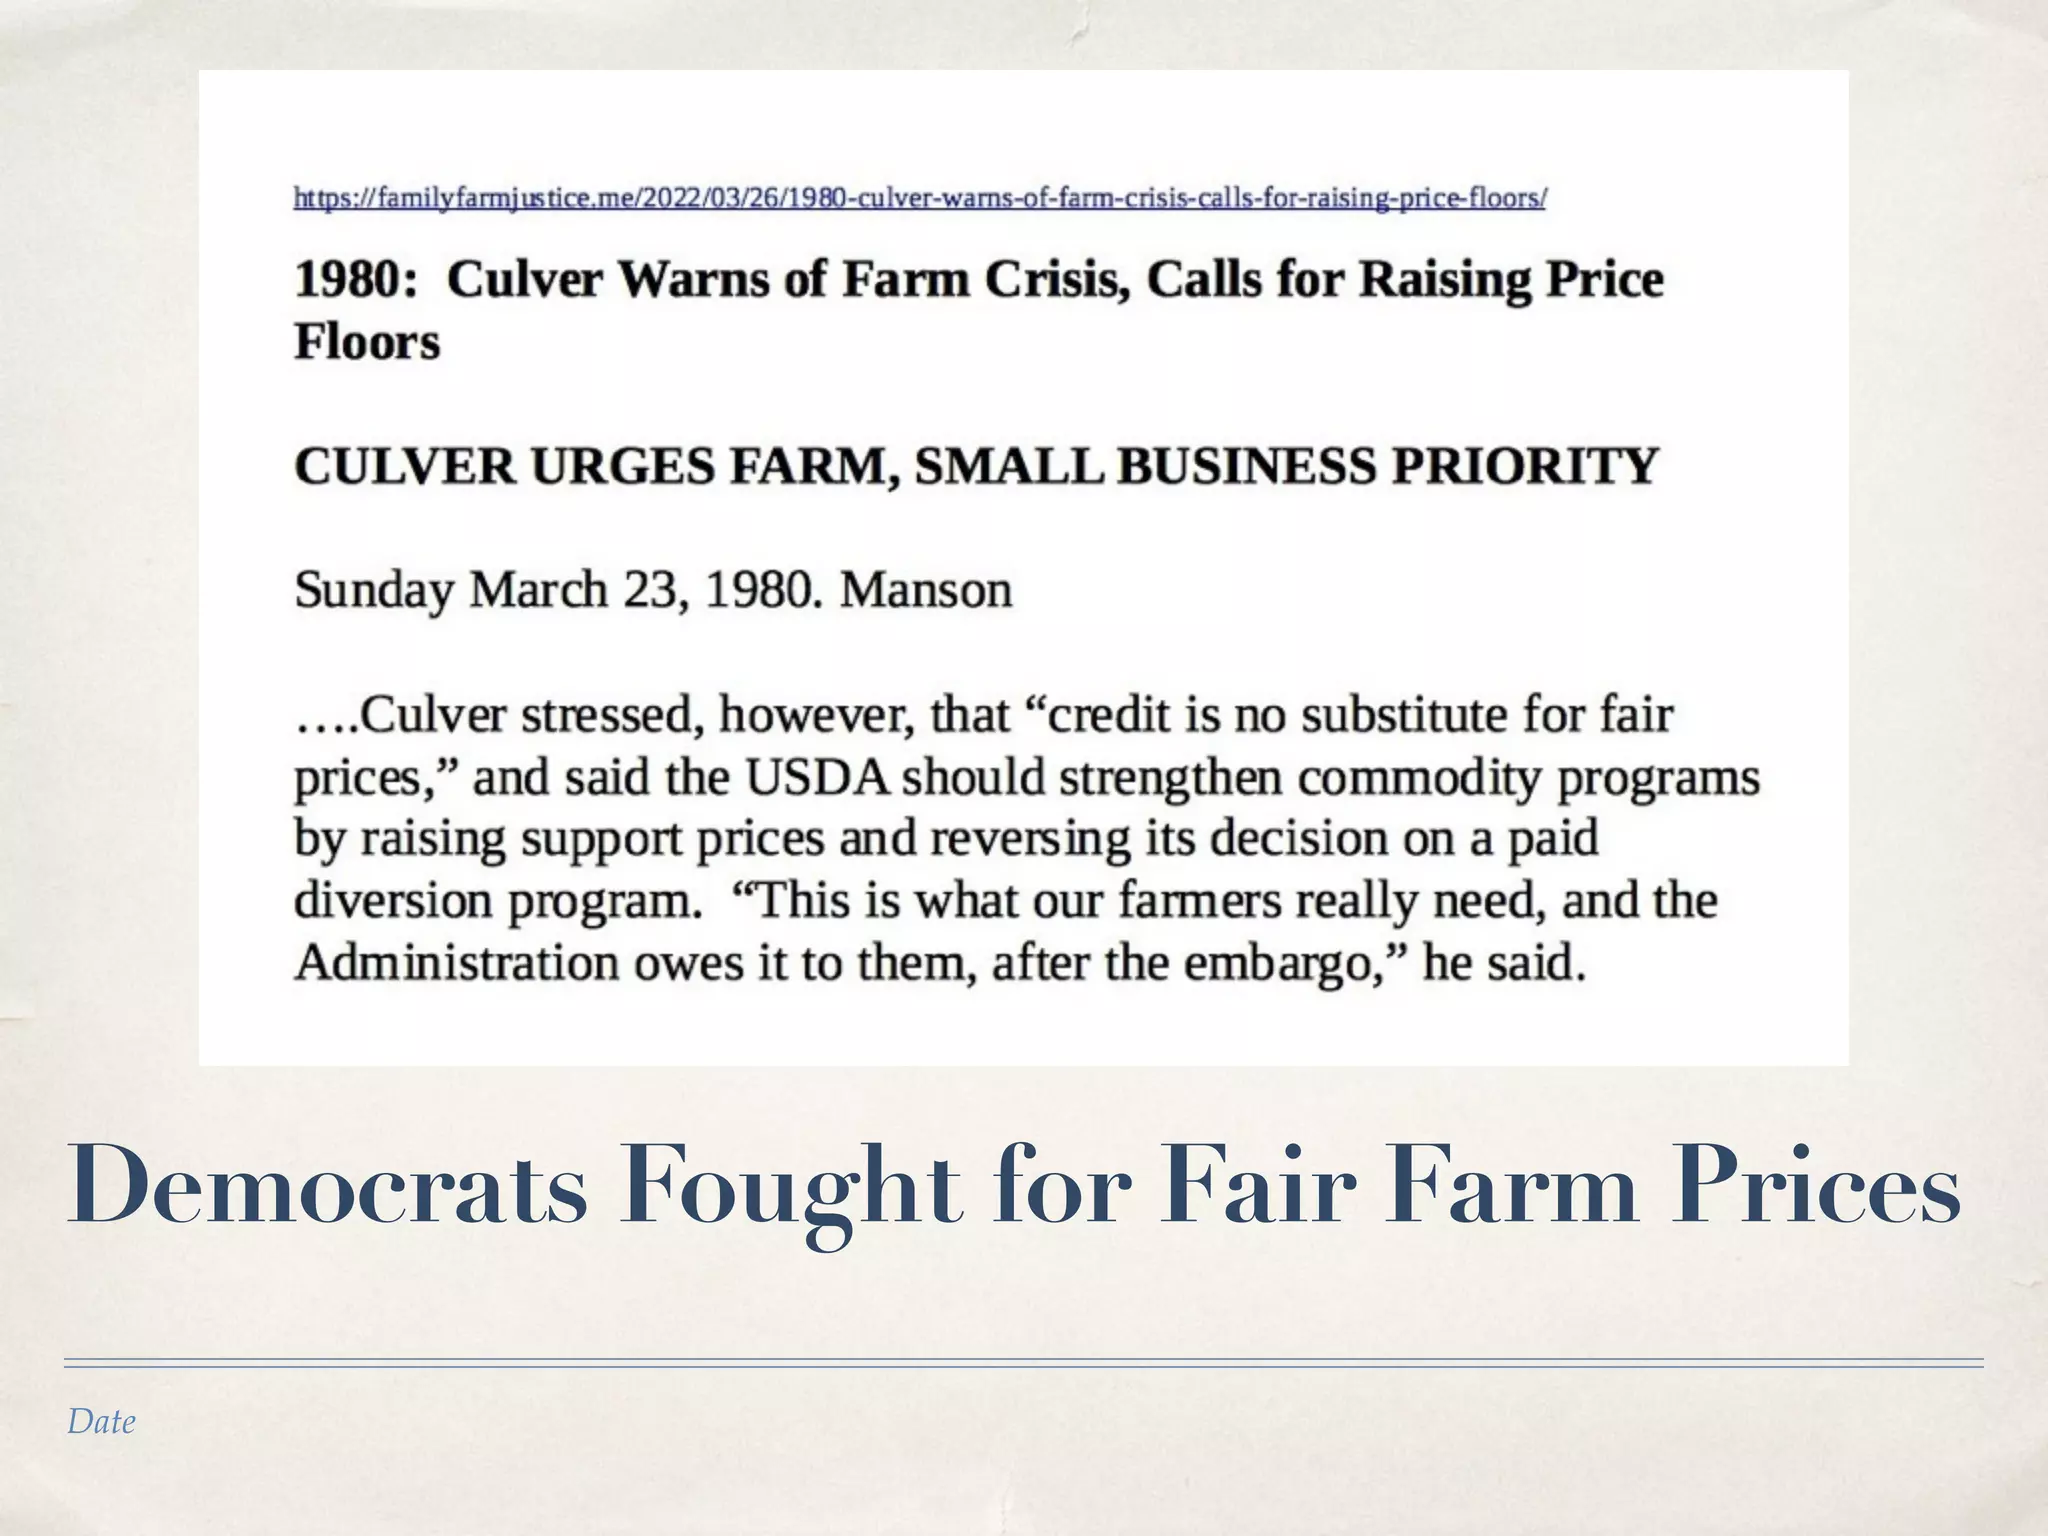

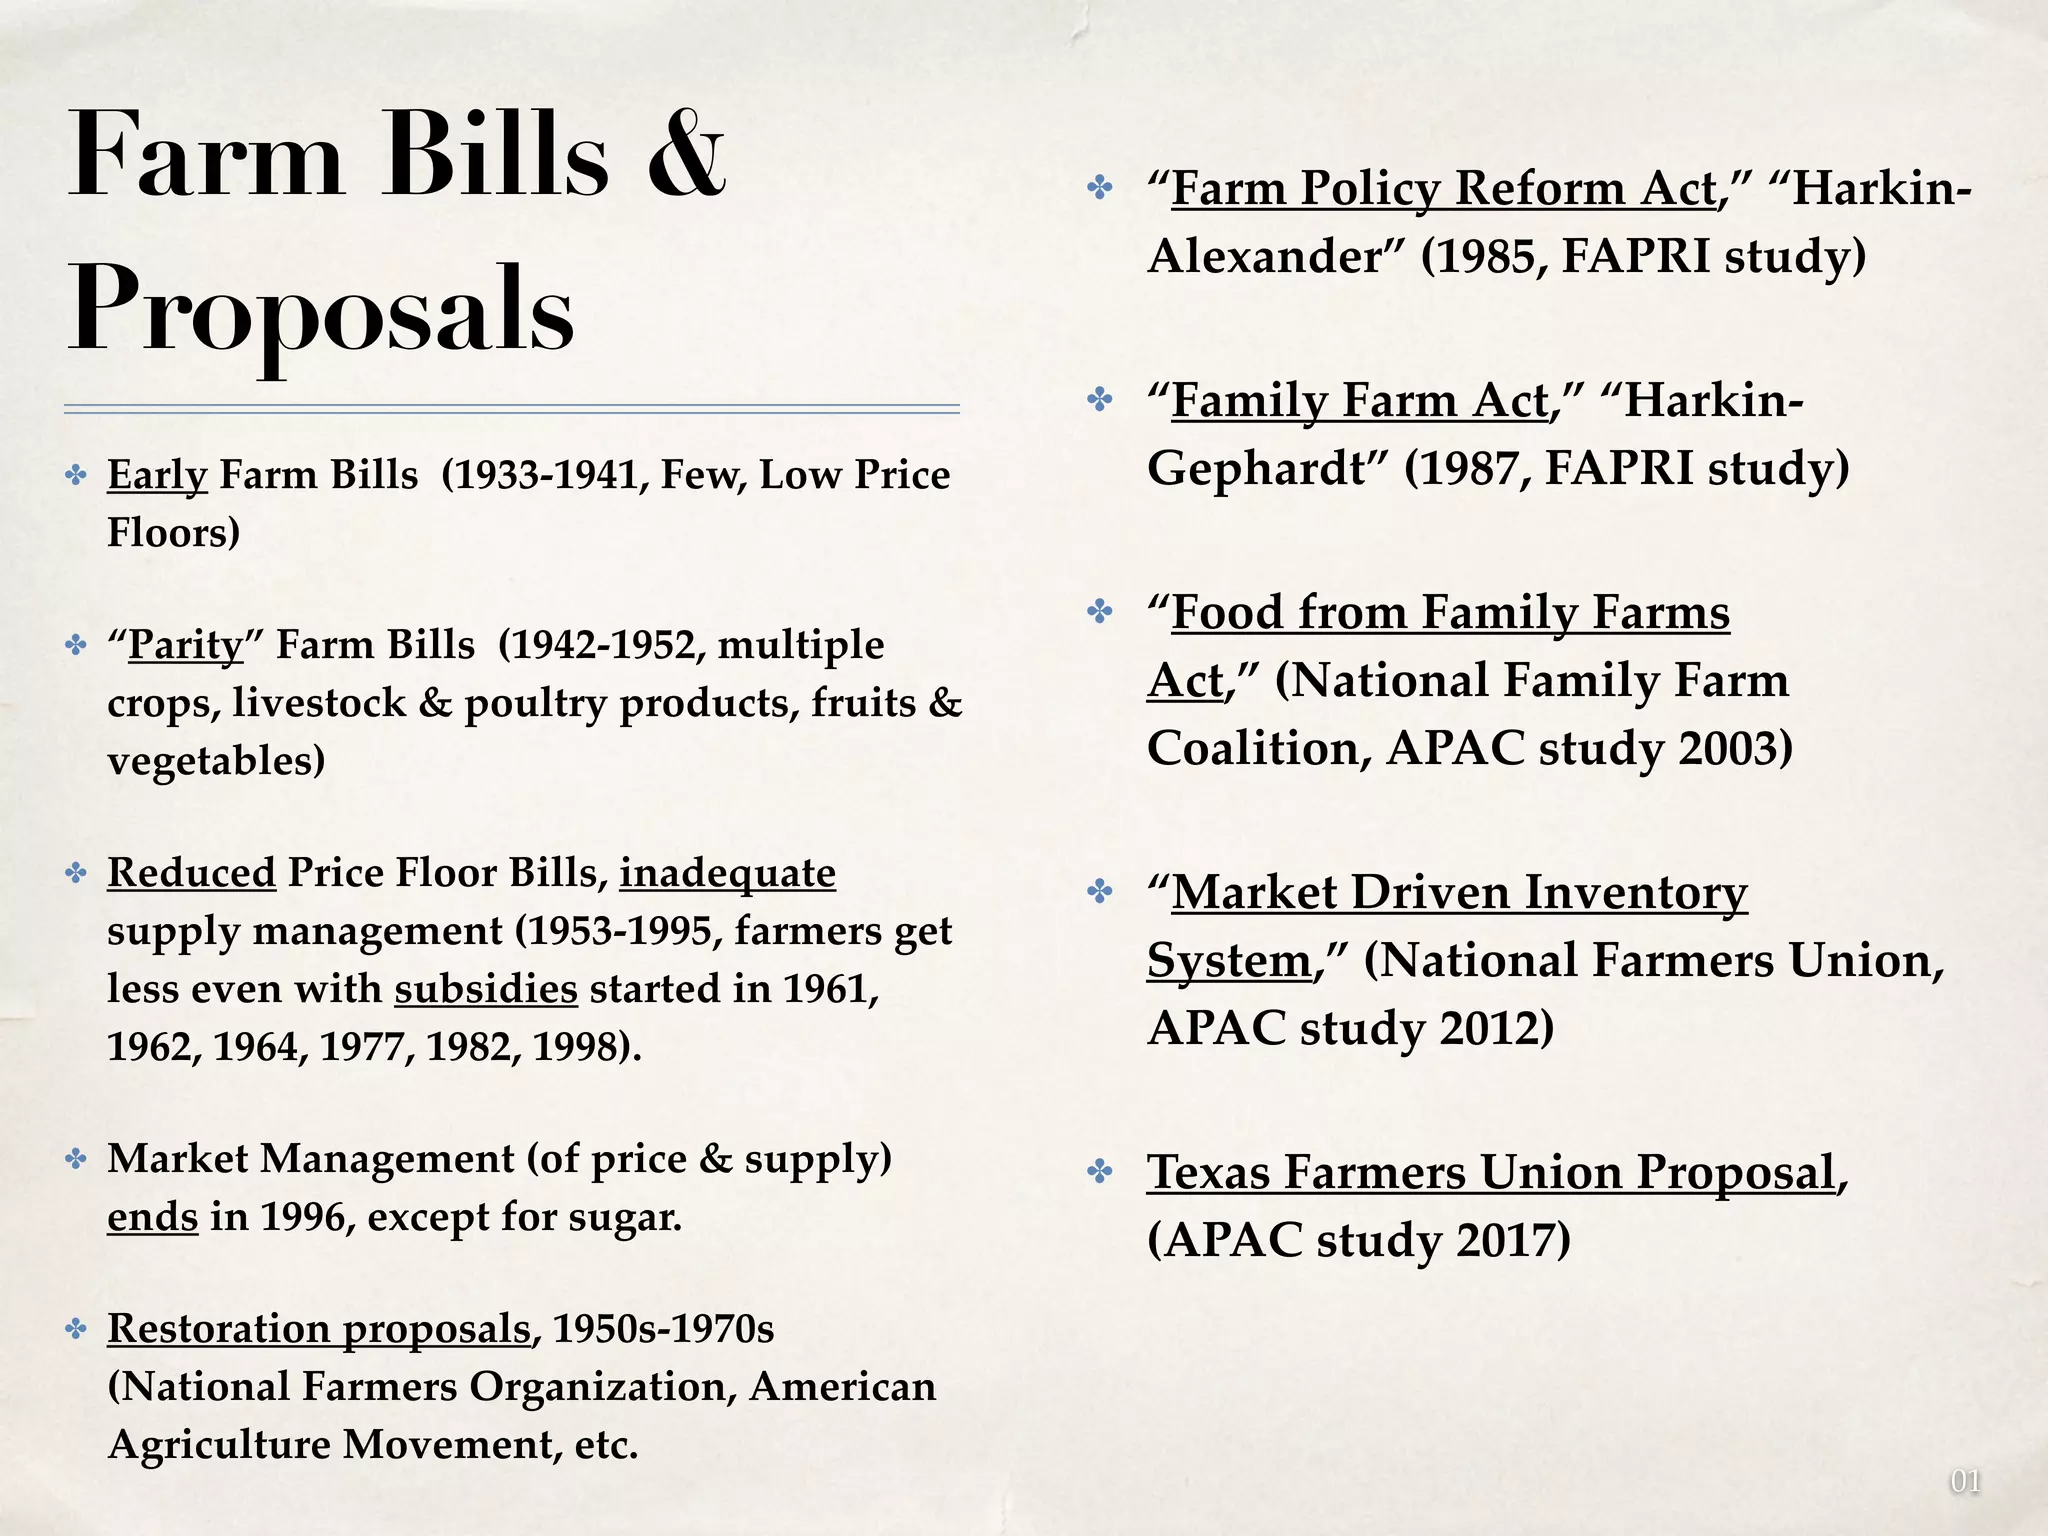
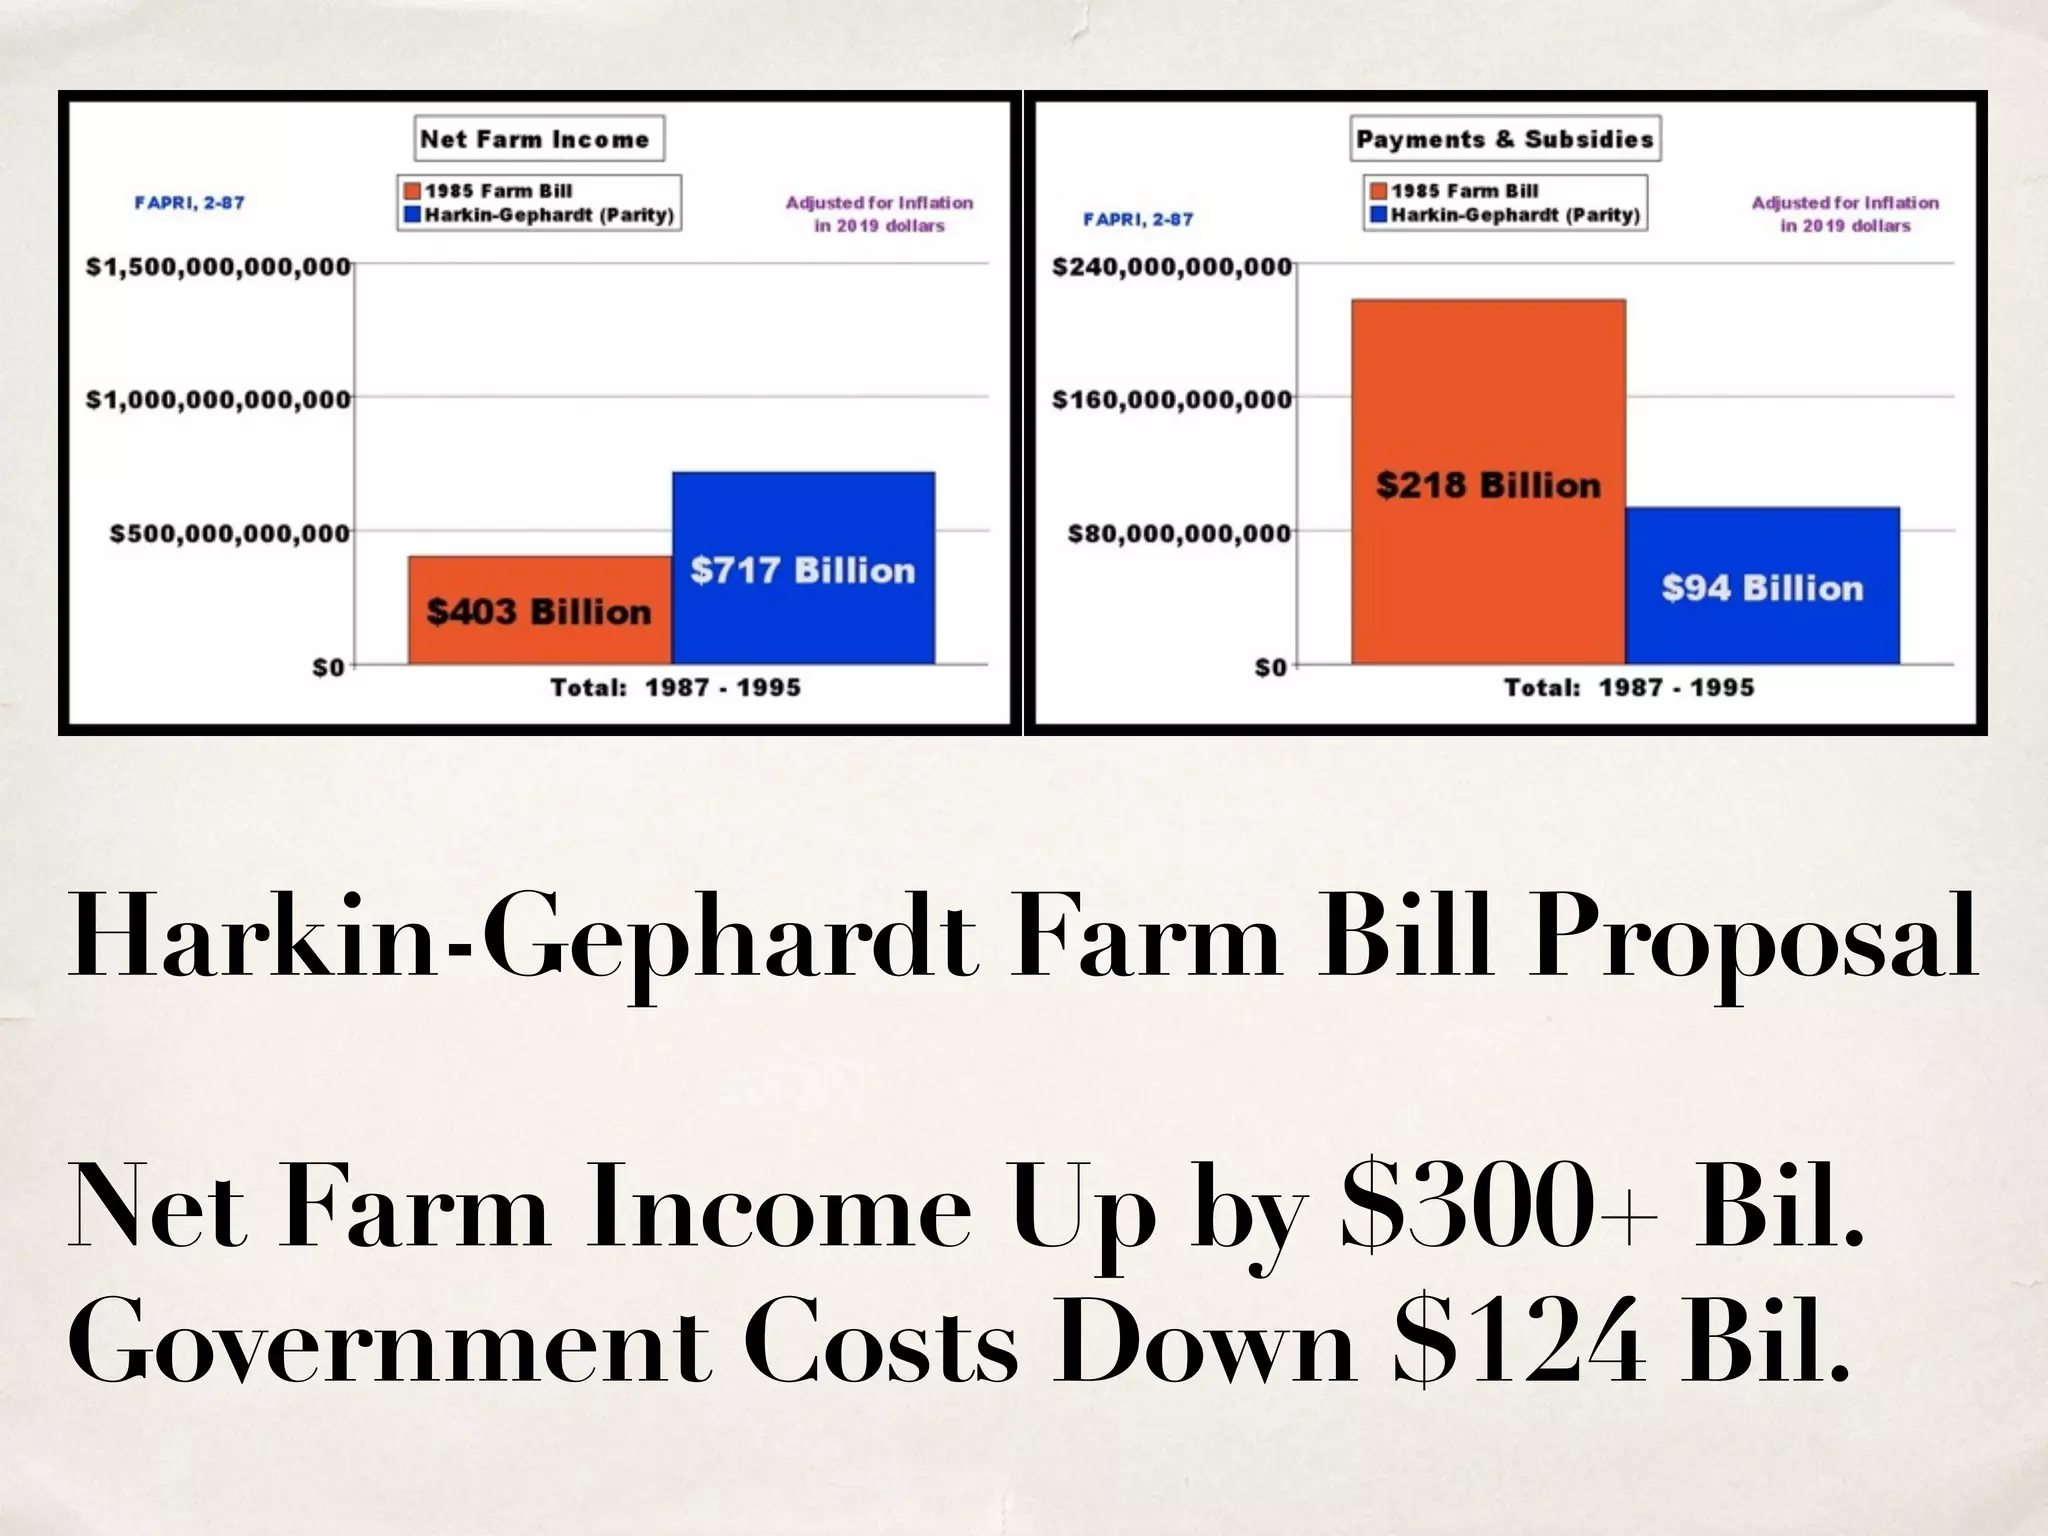
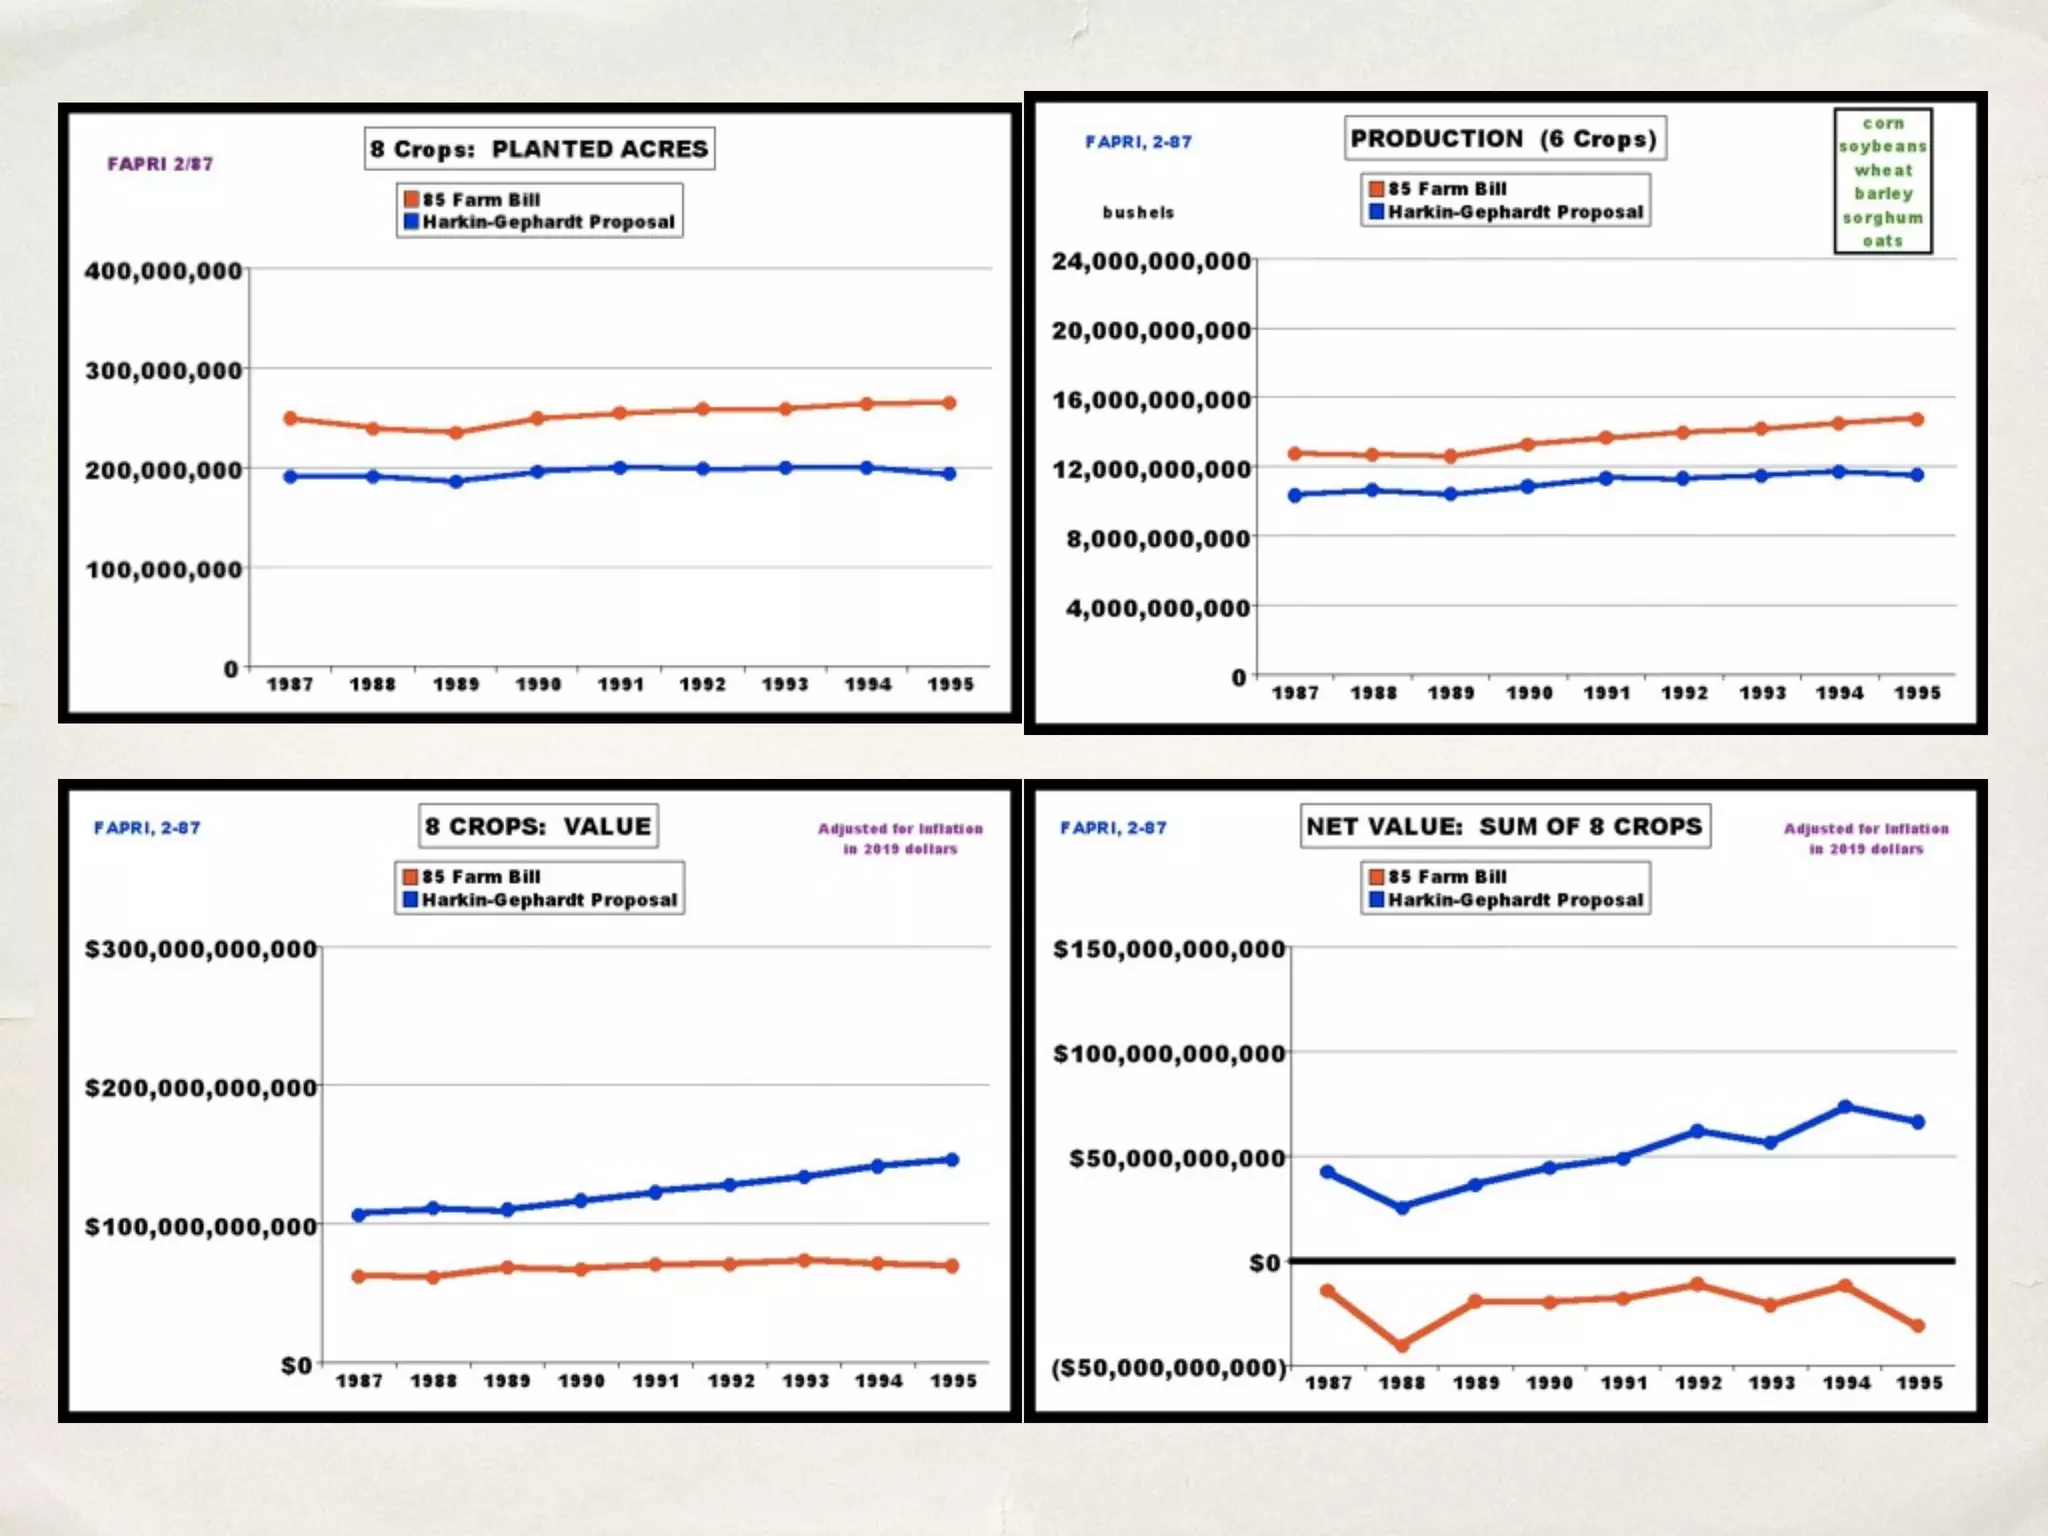
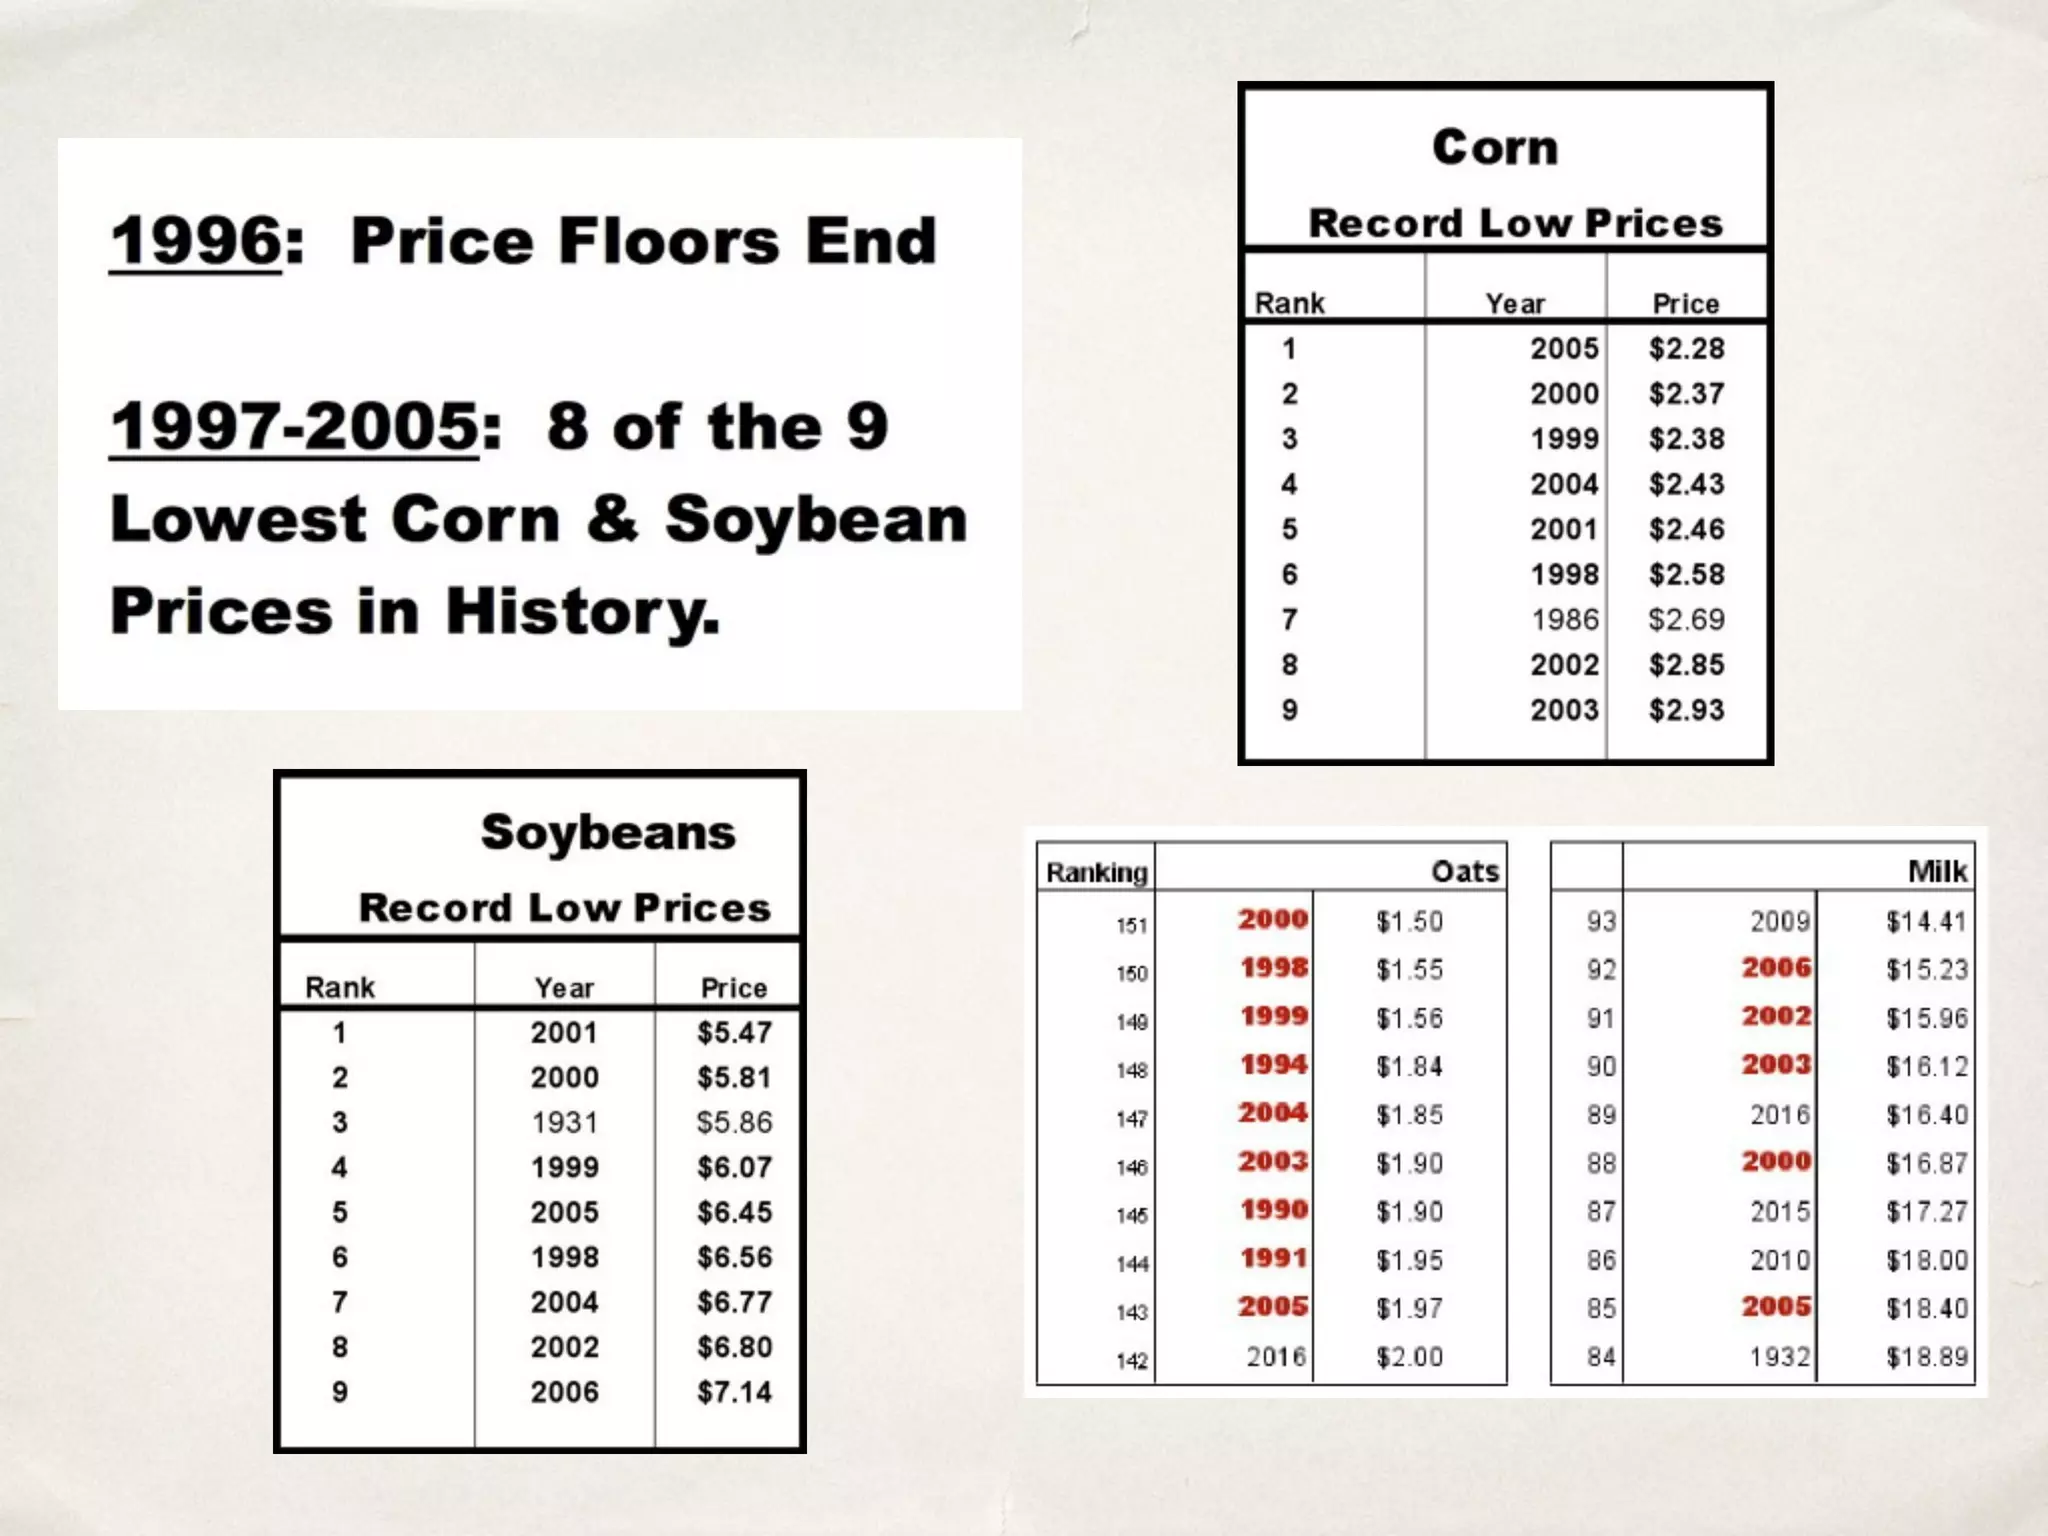
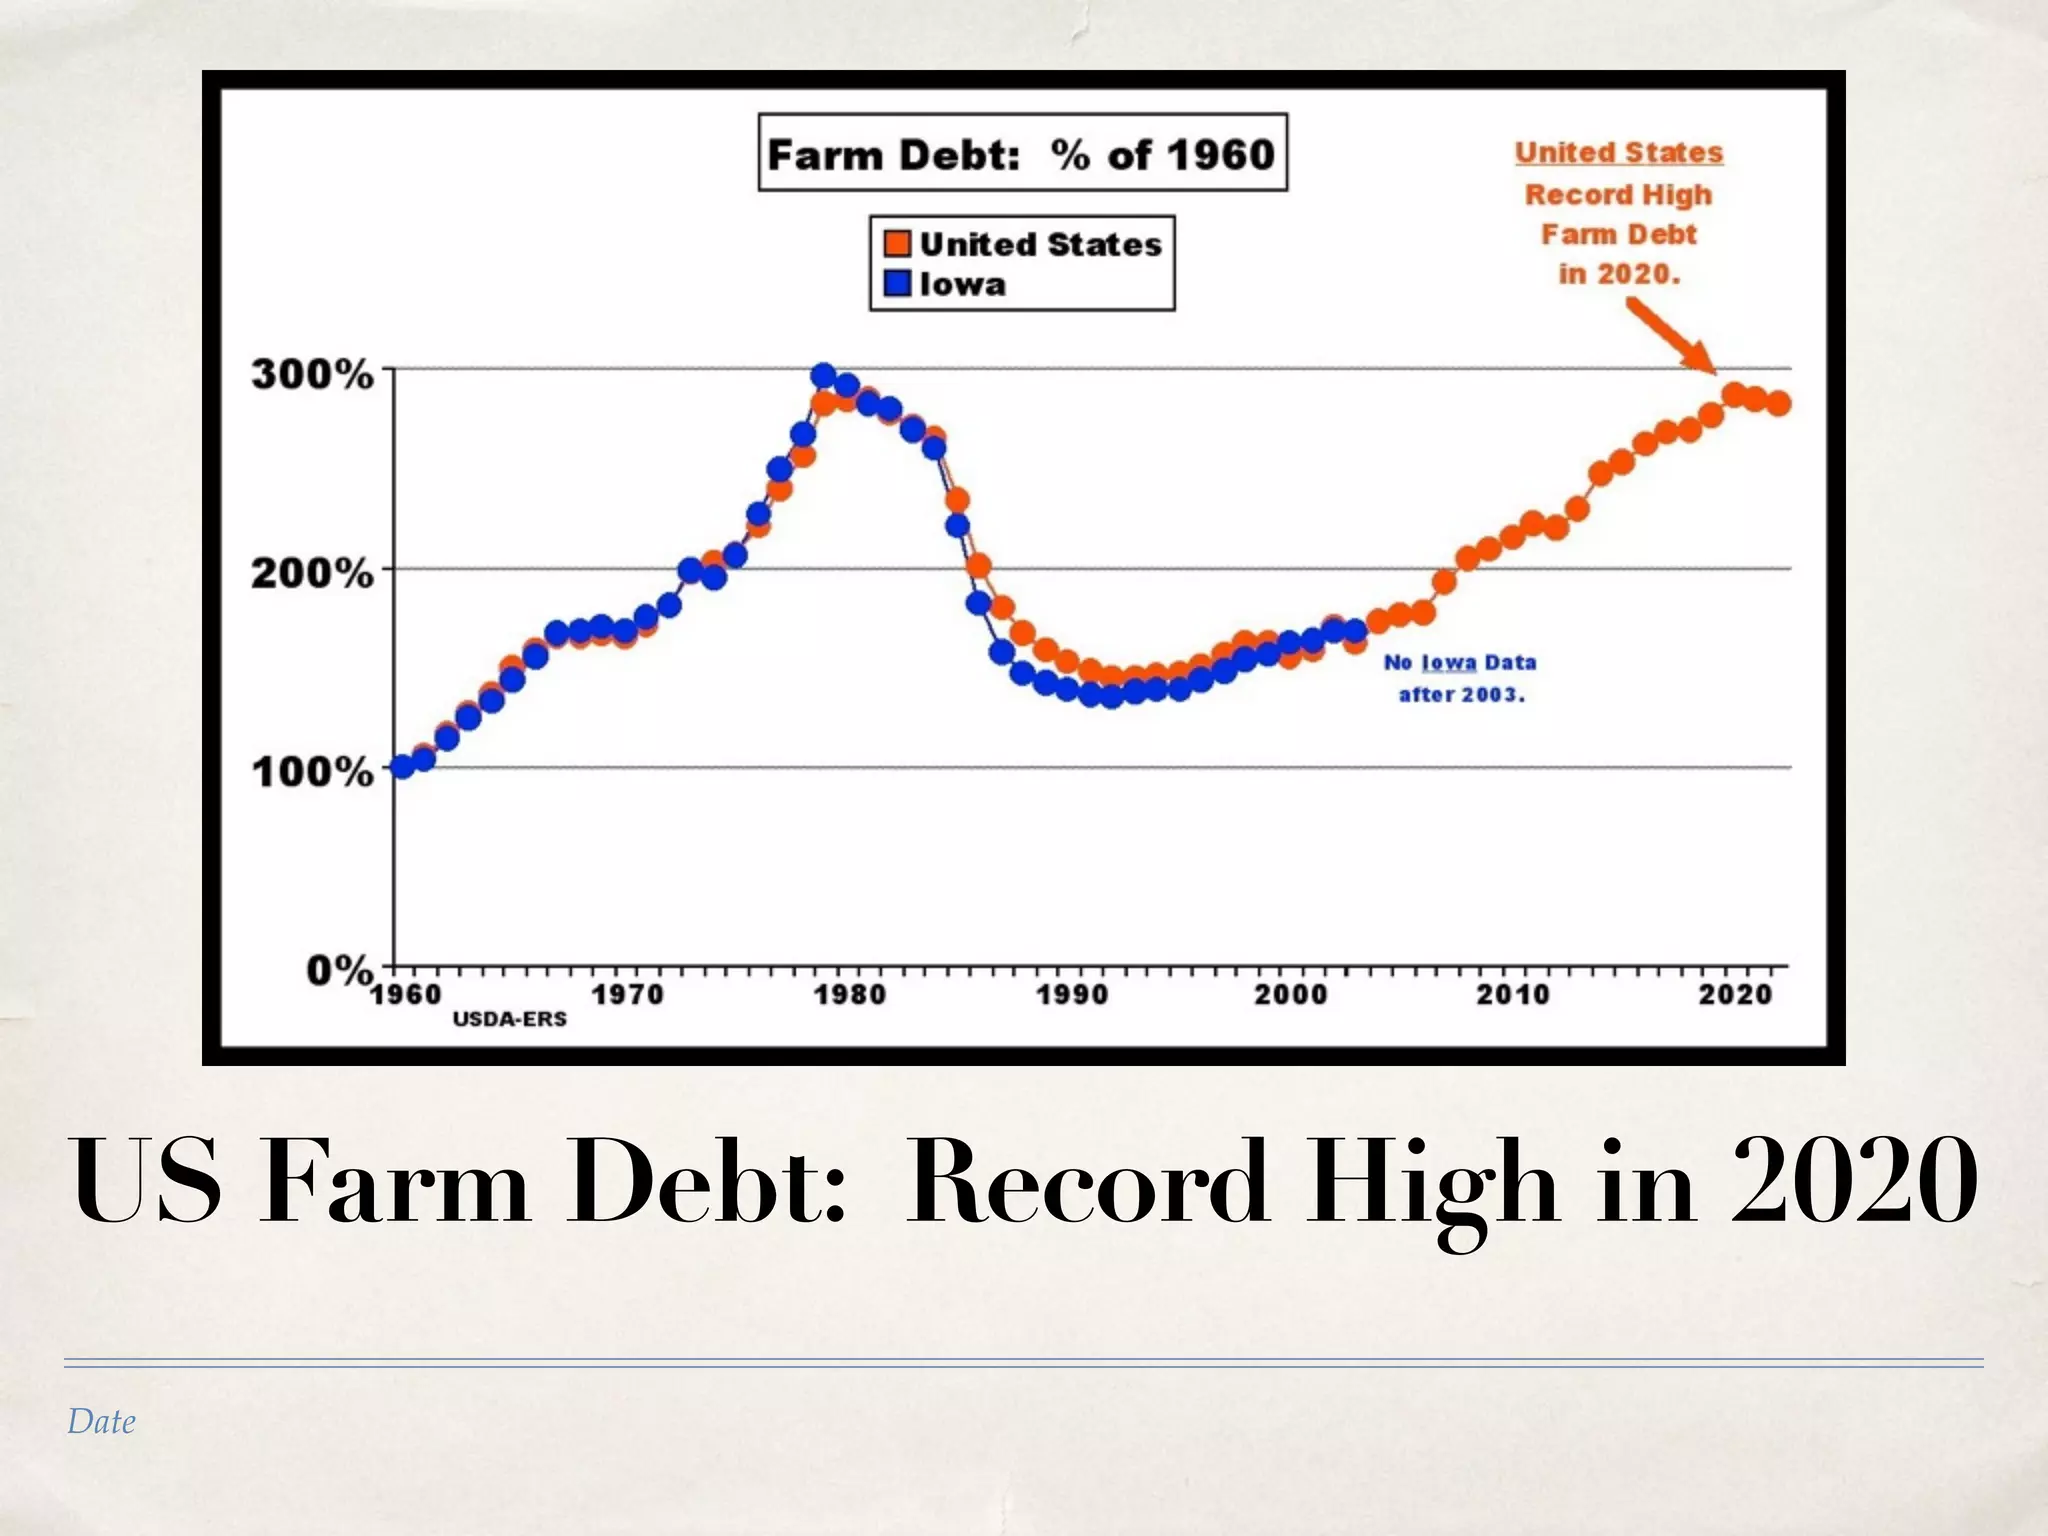
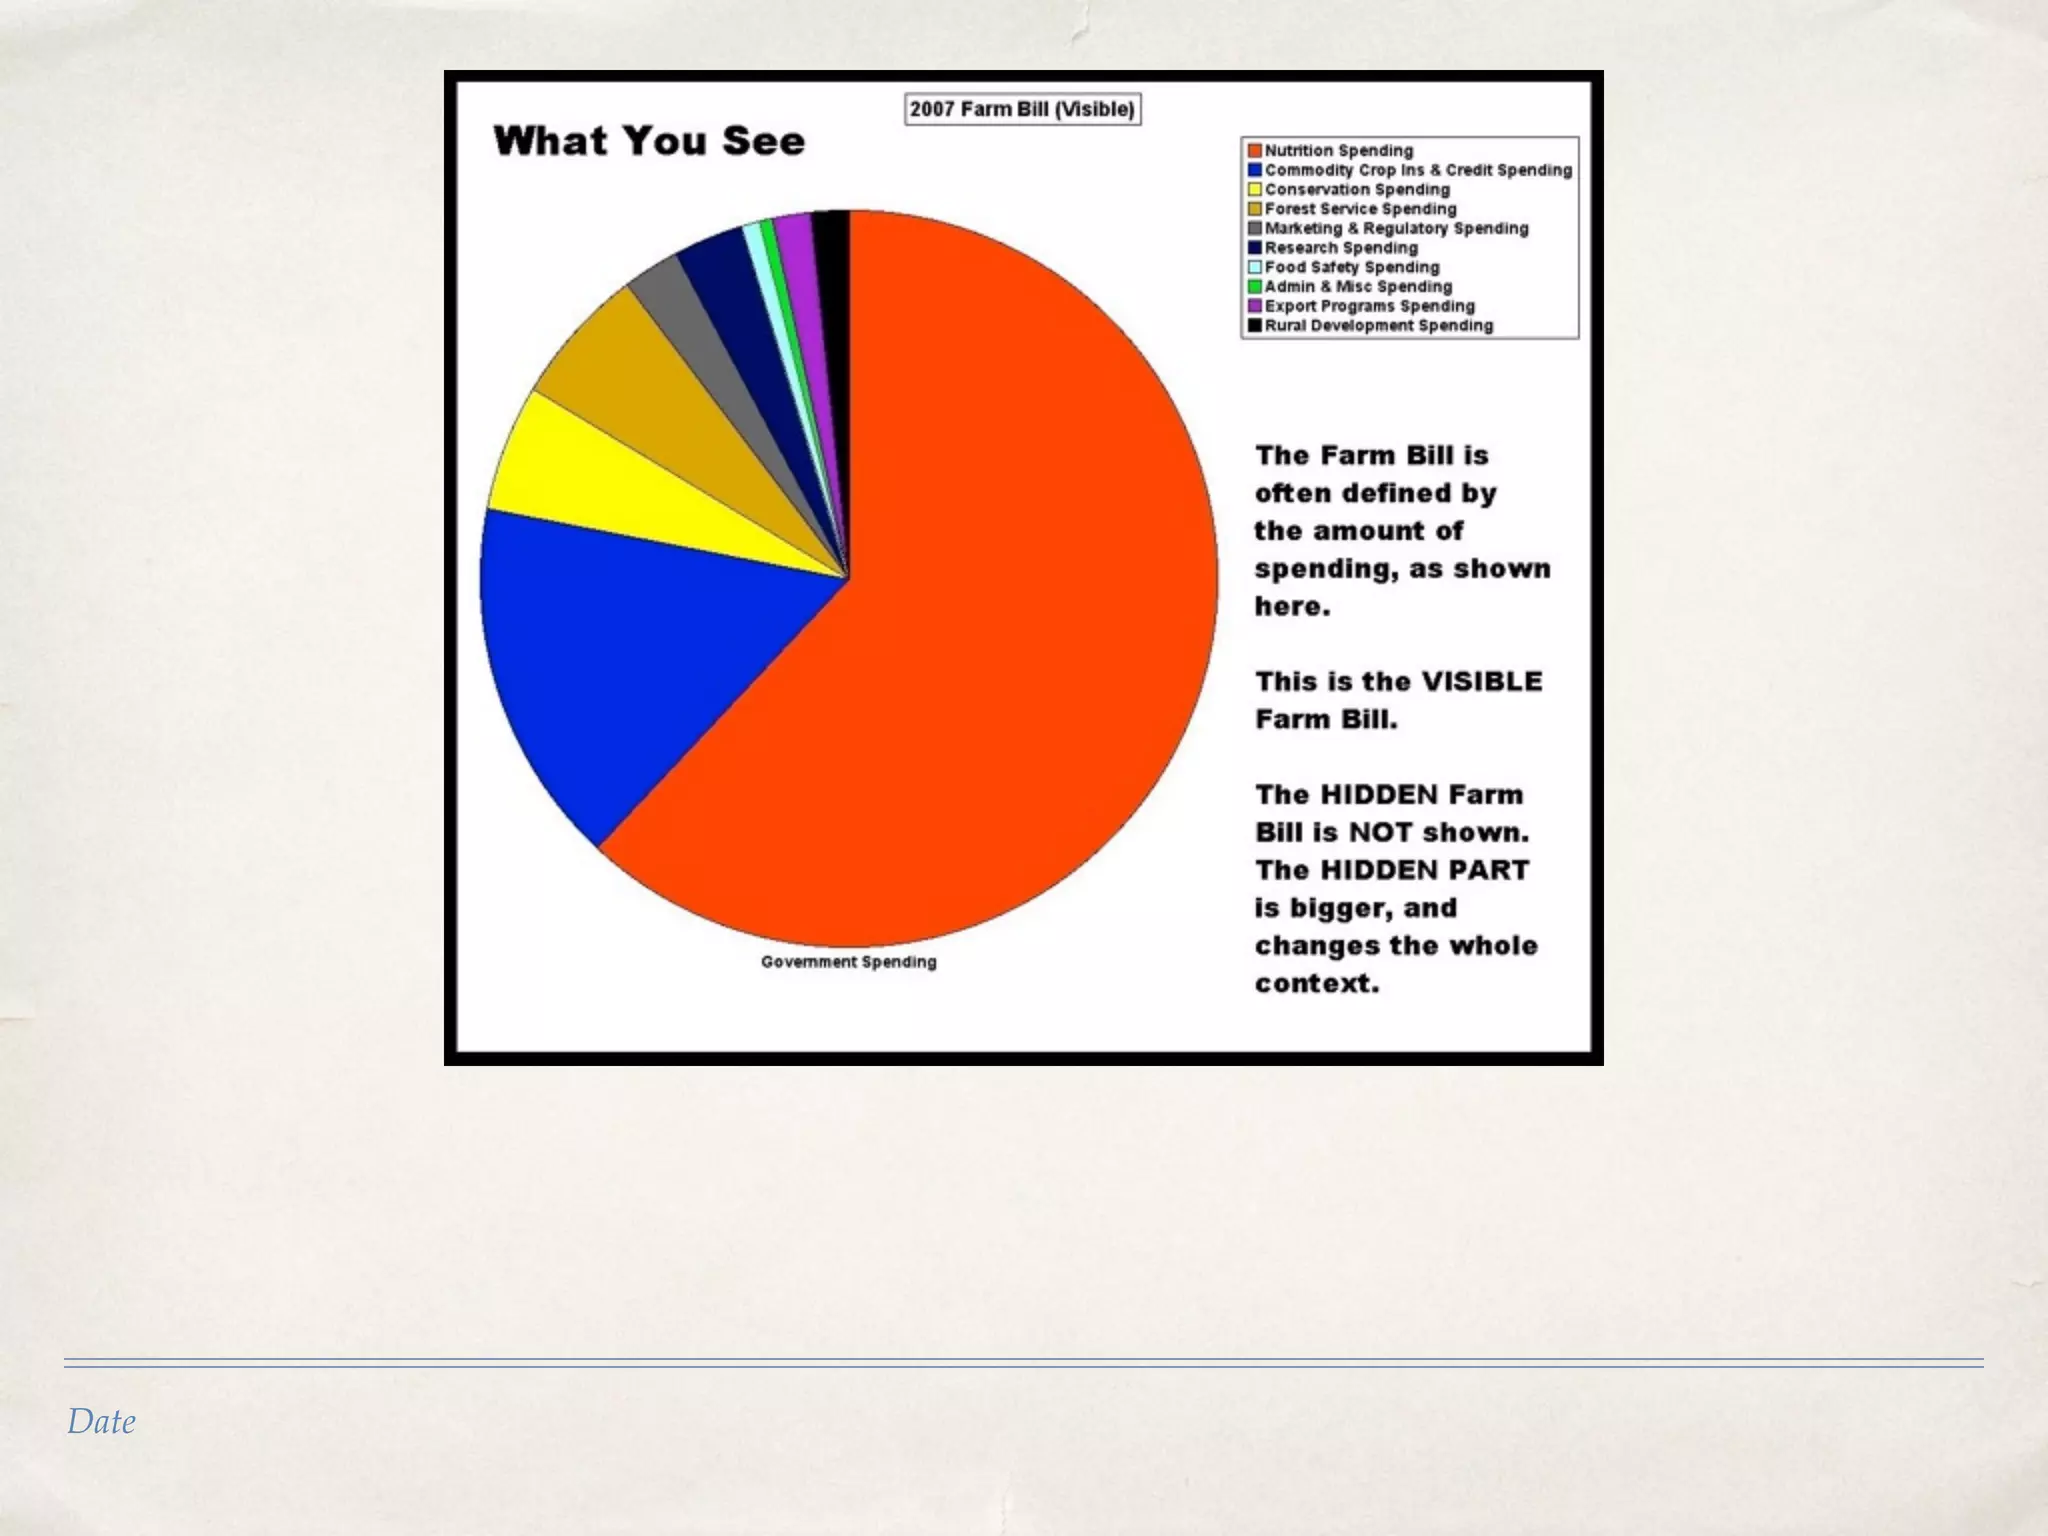
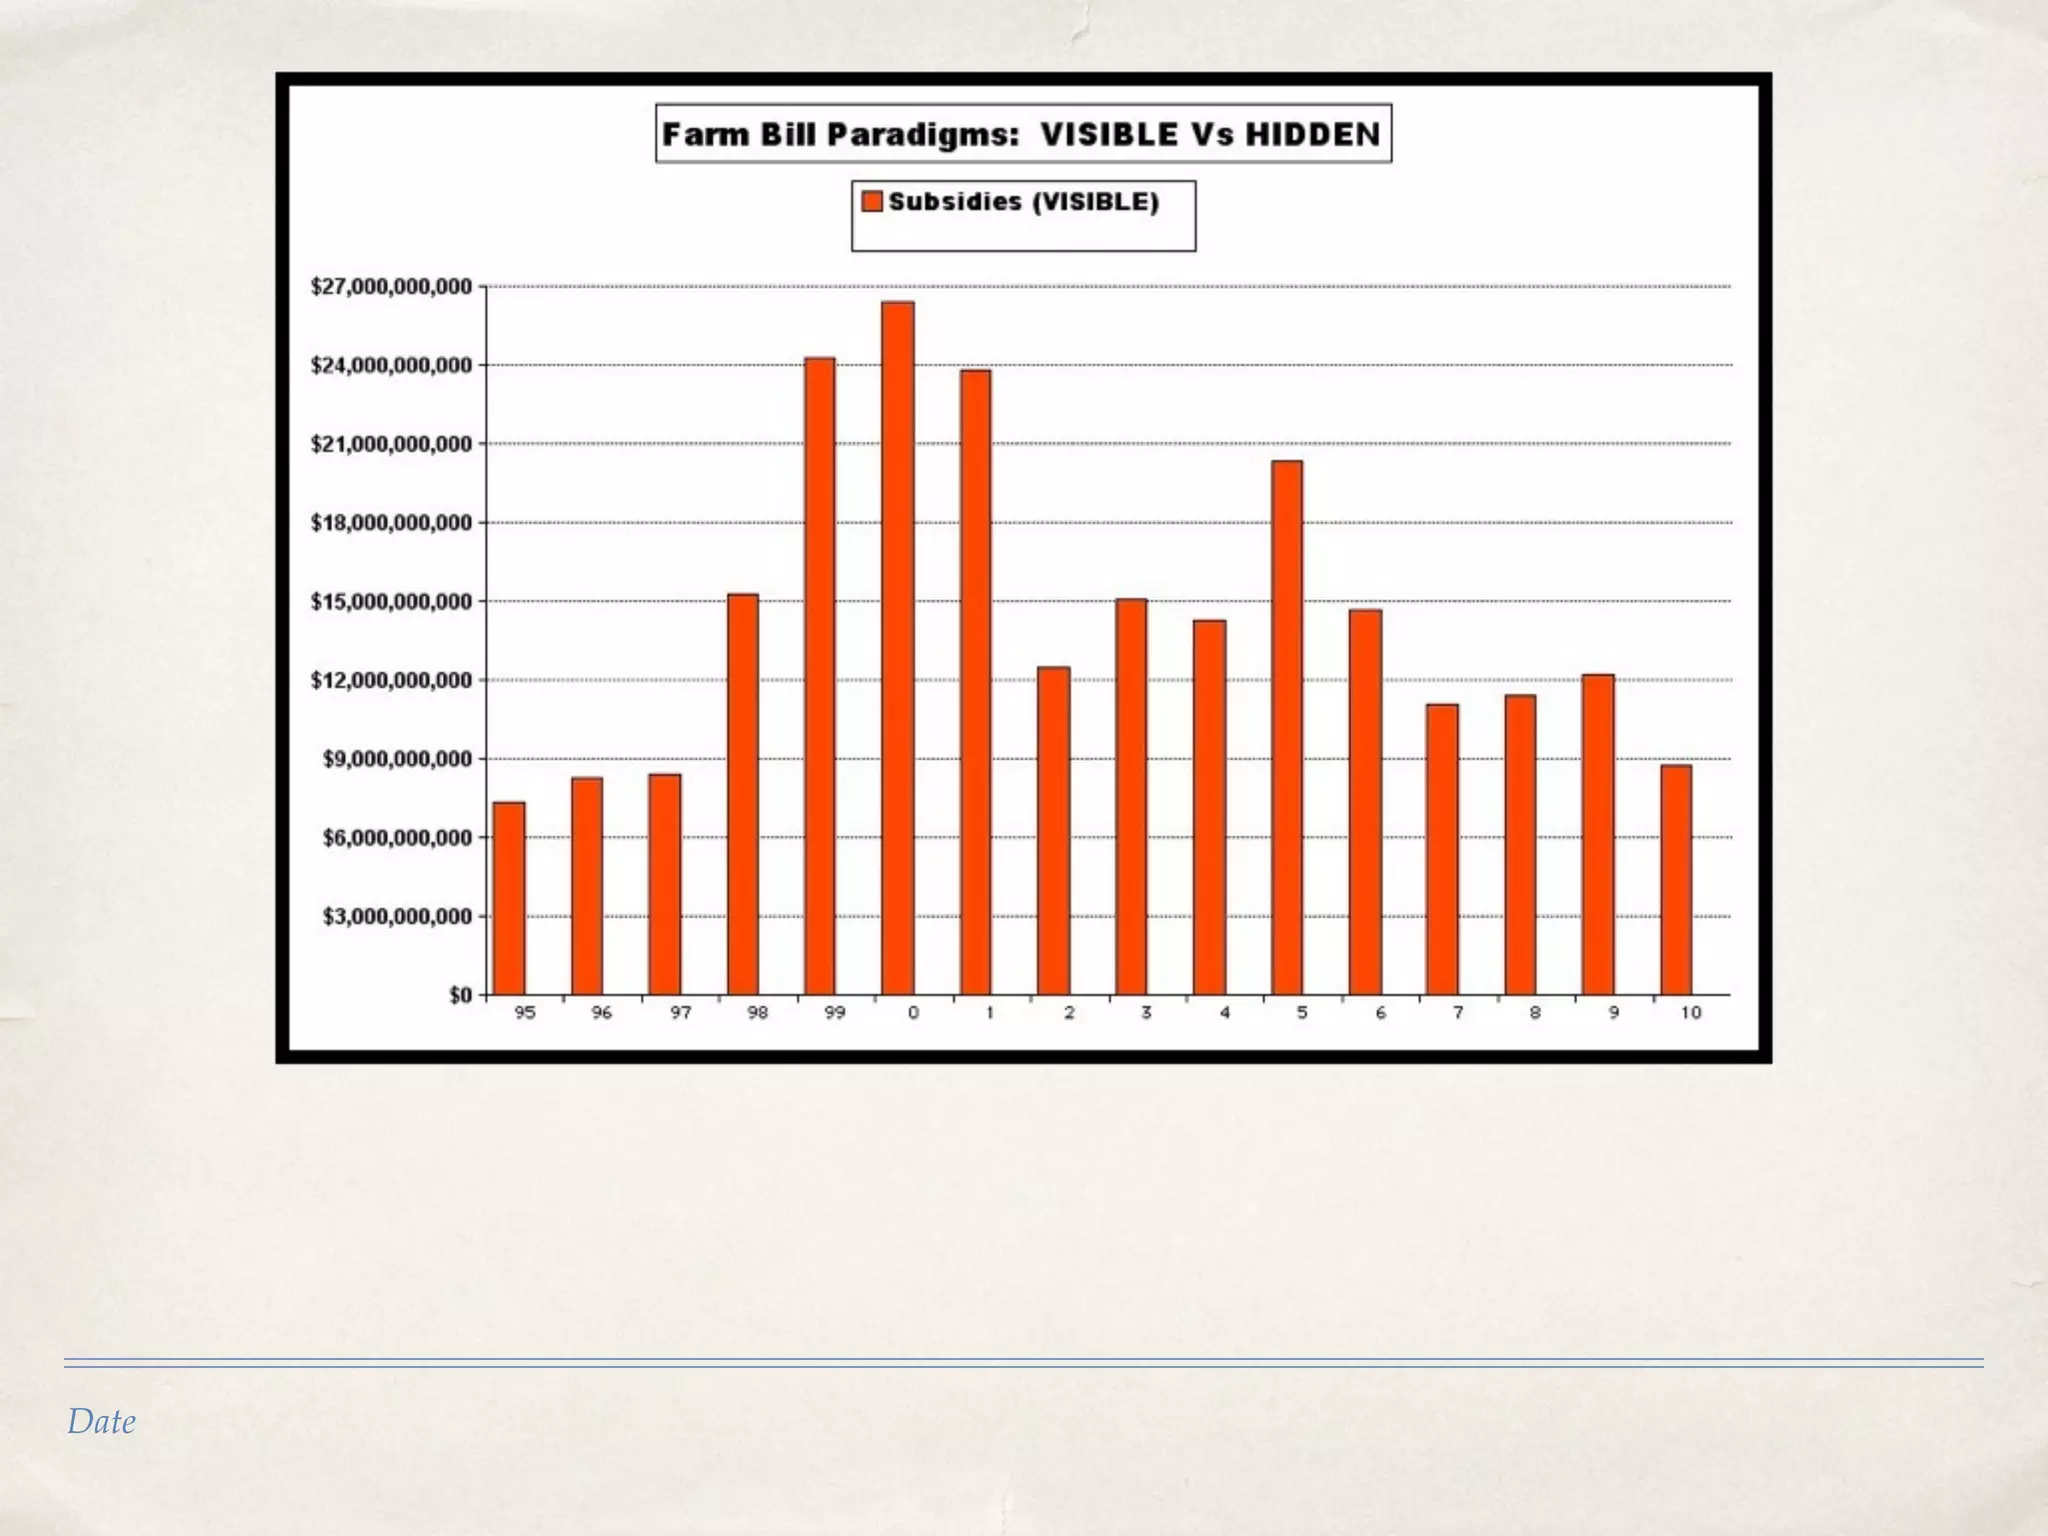

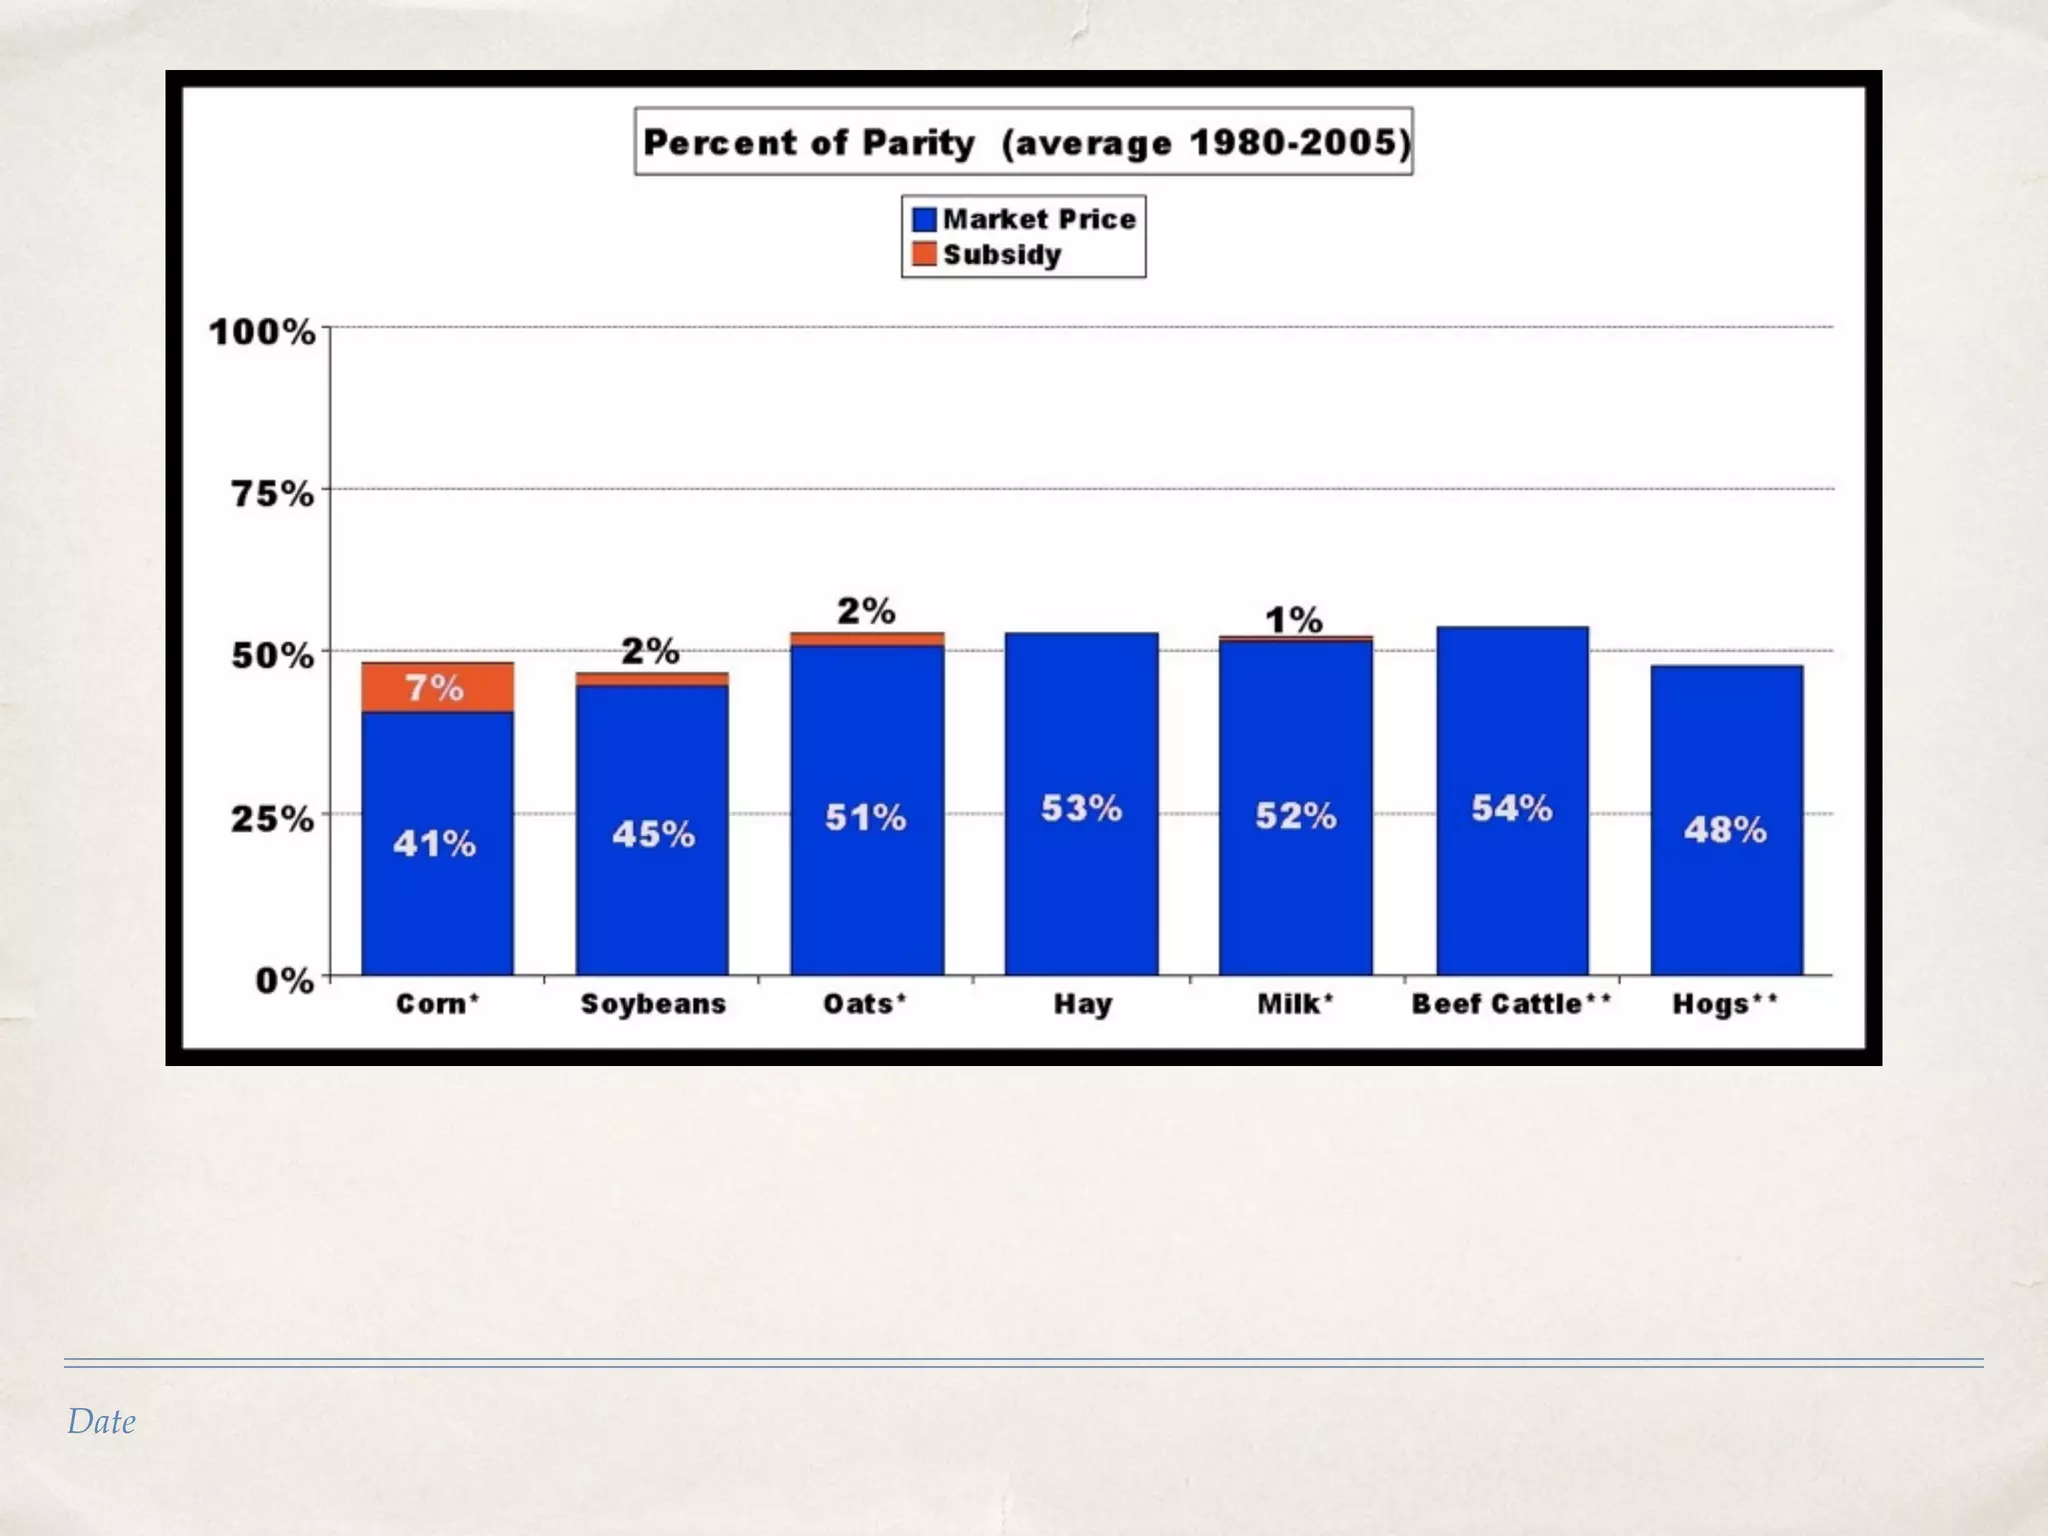
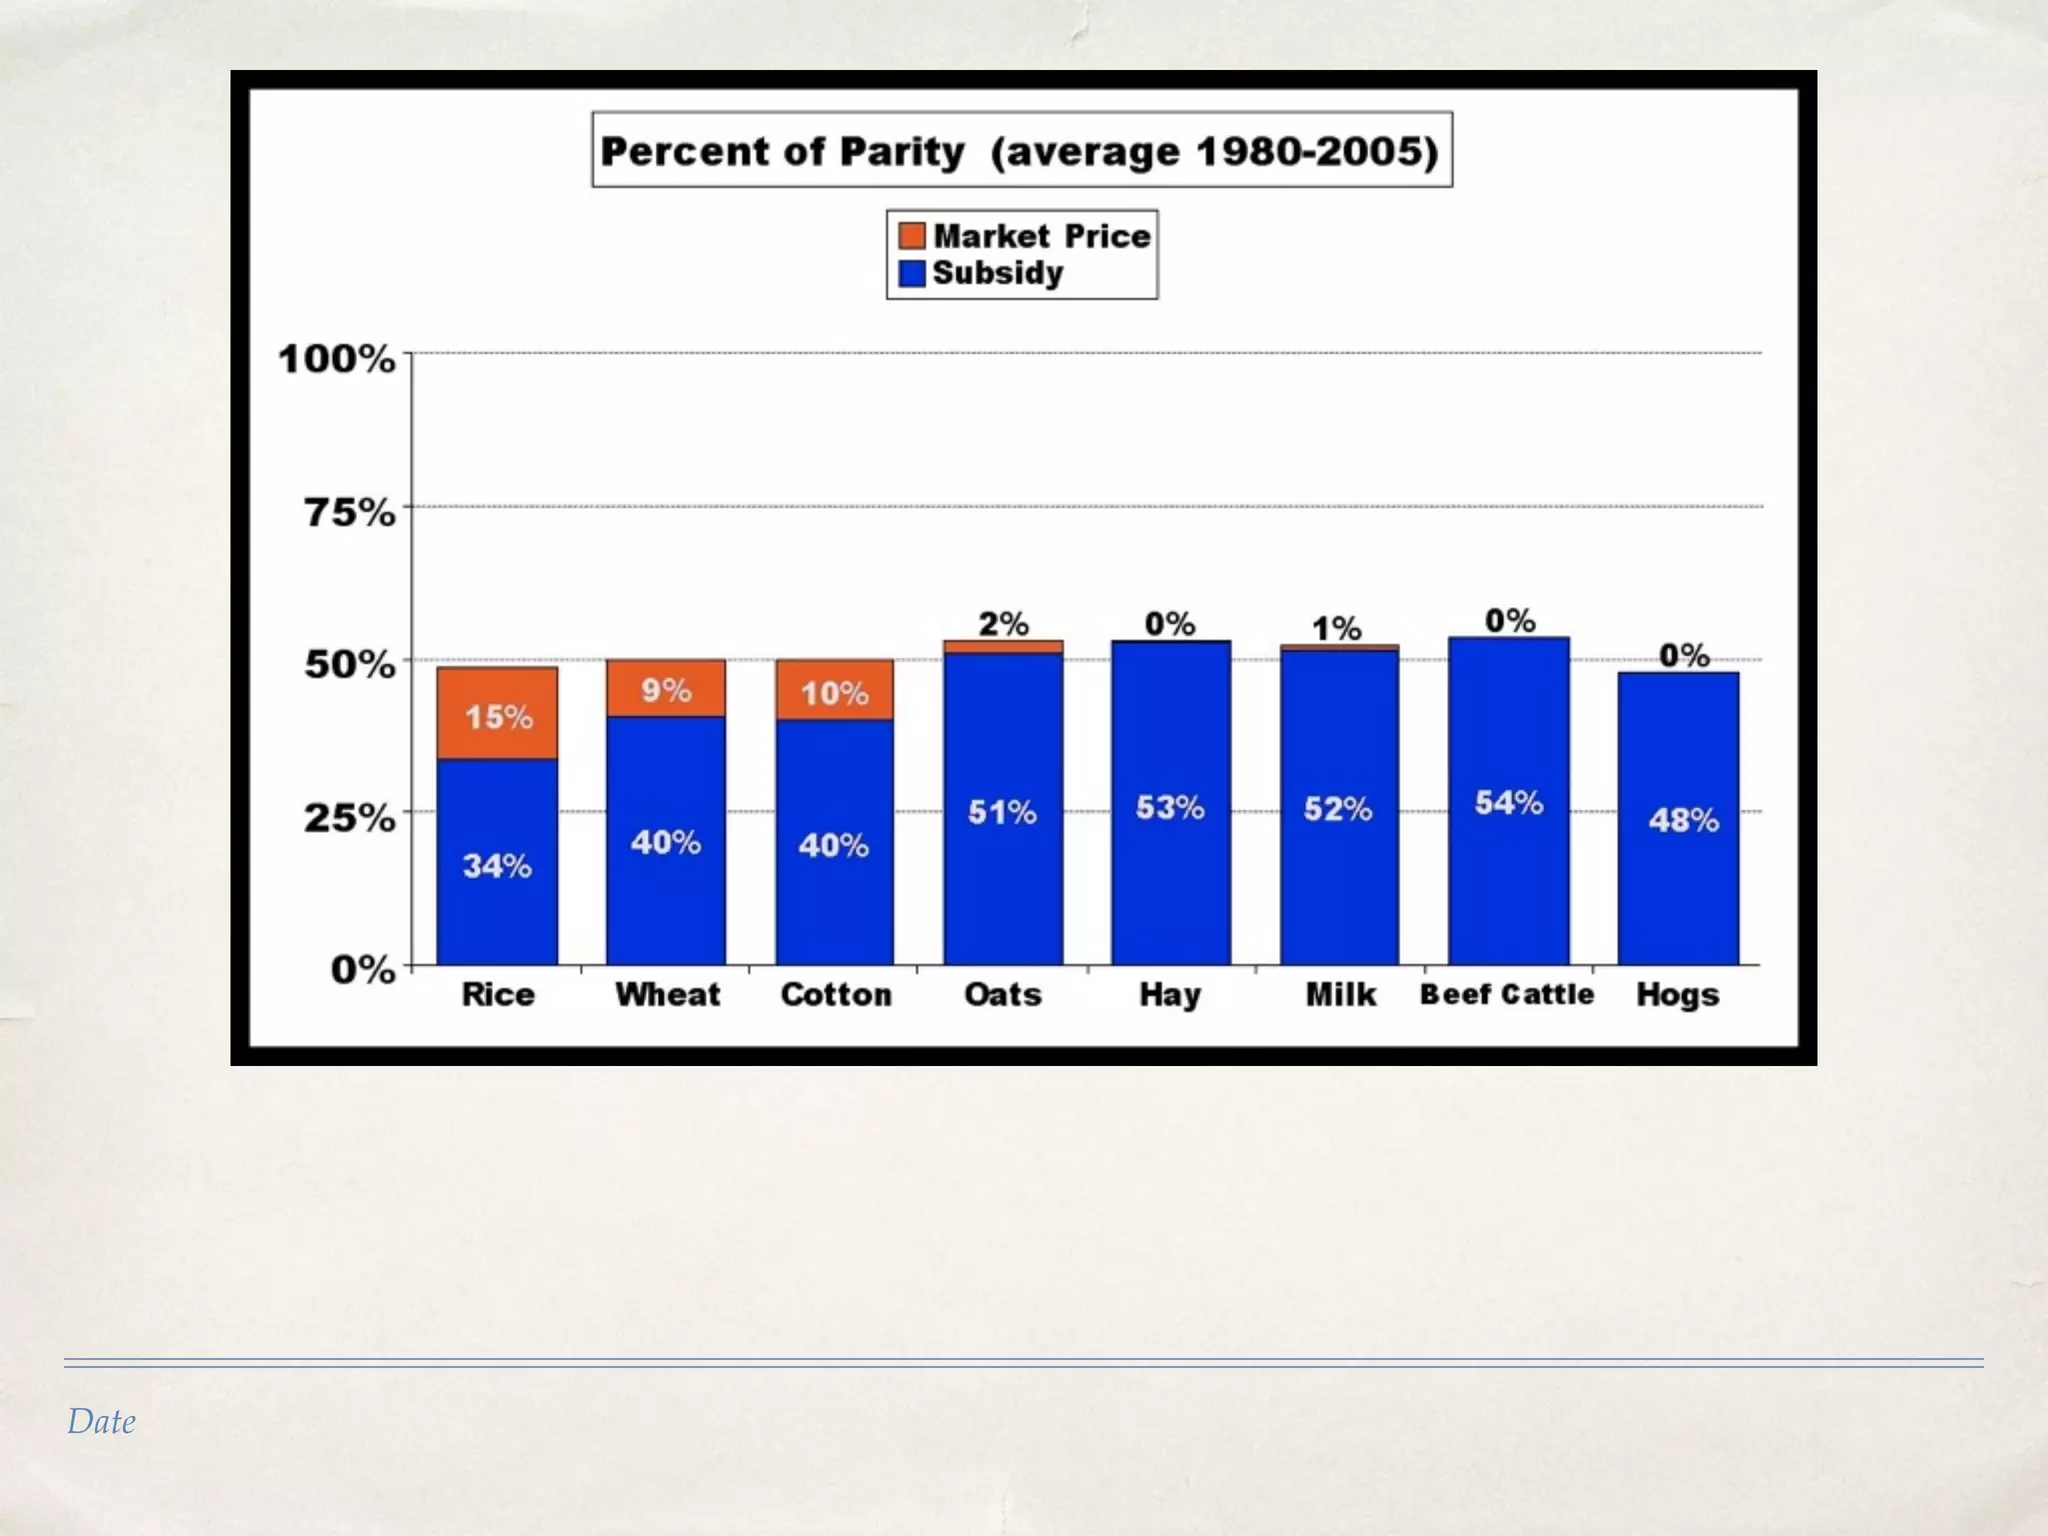
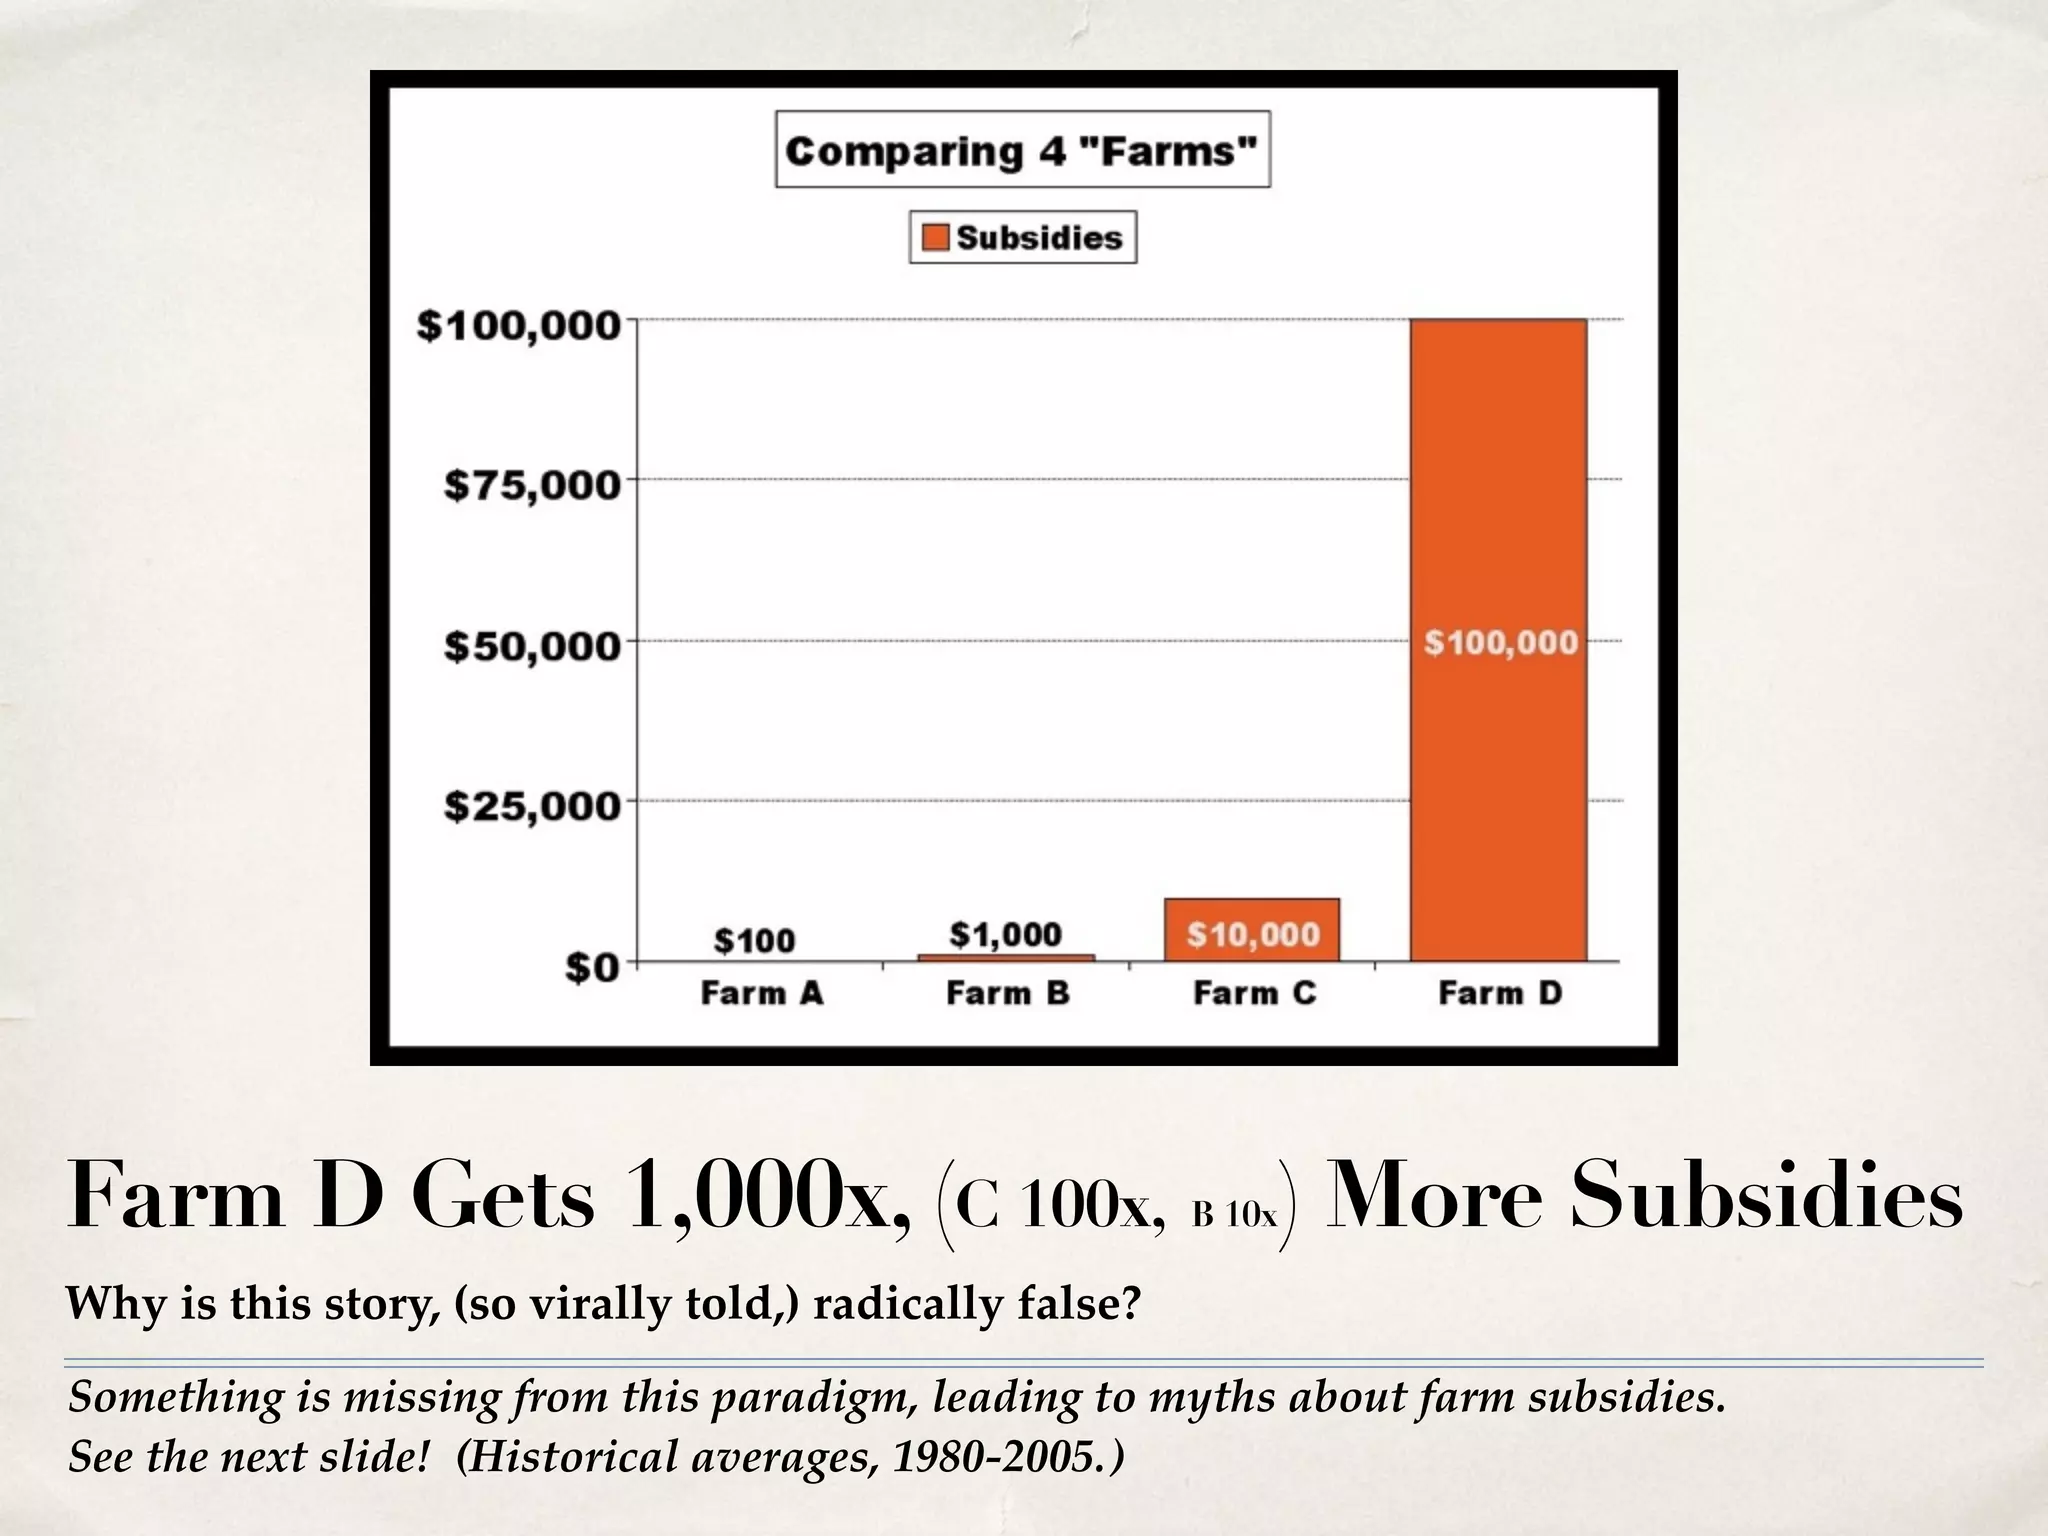
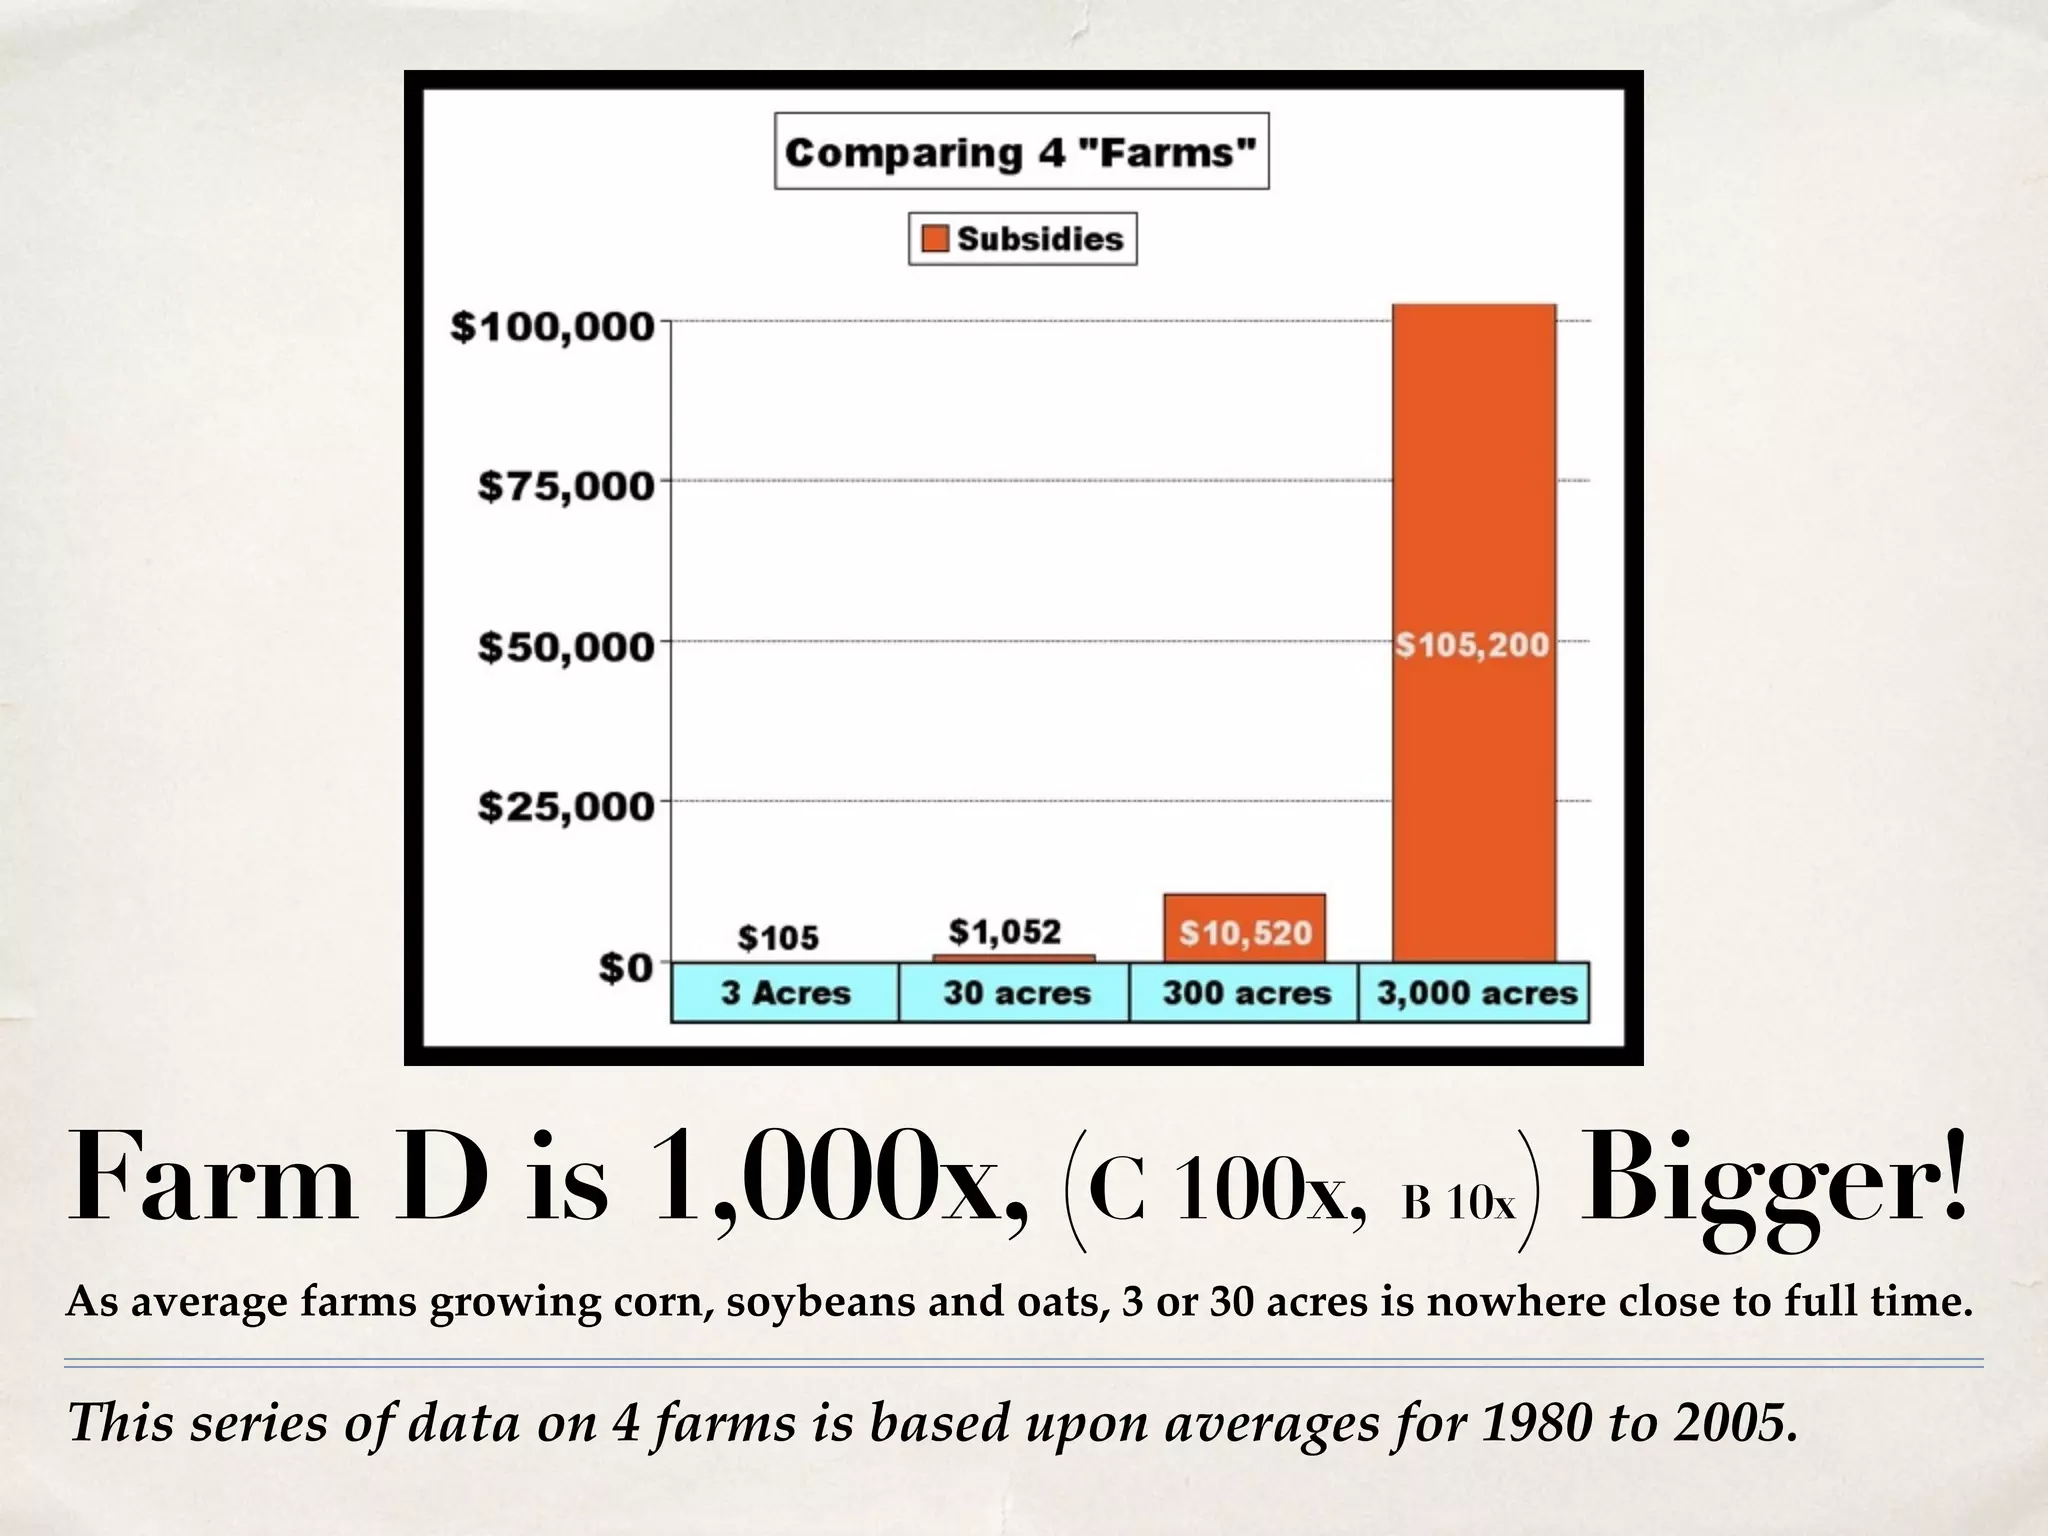
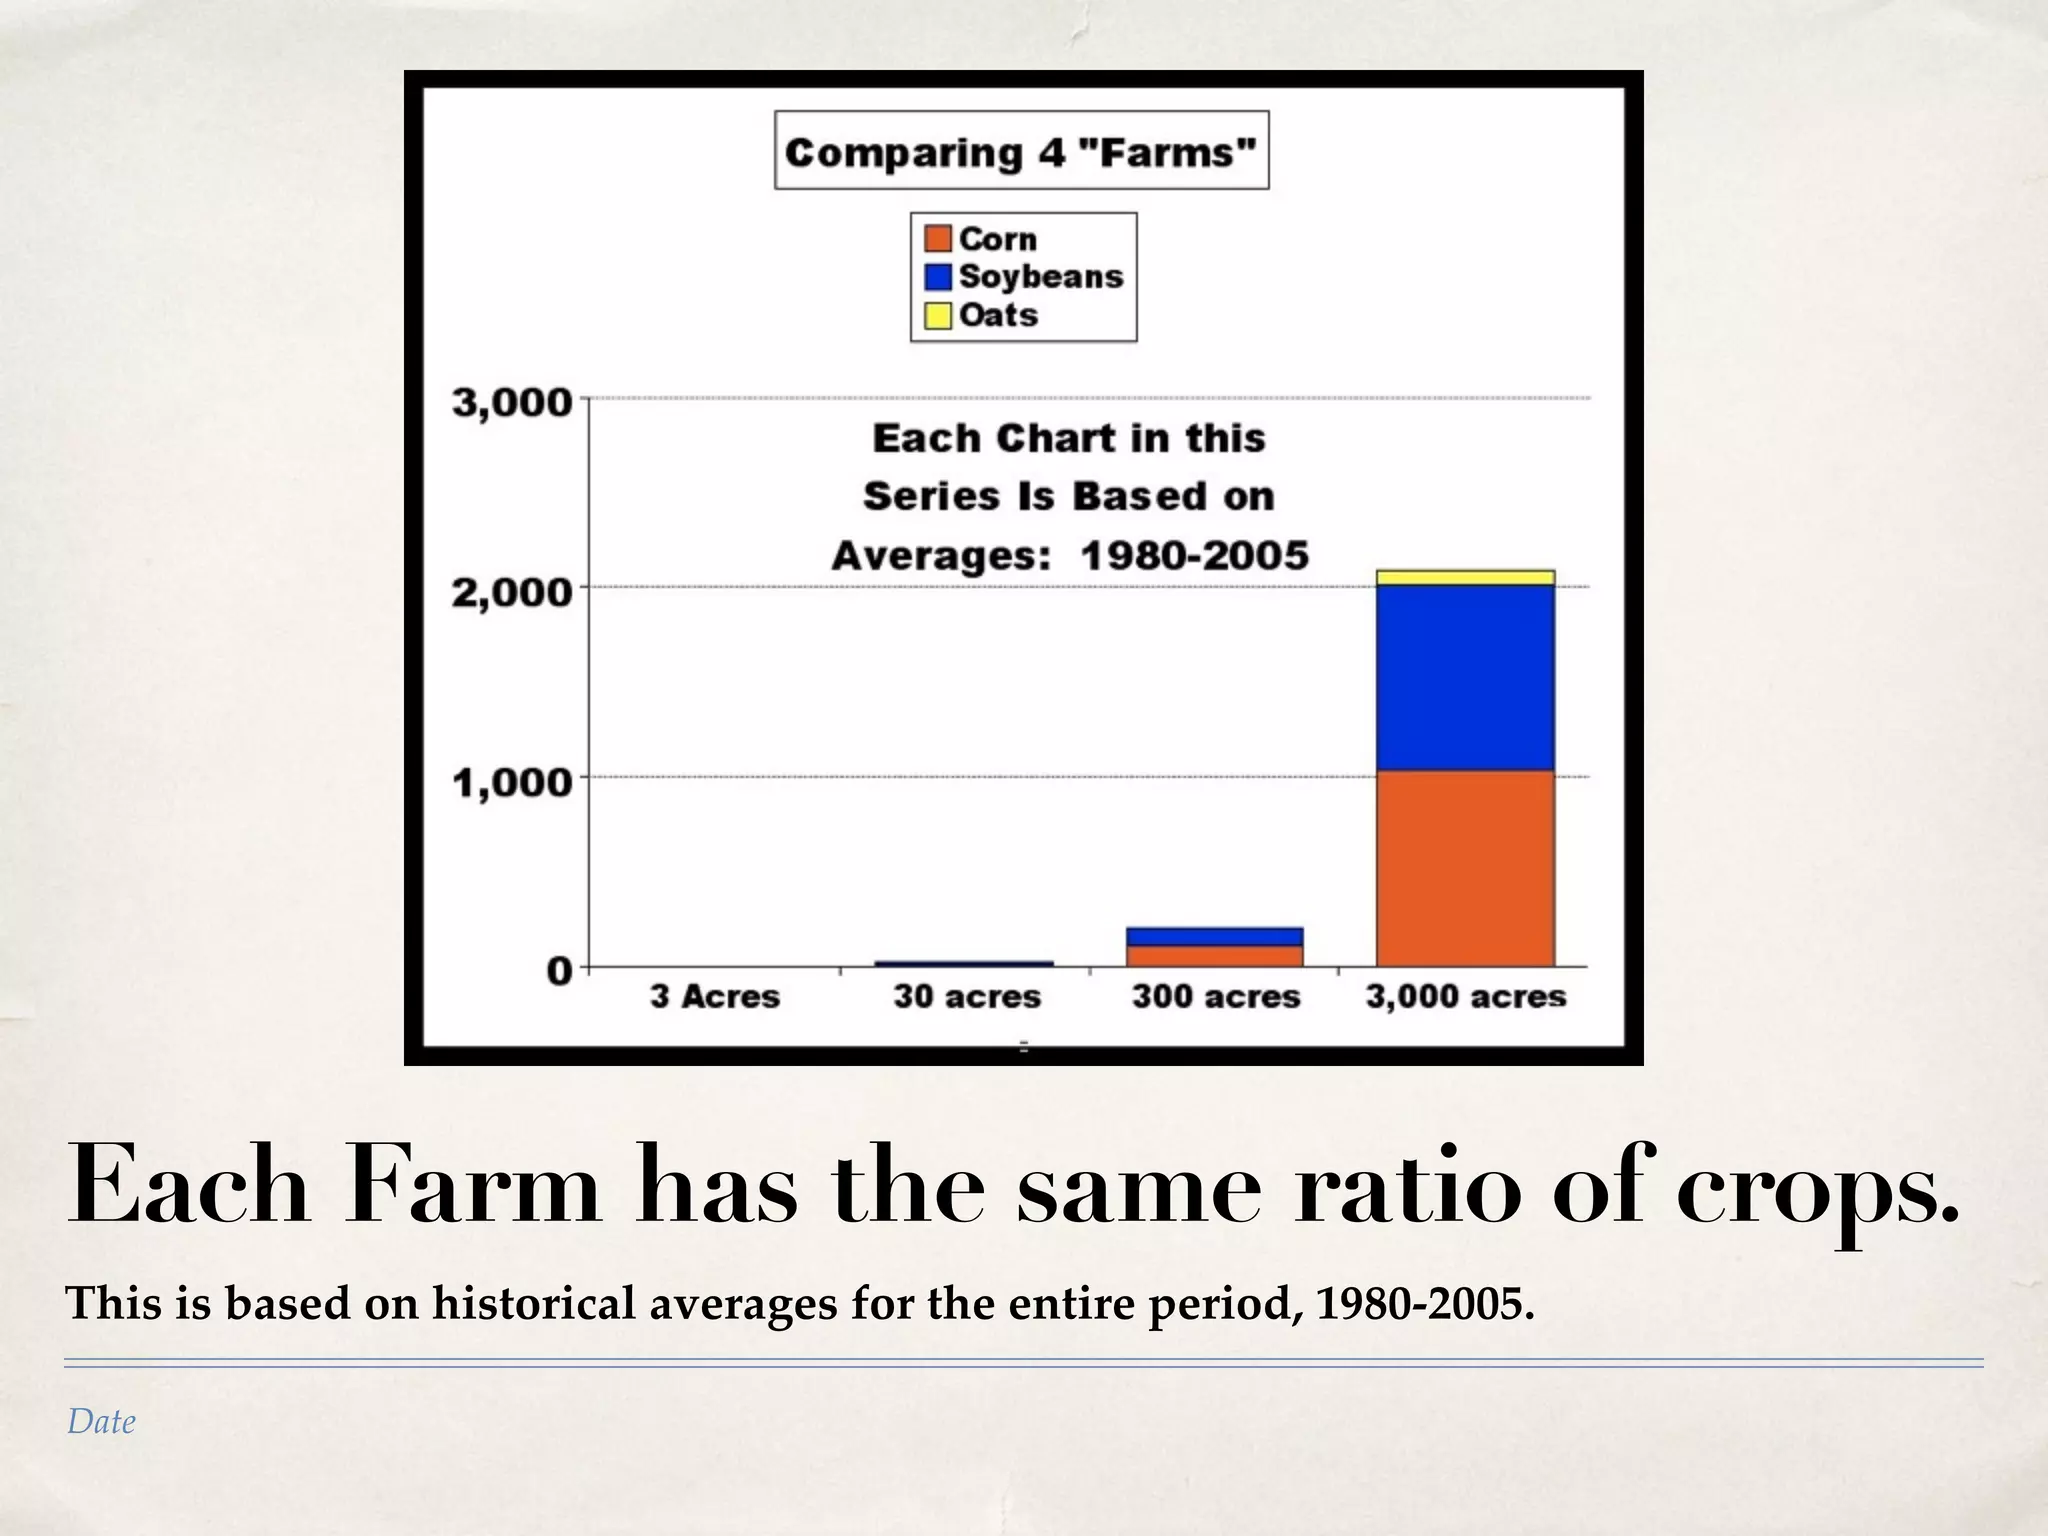
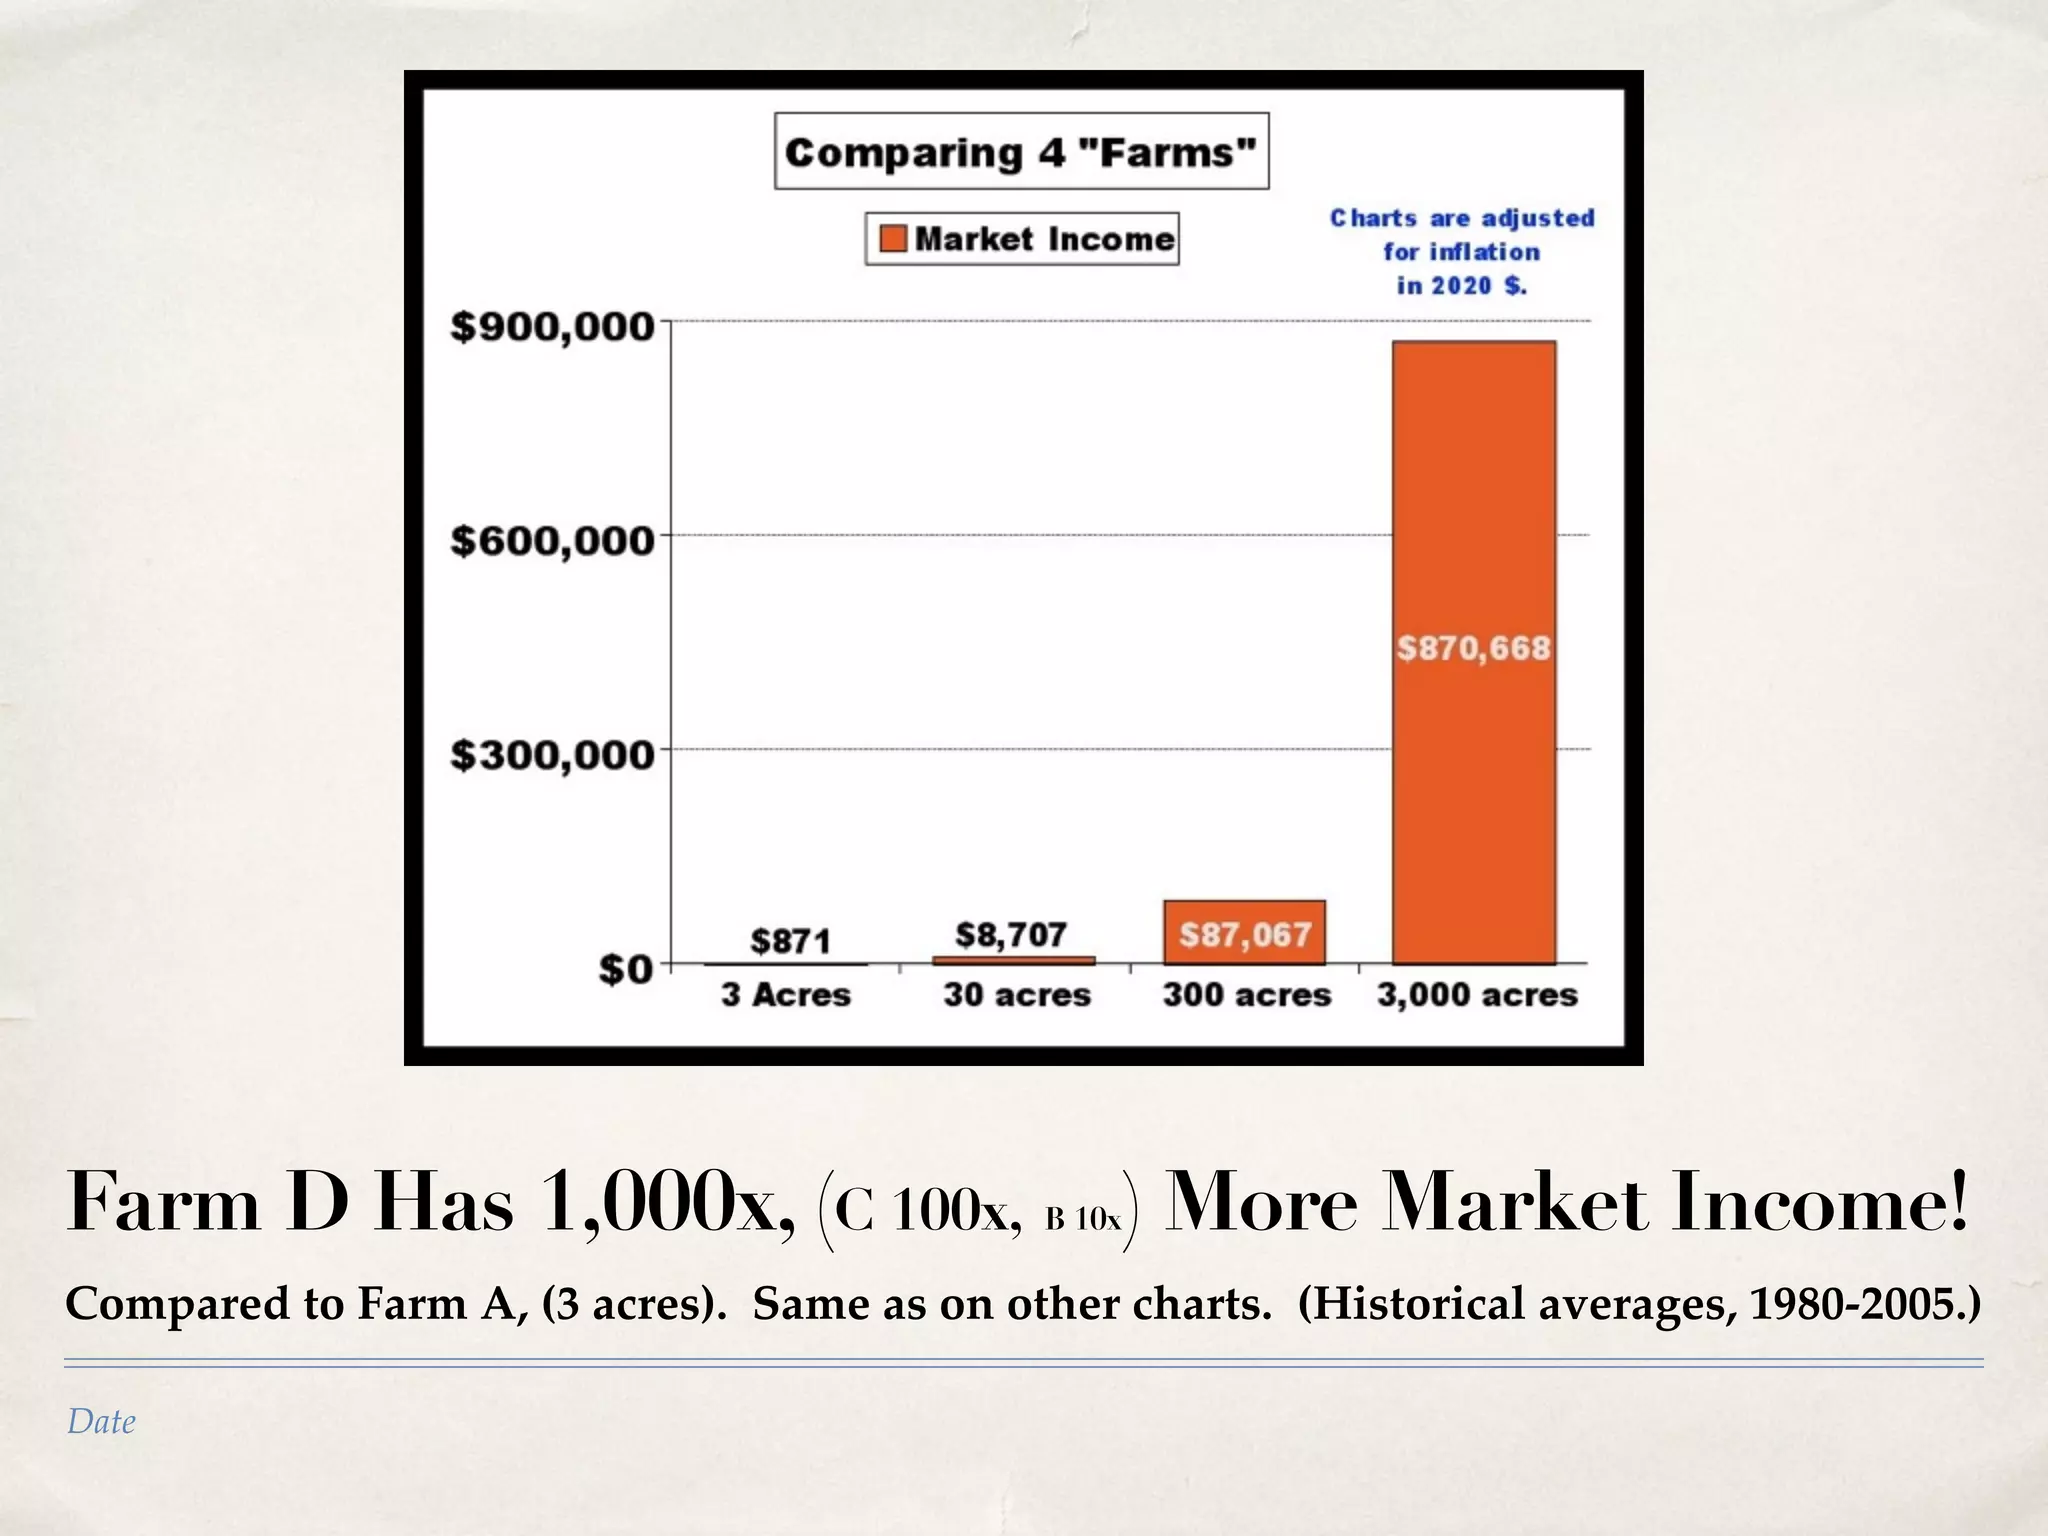
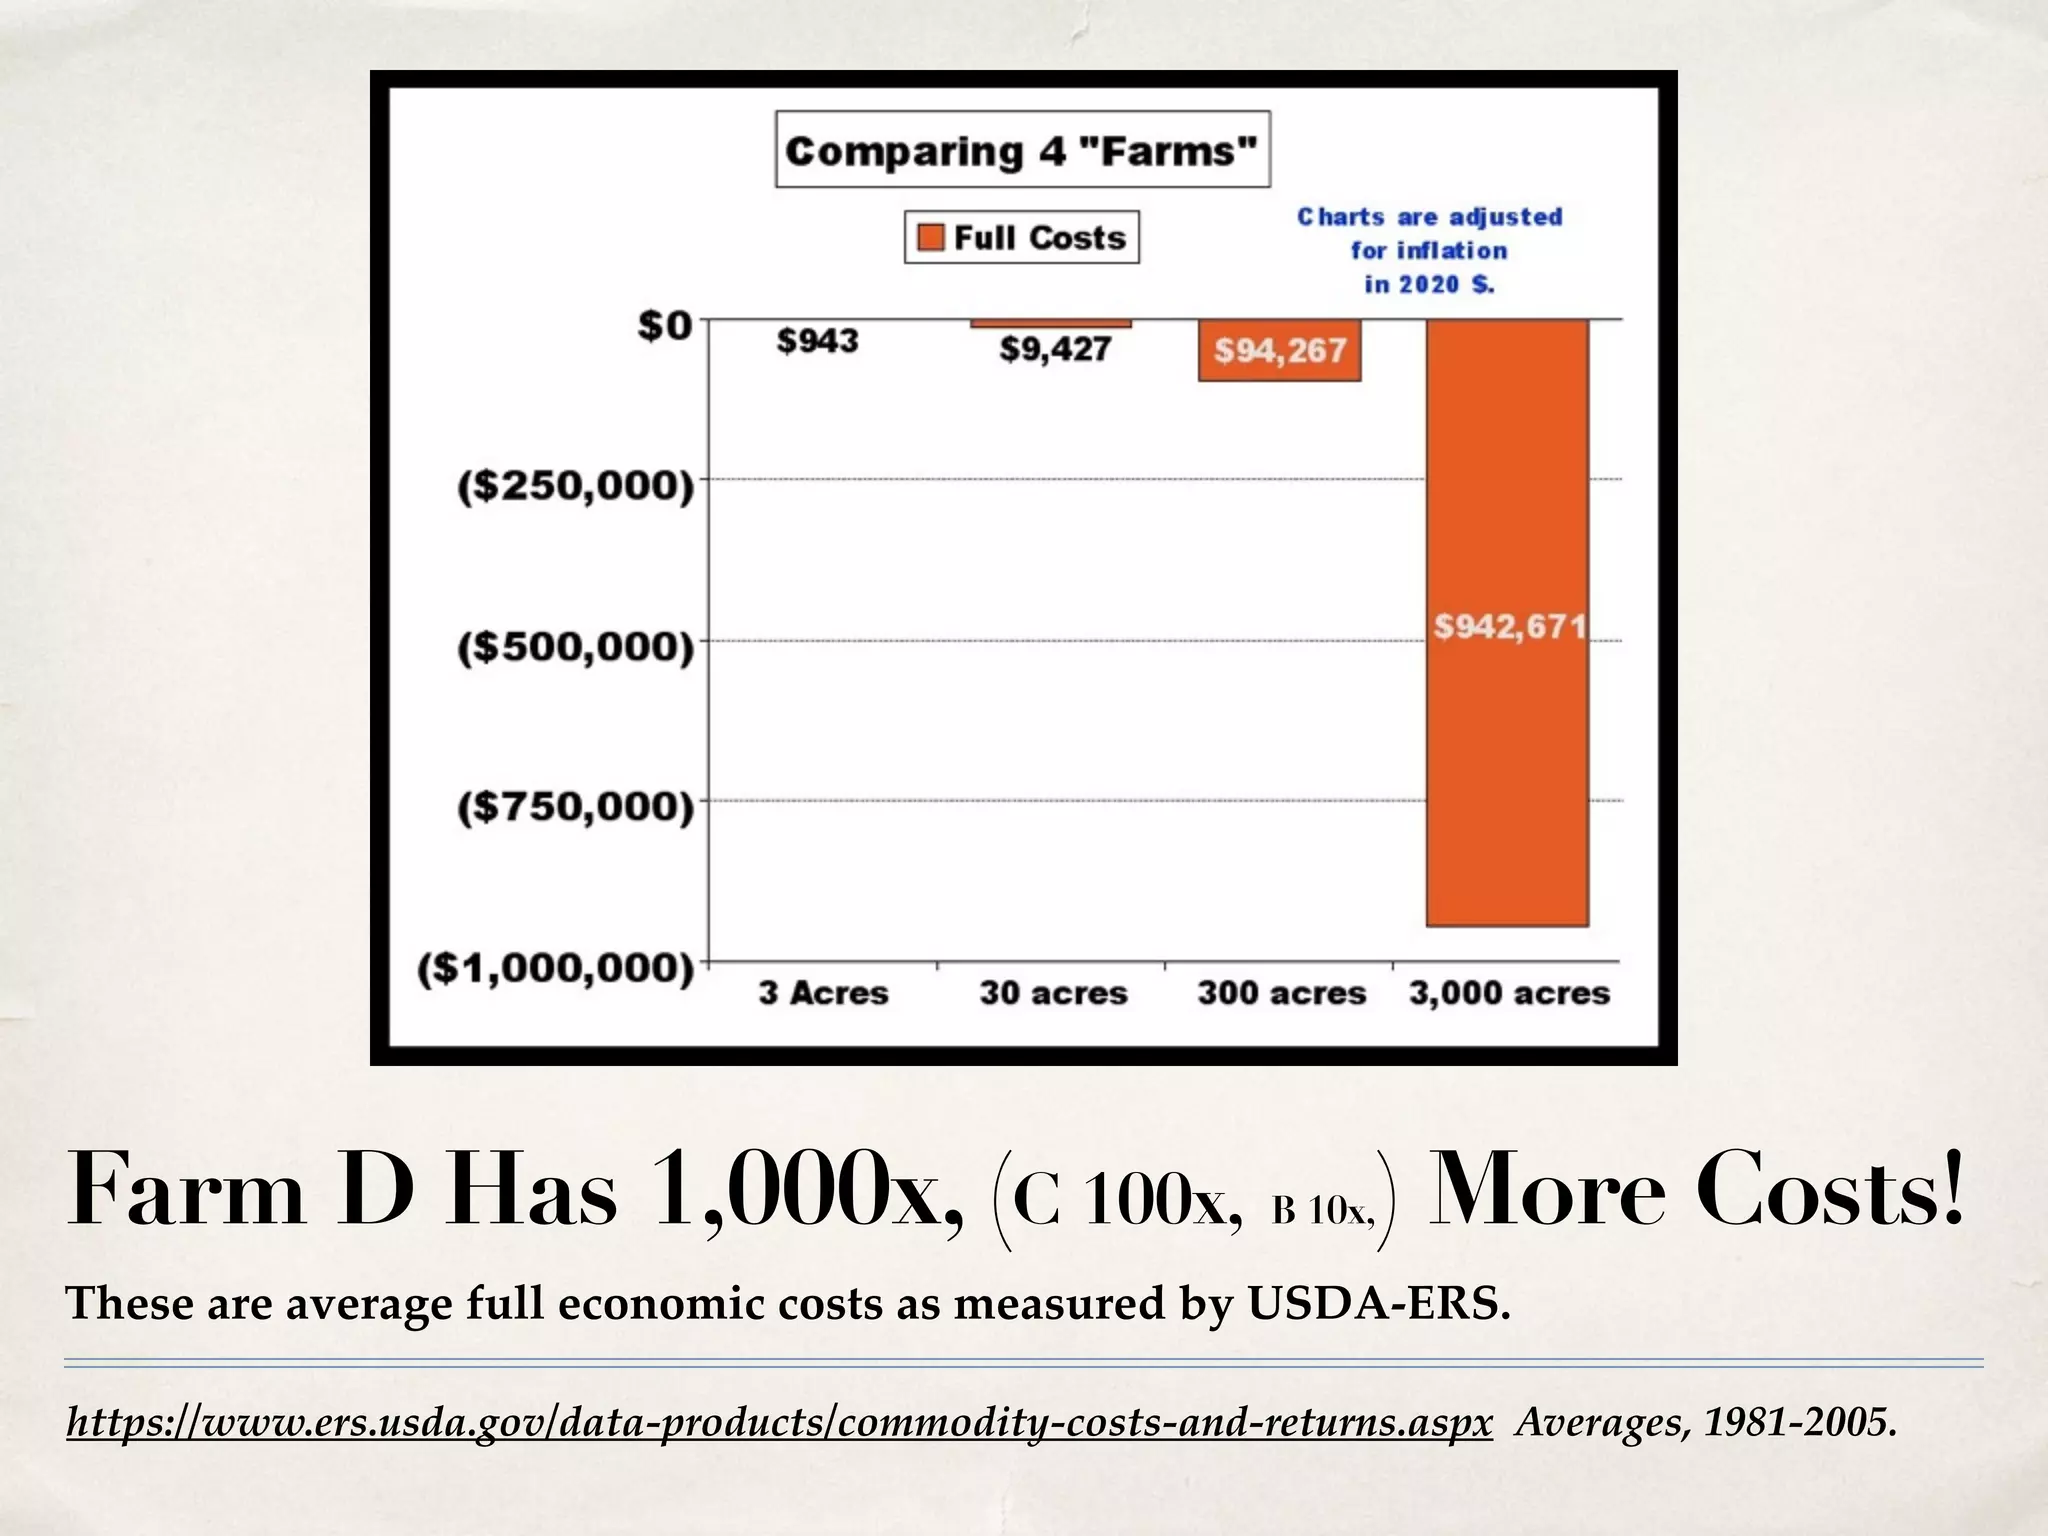
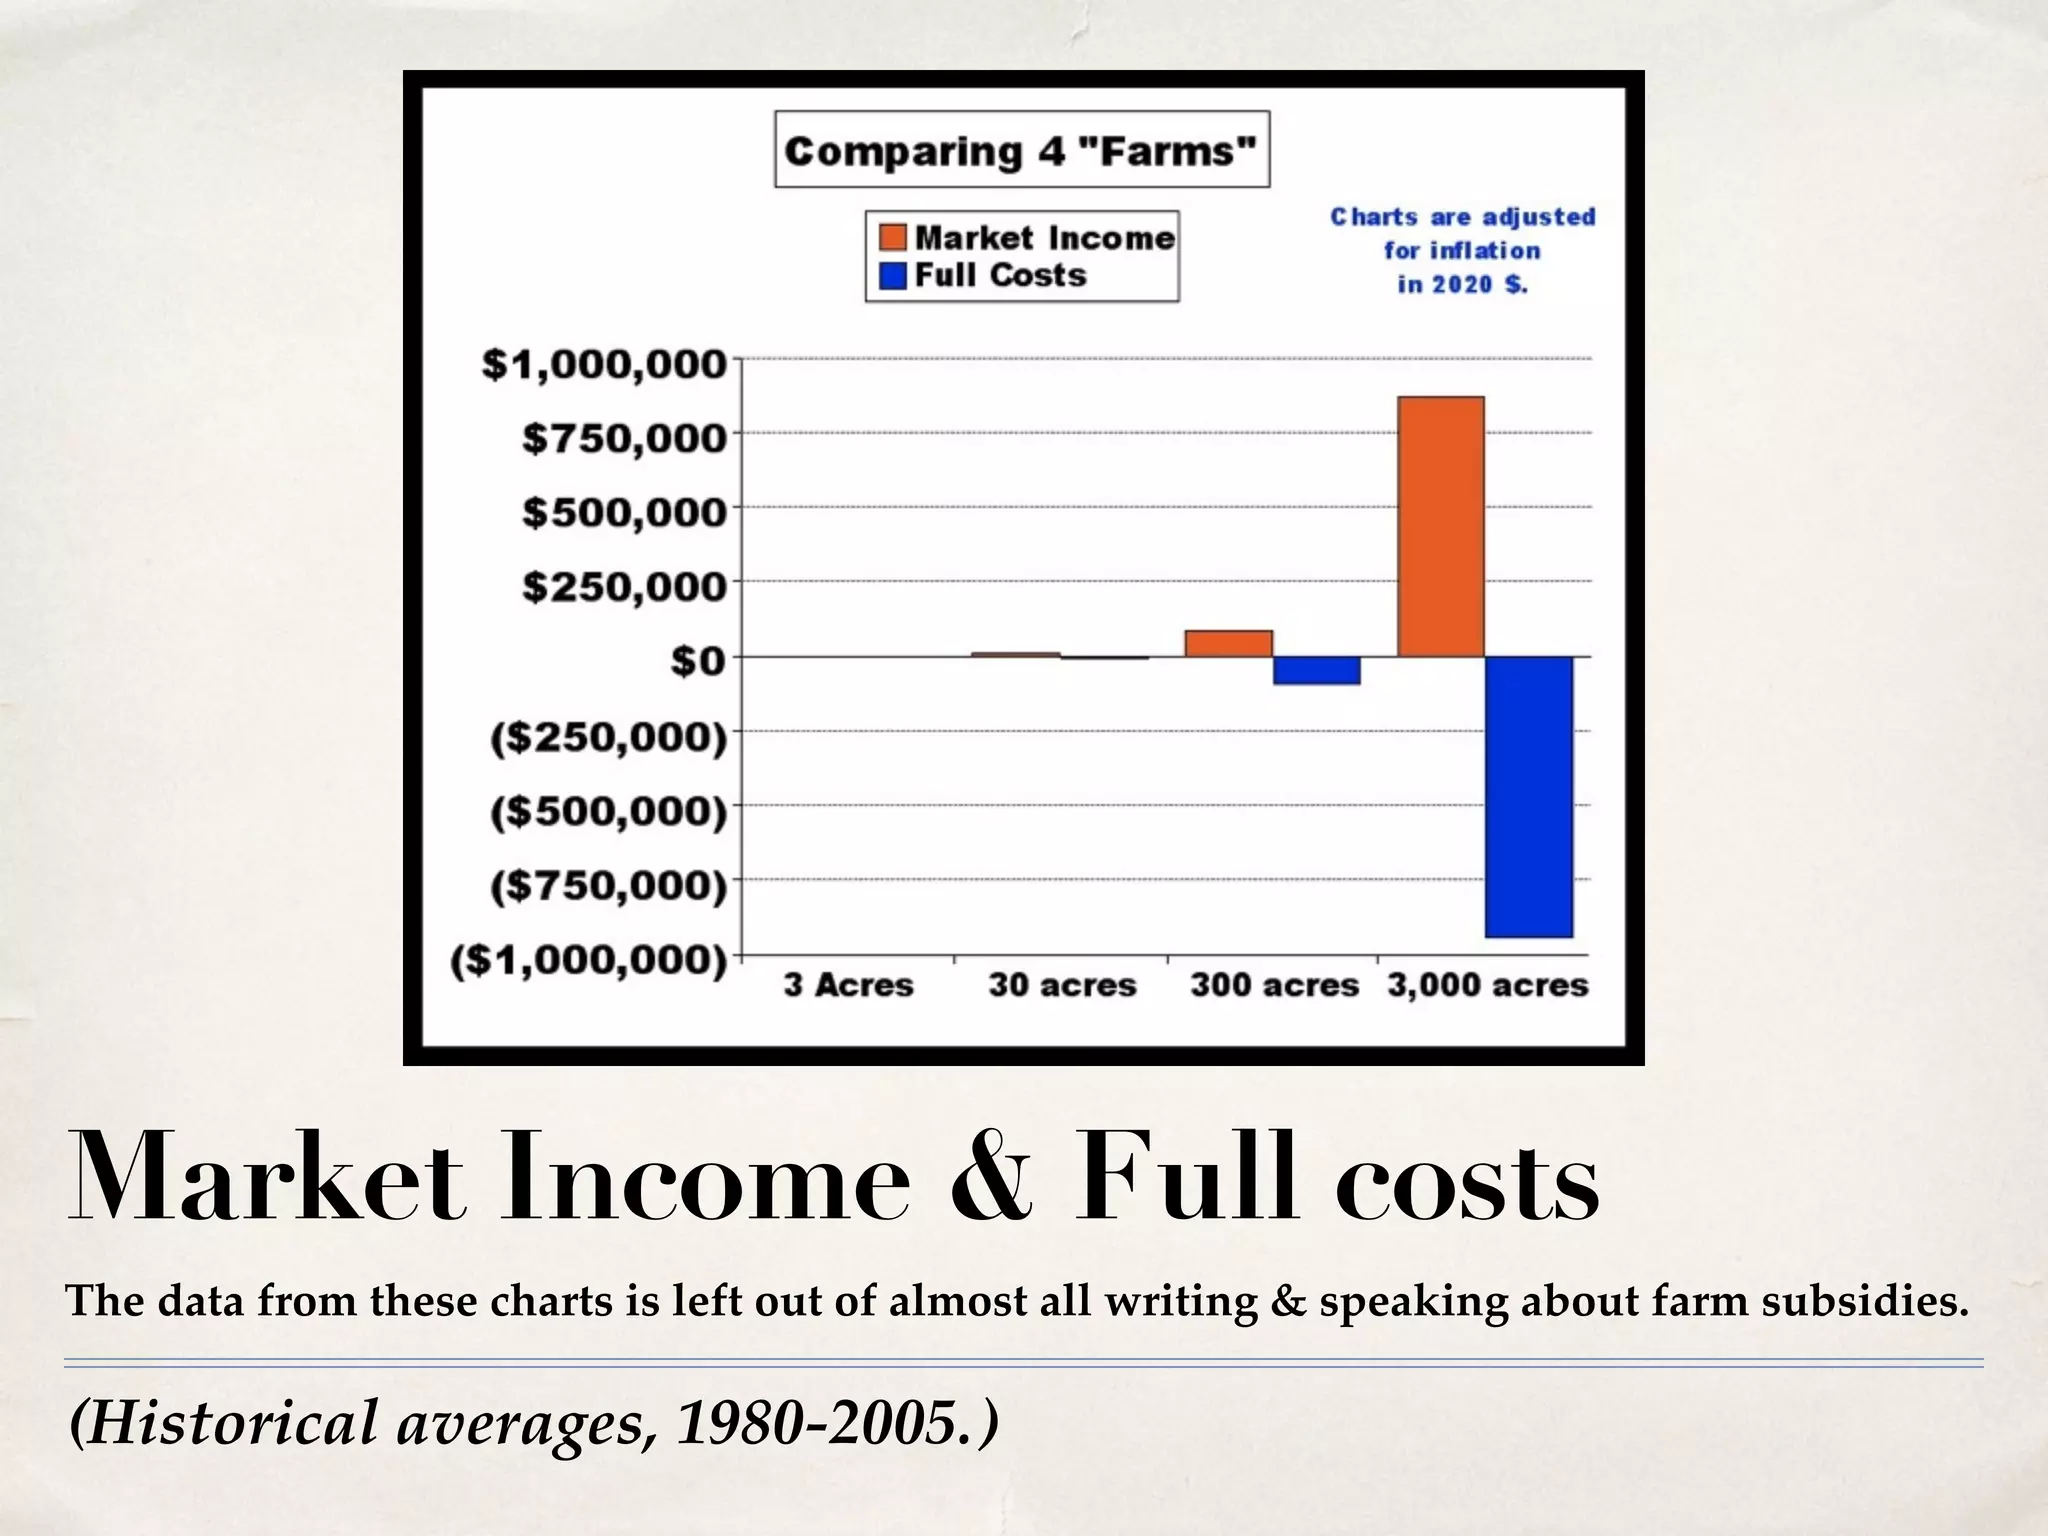
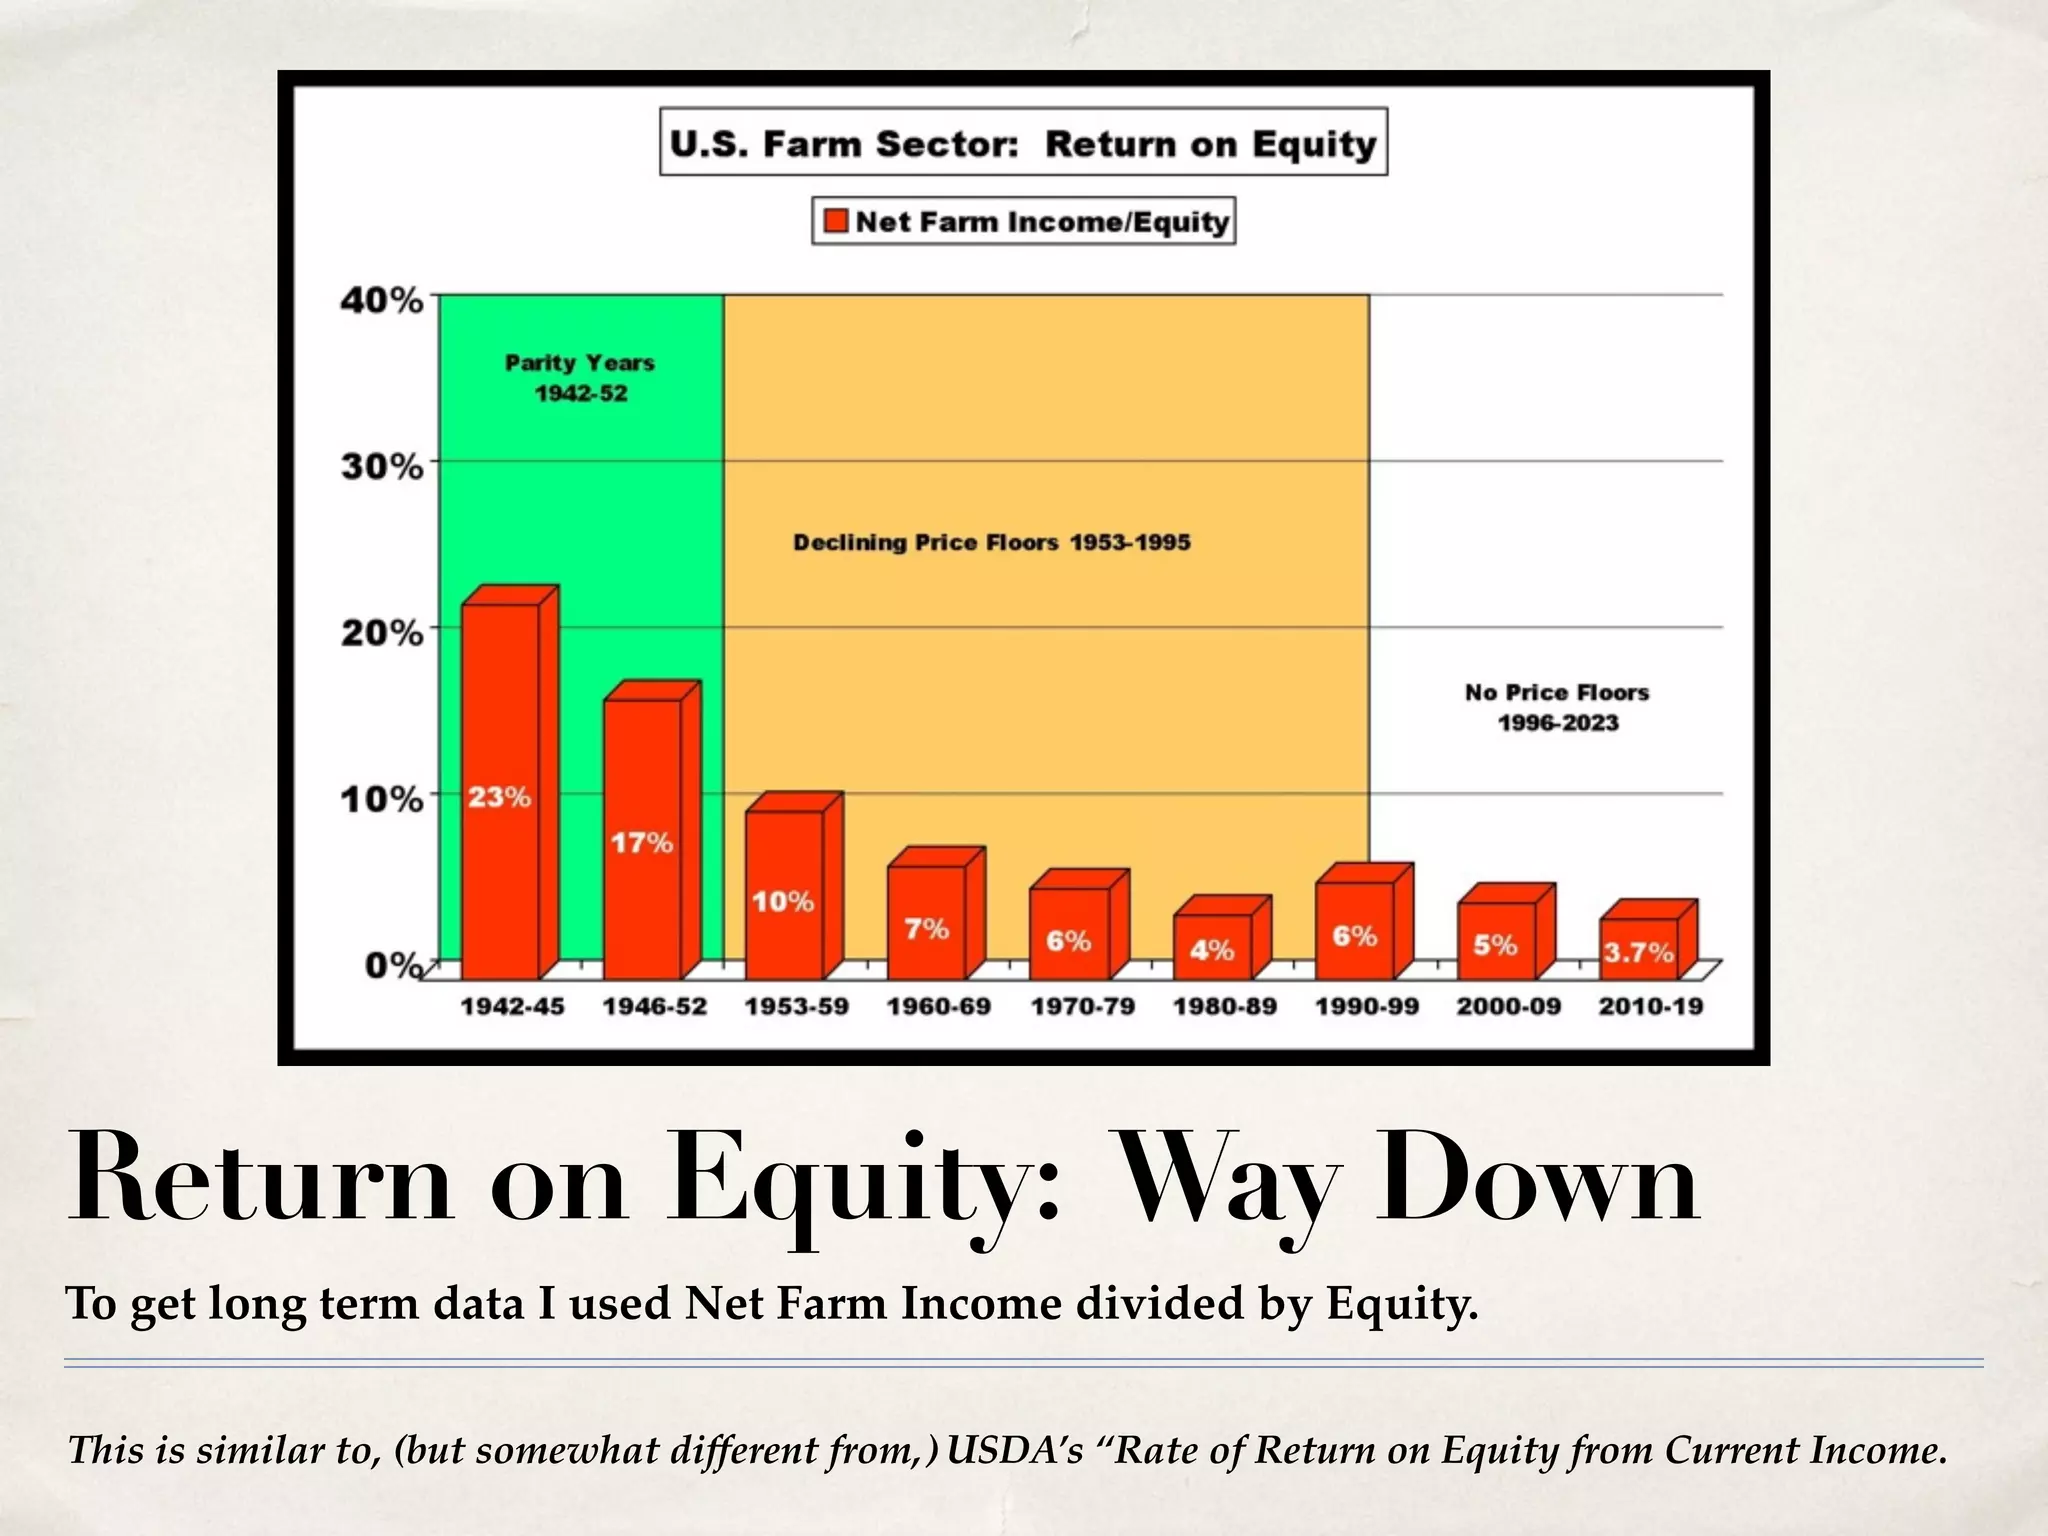
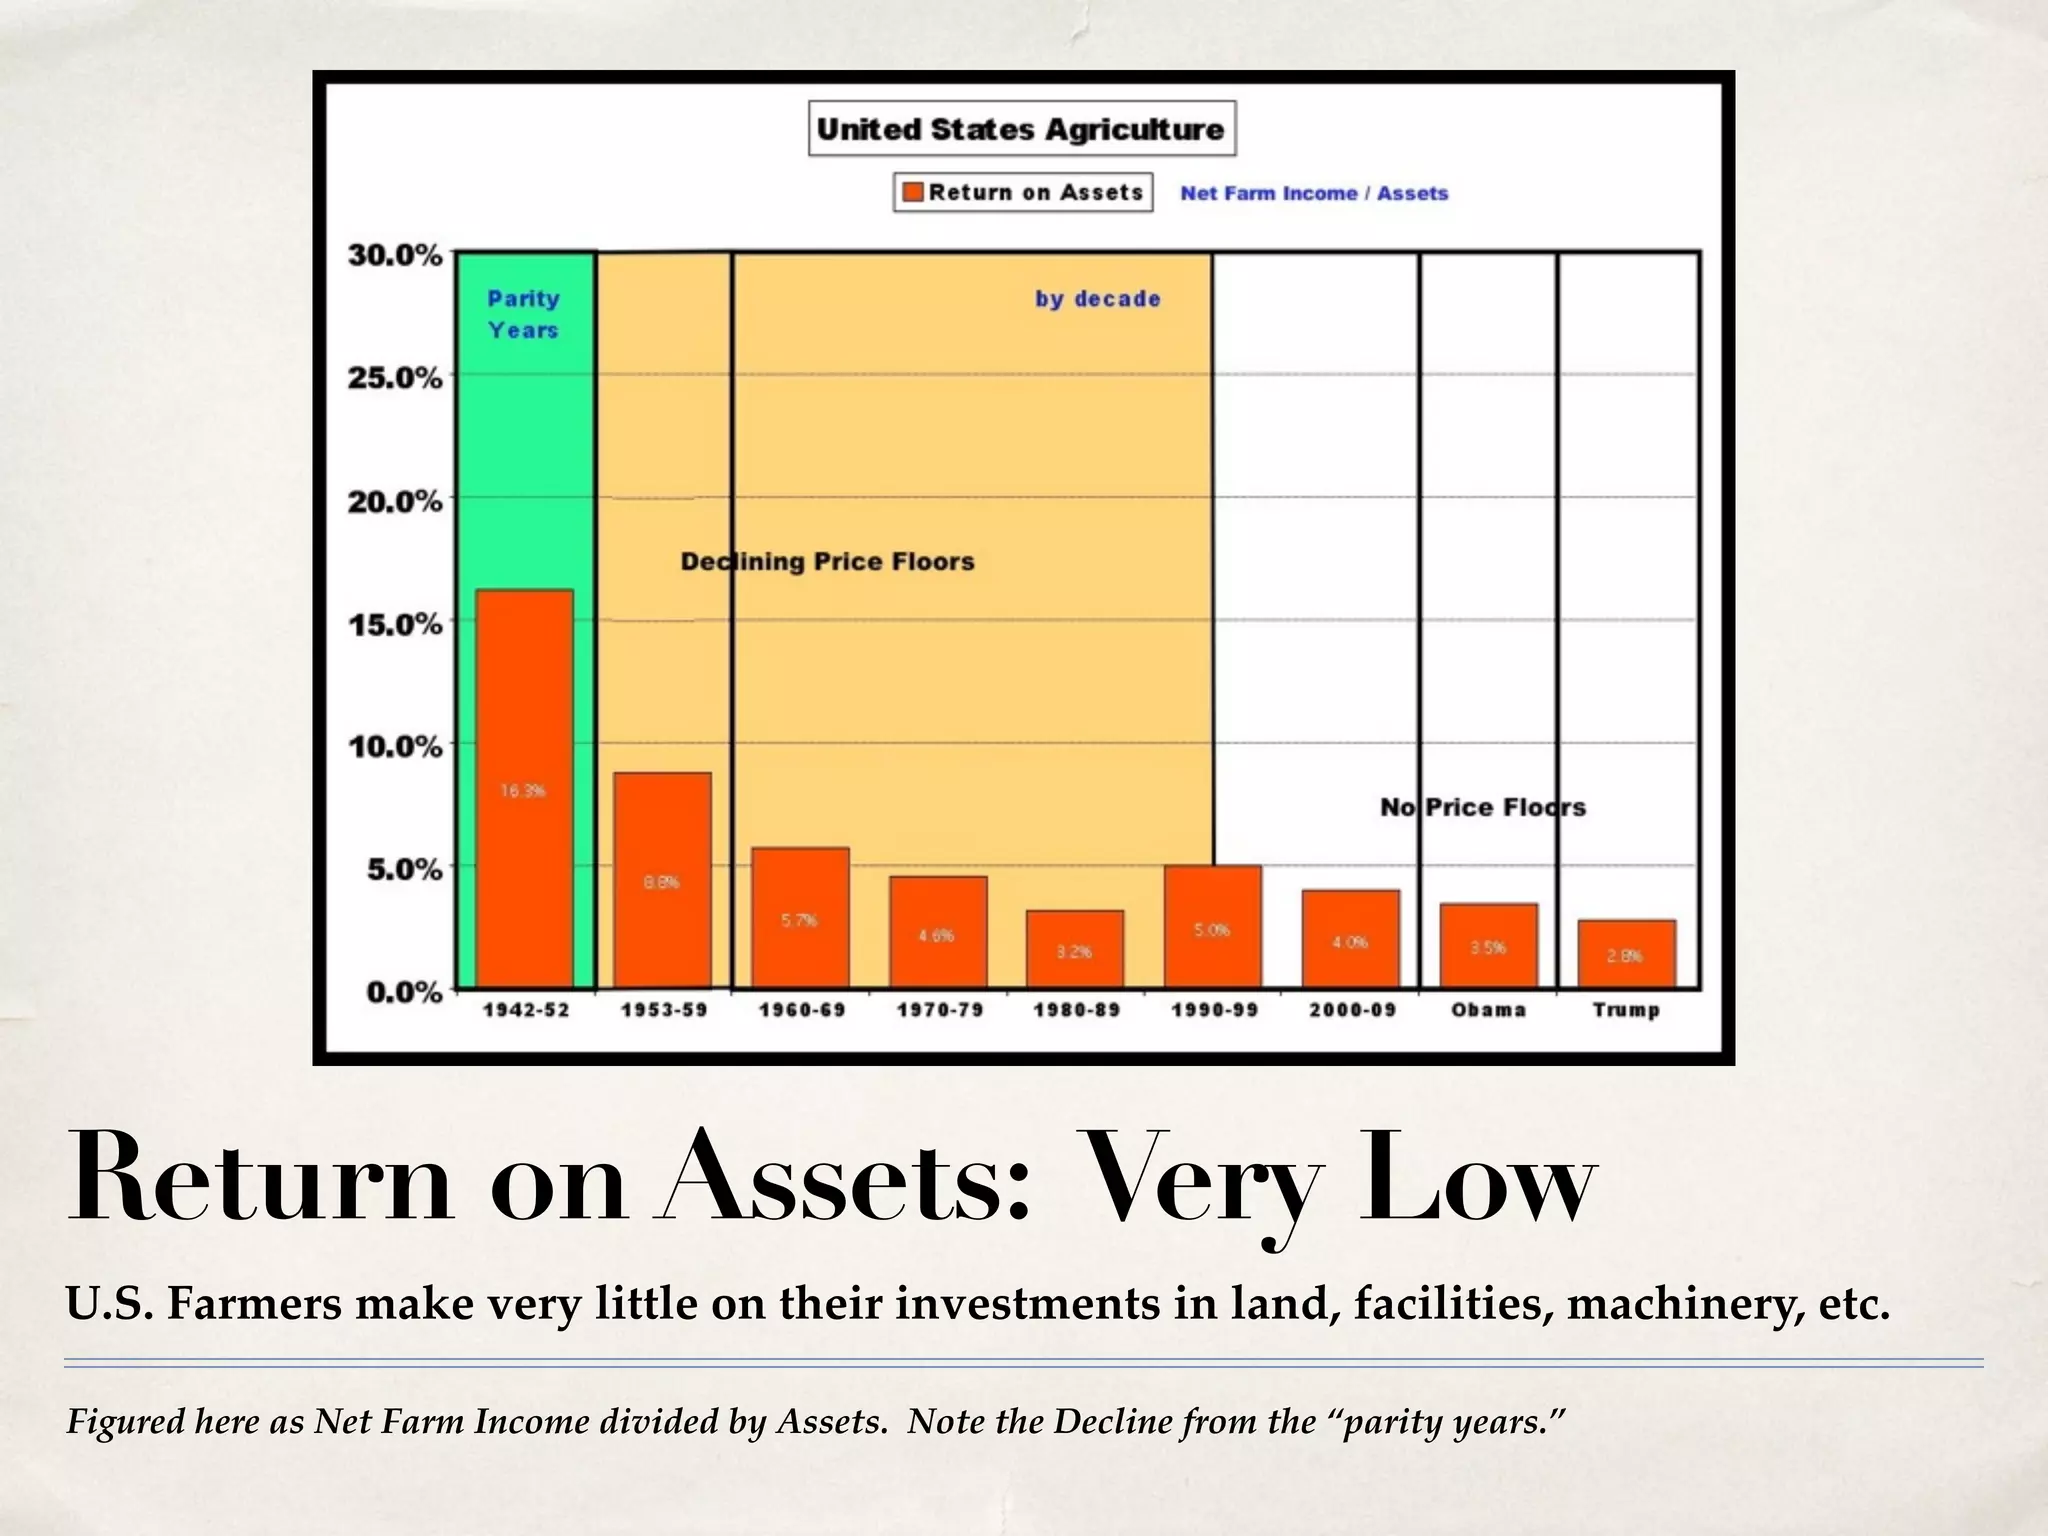
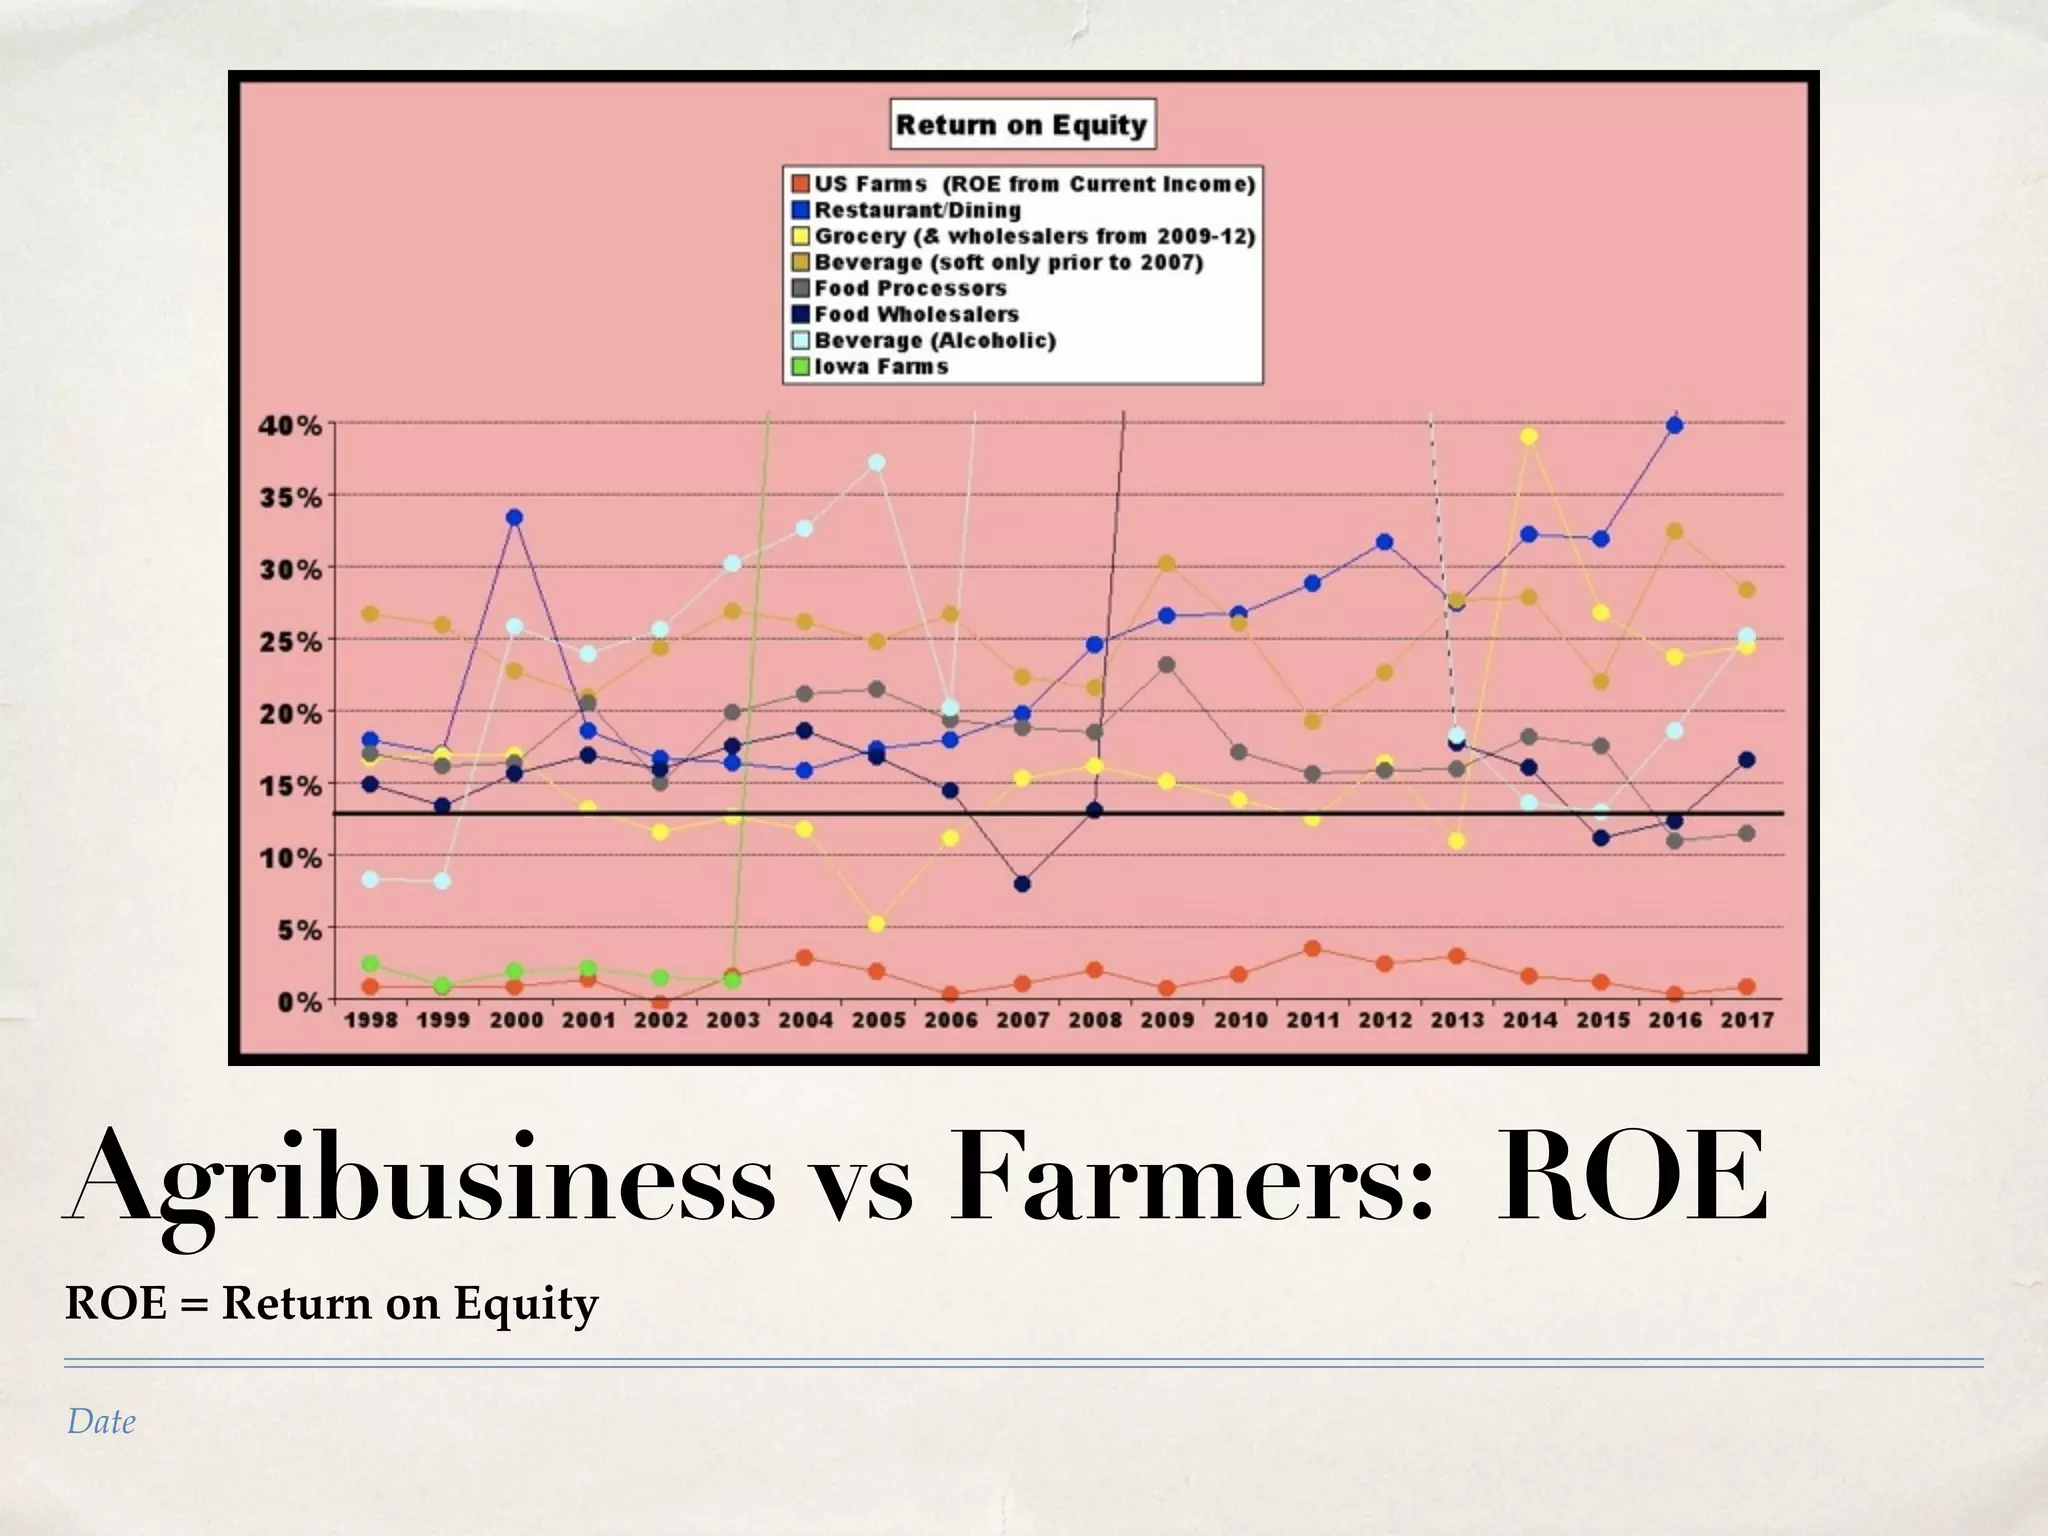
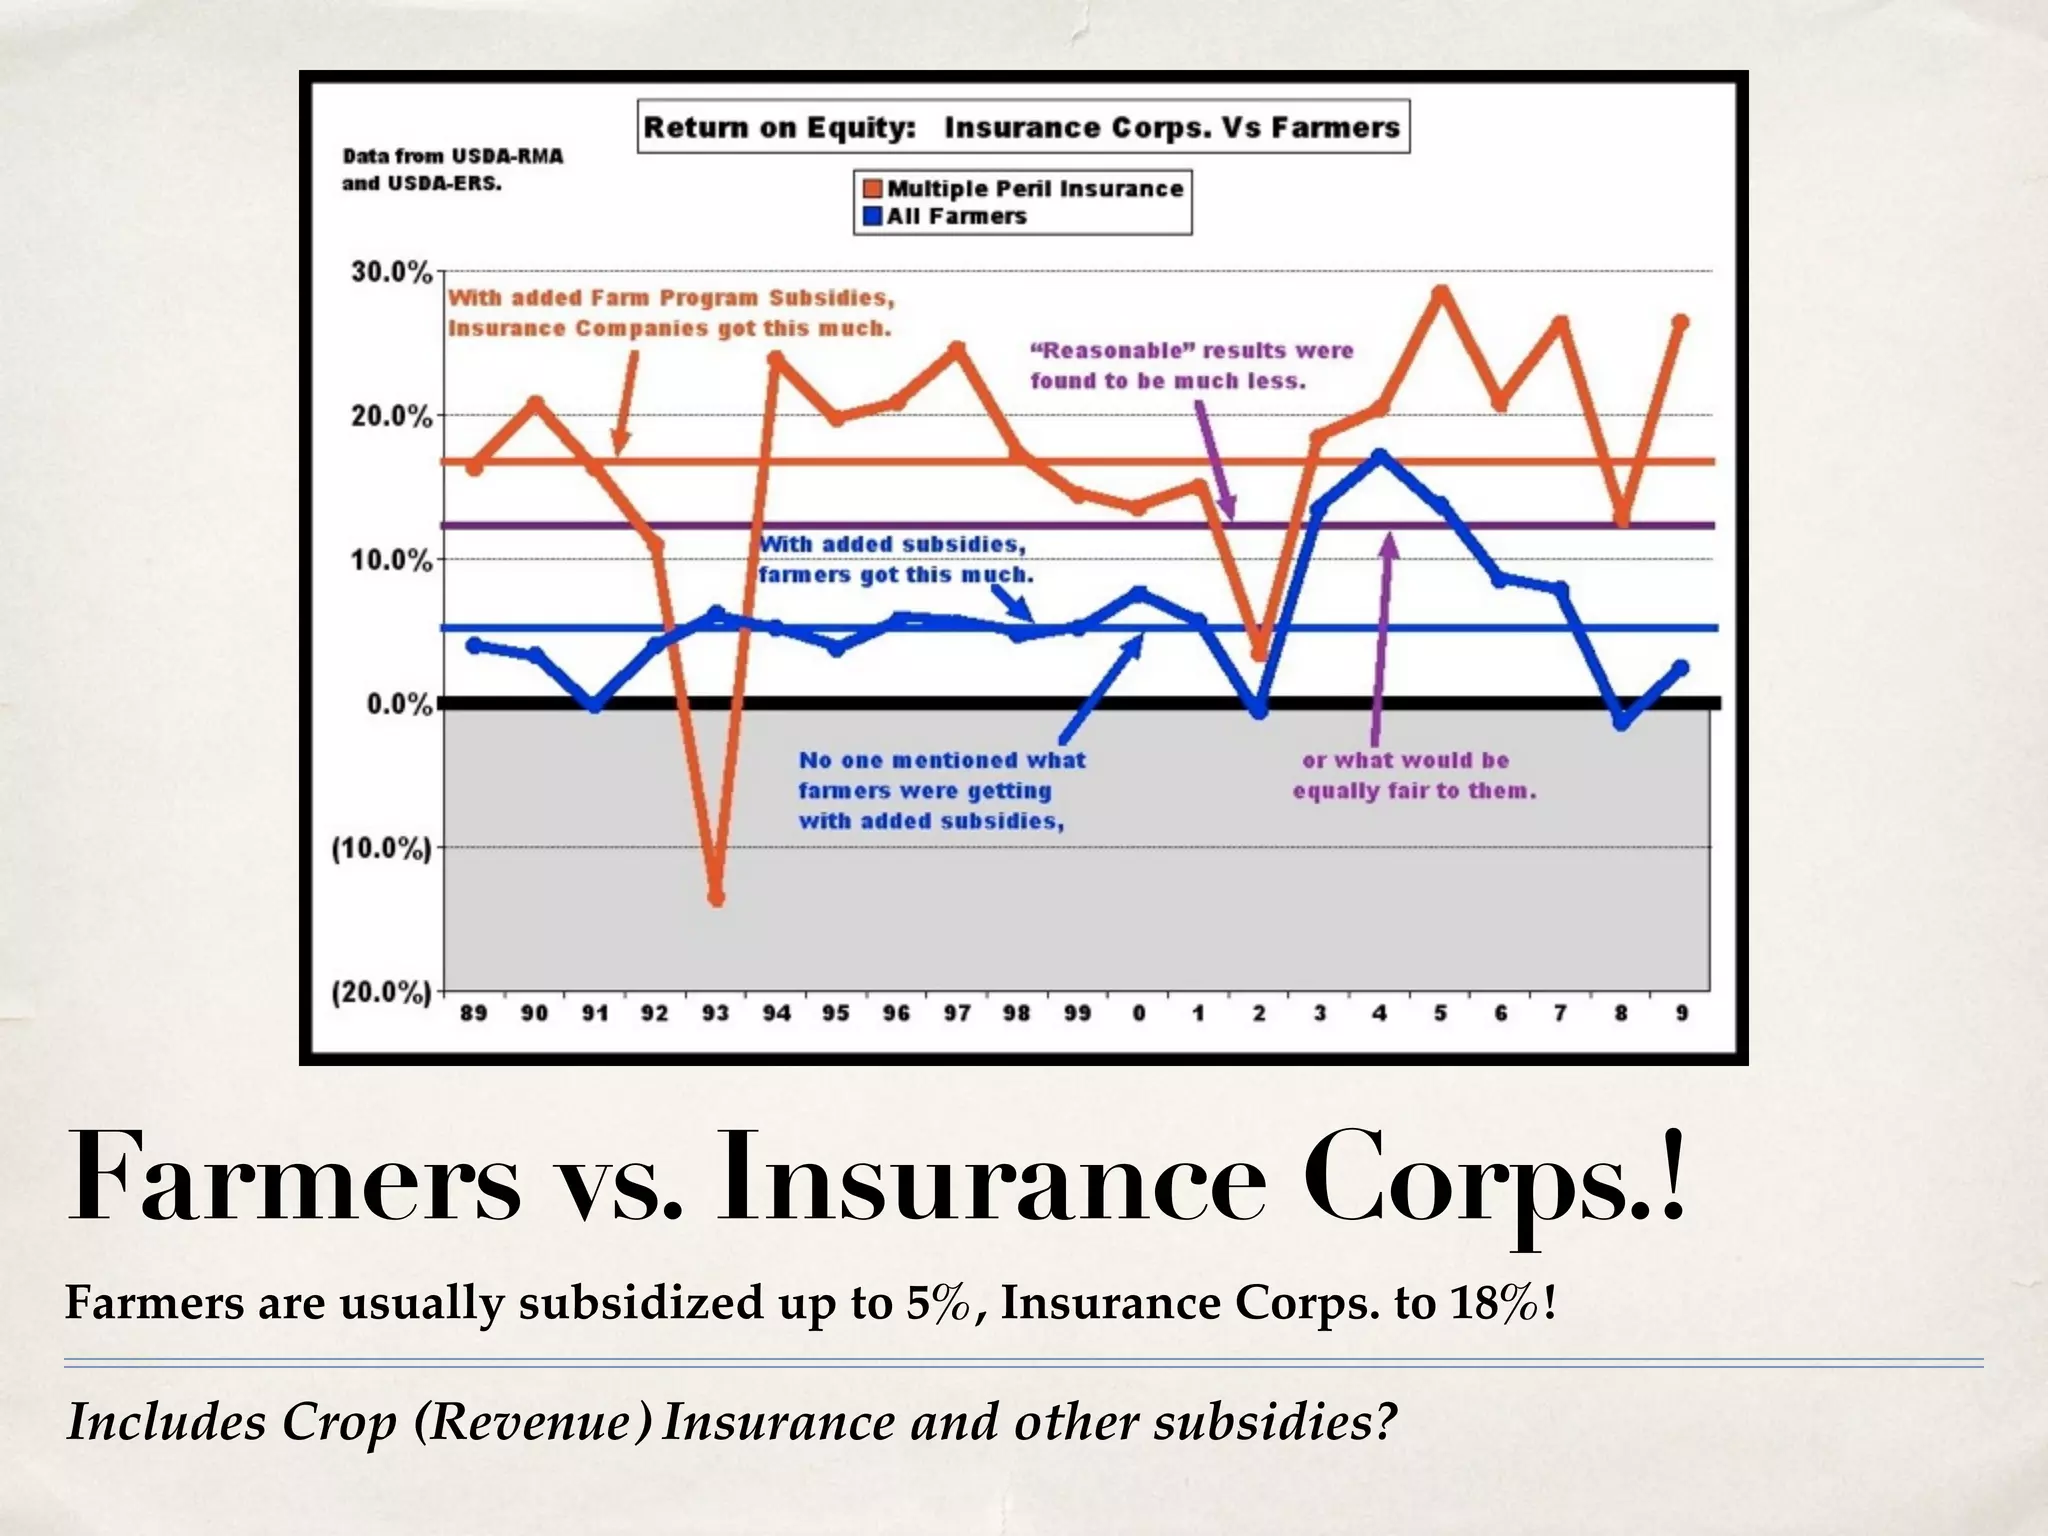

The document discusses the evolution of Democratic Party farm bills from the Great Depression through the 21st century, highlighting economic measures like price ceilings and floors intended to protect both consumers and farmers. It details the impact of policy changes since the 1996 'freedom to farm' bill, which contributed to increasing farm income volatility and rising farm debt. Key themes include historical farm subsidy disparities and the financial struggles faced by smaller farms in comparison to larger agribusinesses.