SlideShare a Scribd company logo
1 of 7
Download to read offline
Julio Guzmán C.
julio.guzman.c@uai.cl
Fernando Medina G.
fernando.medina@uai.cl
Índice de Competitividad Global 2015-2016
Análisis de los Resultados de Chile
World Economic Forum – Escuela de Gobierno, UAI
Septiembre 2015
El 30 de septiembre de 2015, el Foro Económico Mundial y la Escuela de Gobierno de la
Universidad Adolfo Ibáñez, institución socia del Foro en su programa de competitividad, lanzaron el
Informe de Competitividad Mundial 2015-2016 (ver http://www.weforum.org/issues/global-
competitiveness).
En esta nueva entrega del informe, Chile retrocedió dos puestos en el Índice de Competitividad
Global (ICG) respecto al año 2014, ubicándose en el lugar 35 entre 140 países1. Pese a mejoras
puntuales en 2007, 2010 y 2014, esto confirma una tendencia negativa en la posición de Chile desde
2004 a la fecha. (Gráfico N°1).
Gráfico N°1
Fuente: Elaboración en base a datos WEF-UAI
1
Este año fuimos sobrepasados por República Checa (37 en 2014, 31 en 2015), España (35 en 2014, 33 en 2015) y Kuwait (40 en
2014, 34 en 2015). En consecuencia, Chile descendió del puesto 33 en 2014 al puesto 35 en 2015 (Puerto Rico, que estaba en el
lugar 32 en 2014 no fue incluido en la medición 2015, por lo que sólo bajamos dos puestos y no tres).
22 23
27 26
28
30 30 31
33 34 33
35
57
65 66
72
64
56
58
53
48
56 57
75
48
55
58
52
60 60
66
58
53
55
61
57
67 68
74
86
83
78
73
67
61 61
65
69
64
57
65
69
74
69 68 68 69 69
66
61
20
24
28
32
36
40
44
48
52
56
60
64
68
72
76
80
84
88
92
Chile: ranking histórico Indice de Competitividad Global (ICG) WEF-UAI
Chile Brazil México Perú Colombia
Julio Guzmán C.
julio.guzman.c@uai.cl
Fernando Medina G.
fernando.medina@uai.cl
En términos comparativos, Chile continúa liderando la región. Este año se amplía la brecha en
términos del índice de competitividad entre Chile, Perú (69) y Brasil (75), pero se reduce entre Chile,
México (57) y Colombia (61). Estos movimientos se deben a la caída en el ranking de los dos
primeros países y a la subida en el ranking de los dos últimos.
Respecto a las fortalezas del país, al observar los 3 subíndices y los 12 pilares a partir de los cuales
se construye el ICG (Gráfico N°2), se observa que el desarrollo del mercado financiero (21), el
entorno macroeconómico (29) y la calidad de las instituciones (32) sobresalen. En tanto que las
principales debilidades del país, se encuentran en la salud y educación primaria (74), la eficiencia del
mercado laboral (63) y la sofisticación de los negocios (53).
Gráfico N°2
Fuente: Elaboración en base a datos WEF-UAI
En comparación con el año 2014, se avanzó en tan sólo 3 de los 12 pilares del ICG (Infraestructura,
Tecnología y Sofisticación en los Negocios) y se retrocedió en los 9 pilares restantes. En cuanto a
los subíndices, el mayor retroceso corresponde al subíndice de Requerimientos Básicos (baja del
lugar 30 al 36), seguido por el subíndice Potenciadores de Eficiencia (baja del lugar 29 al 31) y el
subíndice Sofisticación e Innovación (baja del lugar 49 al 50). La Figura adjunta da cuenta de la
agrupación de pilares en subíndices.
48
55
49
41
42
19
50
34
32
29
70
22
49
28
30
50
53
50
44
39
21
63
40
33
31
74
29
45
32
36
0 10 20 30 40 50 60 70 80
Innovación
Sofisticación Negocios
SOFISTICACIÓN E INNOVACIÓN (23.7%)
Tamaño del Mercado
Tecnología
Desarrollo Mercado Financiero
EficienciaMercado Laboral
Eficienciamercado de bienes
Educación superior y capacitación
POTENCIADORES DE EFICIENCIA (50%)
Salud y educación primaria
Entorno Macroeconómico
Infraestructura
Instituciones
REQUERIMIENTOS BÁSICOS (26.3%)
Posición en el ranking
Índice de Competitividad Global WEF-UAI
Ranking según Subíndices y Pilares, Chile 2014 y 2015
Chile 2015 Chile 2014
Julio Guzmán C.
julio.guzman.c@uai.cl
Fernando Medina G.
fernando.medina@uai.cl
En términos comparativos con los países de la OCDE (Gráfico N°3), aún existen brechas relevantes
en cuanto a la competitividad de Chile versus este grupo de naciones. Los principales pilares
respecto a las cuales Chile se encuentra rezagado son salud y educación primaria, tecnología,
sofisticación de los negocios, innovación e infraestructura.
Gráfico N°3
Fuente: Elaboración en base a datos WEF-UAI
Agrupación de los pilares en subíndices
Fuente: WEF
Requerimientos Básicos:
• Instituciones
• Infraestructura
• Entorno Macroeconómico
• Salud y educación primaria
Factores de Sofisticación e Innovación:
• Sofisticación en los negocios
• Innovación
Potenciadores de Eficiencia:
• Educación superior y capacitación
• Eficiencia del mercado de bienes
• Eficiencia del mercado laboral
• Desarrollo del mercado financiero
• Disposición de tecnología
• Tamaño del mercado
Claves para economías impulsadas por:
FACTORES
Clave para economías impulsadas por:
EFICIENCIA
Clave para economías impulsadas por:
INNOVACIÓN
0.0
1.0
2.0
3.0
4.0
5.0
6.0
7.0
Instituciones
Infraestructura
Entorno
Macroeconómico
Salud y educación
primaria
Educaciónsuperior y
capacitación
Eficienciamercadode
bienes
EficienciaMercado
Laboral
DesarrolloMercado
Financiero
Tecnología
Tamaño del Mercado
Sofisticación
Negocios
Innovación
LAC
OCDE
Chile
Julio Guzmán C.
julio.guzman.c@uai.cl
Fernando Medina G.
fernando.medina@uai.cl
¿Qué es y para qué sirve la competitividad de un país?
La competitividad de un país corresponde al conjunto de instituciones, políticas y factores que
determinan el nivel de productividad de un país. A su vez, el nivel de productividad de un país
determina la capacidad que tiene su economía para crecer y desarrollarse en el tiempo. Una
economía más competitiva es una economía más preparada para mantener un ritmo de crecimiento
potencial alto y sostenido.
¿Cómo se mide el Índice de Competitividad Global del WEF?
El Índice de Competitividad Global, ICG, se mide anualmente sobre la base de tres subíndices:
Requerimientos Básicos (26.3%), Potenciadores de Eficiencia (50%) y Factores de Sofisticación e
Innovación (23.7%). Estos subíndices están compuestos a su vez por doce pilares, tales como
Instituciones, Infraestructura, Eficiencia del Mercado Laboral, Desarrollo Financiero, entre otros.
Estos pilares se construyen a partir de 114 indicadores que se calculan a partir de datos “duros”,
tales como deuda pública, esperanza de vida, asistencia escolar, entre otros, y de datos cualitativos
recolectados por la Encuesta de Opinión Ejecutiva, que en el caso de Chile es aplicada anualmente
por la Escuela de Gobierno de la Universidad Adolfo Ibáñez, en su carácter de institución socia del
WEF.
The Global Competitiveness Report 2015–2016 | xv
Note: The Global Competitiveness Index captures the fundamentals of an economy. Recent developments, including currency (e.g., Switzerland) and commodity price fluctuations (e.g., Azerbaijan,
Qatar, Saudi Arabia), geopolitical uncertainties (e.g., Ukraine), and security issues (e.g., Turkey) must be kept in mind when interpreting the results.
1 Scale ranges from 1 to 7.
2 This shows the rank out of the 144 economies in the GCI 2014–2015.
3 The trend line shows the evolution in percentile rank since 2007; breaks in the trend line reflect years when the economy was not included in the GCI.
Economy Score1
Prev.2
Trend3
Switzerland 5.76 1
Singapore 5.68 2
United States 5.61 3
Germany 5.53 5
Netherlands 5.50 8
Japan 5.47 6
Hong Kong SAR 5.46 7
Finland 5.45 4
Sweden 5.43 10
United Kingdom 5.43 9
Norway 5.41 11
Denmark 5.33 13
Canada 5.31 15
Qatar 5.30 16
Taiwan, China 5.28 14
New Zealand 5.25 17
United Arab Emirates 5.24 12
Malaysia 5.23 20
Belgium 5.20 18
Luxembourg 5.20 19
Australia 5.15 22
France 5.13 23
Austria 5.12 21
Ireland 5.11 25
Saudi Arabia 5.07 24
Korea, Rep. 4.99 26
Israel 4.98 27
China 4.89 28
Iceland 4.83 30
Estonia 4.74 29
Czech Republic 4.69 37
Thailand 4.64 31
Spain 4.59 35
Kuwait 4.59 40
Chile 4.58 33
Lithuania 4.55 41
Indonesia 4.52 34
Portugal 4.52 36
Bahrain 4.52 44
Azerbaijan 4.50 38
Poland 4.49 43
Kazakhstan 4.49 50
Italy 4.46 49
Latvia 4.45 42
Russian Federation 4.44 53
Mauritius 4.43 39
Philippines 4.39 52
Economy Score1
Prev.2
Trend3
El Salvador 3.87 84
Zambia 3.87 96
Seychelles 3.86 92
Dominican Republic 3.86 101
Kenya 3.85 90
Nepal 3.85 102
Lebanon 3.84 113
Kyrgyz Republic 3.83 108
Gabon 3.83 106
Mongolia 3.81 98
Bhutan 3.80 103
Argentina 3.79 104
Bangladesh 3.76 109
Nicaragua 3.75 99
Ethiopia 3.75 118
Senegal 3.73 112
Bosnia & Herzegovina 3.71 n/a
Cape Verde 3.70 114
Lesotho 3.70 107
Cameroon 3.69 116
Uganda 3.66 122
Egypt 3.66 119
Bolivia 3.60 105
Paraguay 3.60 120
Ghana 3.58 111
Tanzania 3.57 121
Guyana 3.56 117
Benin 3.55 n/a
Gambia, The 3.48 125
Nigeria 3.46 127
Zimbabwe 3.45 124
Pakistan 3.45 129
Mali 3.44 128
Swaziland 3.40 123
Liberia 3.37 n/a
Madagascar 3.32 130
Myanmar 3.32 134
Venezuela 3.30 131
Mozambique 3.20 133
Haiti 3.18 137
Malawi 3.15 132
Burundi 3.11 139
Sierra Leone 3.06 138
Mauritania 3.03 141
Chad 2.96 143
Guinea 2.84 144
Economy Score1
Prev.2
Trend3
Malta 4.39 47
South Africa 4.39 56
Panama 4.38 48
Turkey 4.37 45
Costa Rica 4.33 51
Romania 4.32 59
Bulgaria 4.32 54
India 4.31 71
Vietnam 4.30 68
Mexico 4.29 61
Rwanda 4.29 62
Slovenia 4.28 70
Macedonia, FYR 4.28 63
Colombia 4.28 66
Oman 4.25 46
Hungary 4.25 60
Jordan 4.23 64
Cyprus 4.23 58
Georgia 4.22 69
Slovak Republic 4.22 75
Sri Lanka 4.21 73
Peru 4.21 65
Montenegro 4.20 67
Botswana 4.19 74
Morocco 4.17 72
Uruguay 4.09 80
Iran, Islamic Rep. 4.09 83
Brazil 4.08 57
Ecuador 4.07 n/a
Croatia 4.07 77
Guatemala 4.05 78
Ukraine 4.03 76
Tajikistan 4.03 91
Greece 4.02 81
Armenia 4.01 85
Lao PDR 4.00 93
Moldova 4.00 82
Namibia 3.99 88
Jamaica 3.97 86
Algeria 3.97 79
Honduras 3.95 100
Trinidad and Tobago 3.94 89
Cambodia 3.94 95
Côte d’Ivoire 3.93 115
Tunisia 3.93 87
Albania 3.93 97
Serbia 3.89 94
Emerging and
Developing Asia
1
10
19
28
37
46
4
13
22
31
40
7
16
25
34
43
2
11
20
29
38
47
5
14
23
32
41
8
17
26
35
44
3
12
21
30
39
6
15
24
33
42
9
18
27
36
45
99
108
117
120
126
135
102
111
129
138
105
114
123
132
100
118
127
136
103
112
121
130
139
106
115
124
133
101
110
119
128
137
104
113
122
131
140
107
116
125
134
97
95
98
96
109
50
59
68
77
86
53
62
71
80
89
56
65
74
83
92
51
60
69
78
54
72
81
90
57
66
75
93
52
61
70
79
88
55
64
73
82
91
58
67
76
85
94
84
48
63
87
49
Advanced
Economies
Middle East,
North Africa, and Pakistan
Latin America
and the Caribbean
Commonwealth of
Independent States
Emerging and
Developing Europe
!"#$%#&'()*)+'
!"#$%#&'()*)+'
!"#$%#&'()*)+'
!"#$%#&'()*)+'
!"#$%#&'()*)+'
!"#$%#&'()*)+'
!"#$%#&'()*)+'
!"#$%#&'()*)+'
!"#$%#&'()*)+'!"#$%#&'()*)+'
The Global Competitiveness Index 2015–2016 Rankings
Sub-Saharan
Africa
© 2015 World Economic Forum
0 5 10 15 20 25 30
5,000
10,000
15,000
20,000
25,000
Institutions
Infrastructure
Macroeconomic
environment
Health and
primary
education
Higher education
and training
Goods market
efficiency
Labor market efficiency
Financial market
development
Technological
readiness
Market size
Business
sophistication
Innovation
1
2
3
4
5
6
7
Key indicators, 2014
Population (millions)........................................ 17.8
GDP (US$ billions) ........................................ 258.0
GDP per capita (US$)................................. 14,477
GDP (PPP) as share (%) of world total............ 0.38
Global Competitiveness Index
GCI 2015–2016......................................................35..... 4.6
GCI 2014–2015 (out of 144)..................................... 33......4.6
GCI 2013–2014 (out of 148)..................................... 34......4.6
GCI 2012–2013 (out of 144)..................................... 33......4.6
Basic requirements (26.3%).......................................36 ......5.1
1st pillar: Institutions................................................. 32......4.6
2nd pillar: Infrastructure............................................ 45......4.6
3rd pillar: Macroeconomic environment.................... 29......5.6
4th pillar: Health and primary education ................... 74......5.6
Efficiency enhancers (50.0%).....................................31 ......4.7
5th pillar: Higher education and training ................... 33......5.0
6th pillar: Goods market efficiency............................ 40......4.6
7th pillar: Labor market efficiency ............................. 63......4.3
8th pillar: Financial market development................... 21......4.6
9th pillar: Technological readiness ............................ 39......4.8
10th pillar: Market size.............................................. 44......4.6
Innovation and sophistication factors (23.7%)...........50 ......3.8
11th pillar: Business sophistication .......................... 53......4.1
12th pillar: Innovation ............................................... 50......3.5
The most problematic factors for doing business
Restrictive labor regulations...............................................18.0
Inadequately educated workforce......................................15.8
Inefficient government bureaucracy ...................................14.6
Insufficient capacity to innovate...........................................9.5
Complexity of tax regulations...............................................7.9
Inadequate supply of infrastructure......................................6.8
Tax rates..............................................................................5.7
Access to financing .............................................................5.6
Policy instability ...................................................................4.9
Poor work ethic in labor force..............................................4.0
Crime and theft ...................................................................3.0
Poor public health ...............................................................2.1
Corruption ...........................................................................1.3
Government instability/coups ..............................................0.4
Inflation................................................................................0.4
Foreign currency regulations................................................0.1
Chile
Chile Latin America and the Caribbean
GDP (PPP) per capita (int’l $), 1990–2014
Rank Score
(out of 140) (1–7)
Score*
2: Country/Economy Profiles
138 | The Global Competitiveness Report 2015–2016
Factor
driven
Efficiency
driven
Innovation
driven
1
Transition
1–2 2
Transition
2–3 3
Stage of development
* From the list of factors, respondents were asked to select the five most problematic for doing business in their country and to rank them between 1 (most problematic) and 5. The score
corresponds to the responses weighted according to their rankings.
Chile Latin America and the Caribbean
© 2015 World Economic Forum
INDICATOR VALUE RANK/140
6th pillar: Goods market efficiency (cont’d.)
6.06 No. procedures to start a business*.......................... 7............76
6.07 No. days to start a business* ................................. 5.5............24
6.08 Agricultural policy costs.......................................... 4.6............19
6.09 Prevalence of non-tariff barriers.............................. 4.9............14
6.10 Trade tariffs, % duty*.............................................. 4.6............65
6.11 Prevalence of foreign ownership............................. 5.4............16
6.12 Business impact of rules on FDI............................. 5.2............24
6.13 Burden of customs procedures.............................. 4.9............29
6.14 Imports as a percentage of GDP* ........................ 33.6............97
6.15 Degree of customer orientation.............................. 4.4............82
6.16 Buyer sophistication............................................... 4.0............28
7th pillar: Labor market efficiency
7.01 Cooperation in labor-employer relations ................. 4.5............55
7.02 Flexibility of wage determination............................. 5.8............12
7.03 Hiring and firing practices....................................... 3.3..........110
7.04 Redundancy costs, weeks of salary*.................... 27.4..........117
7.05 Effect of taxation on incentives to work.................. 4.6............19
7.06 Pay and productivity............................................... 4.2............54
7.07 Reliance on professional management................... 4.6............42
7.08 Country capacity to retain talent............................. 4.8............16
7.09 Country capacity to attract talent ........................... 4.2............22
7.10 Women in labor force, ratio to men*..................... 0.69............98
8th pillar: Financial market development
8.01 Availability of financial services ............................... 5.5............21
8.02 Affordability of financial services ............................. 4.9............41
8.03 Financing through local equity market.................... 4.5............24
8.04 Ease of access to loans ......................................... 3.7............20
8.05 Venture capital availability....................................... 3.3............32
8.06 Soundness of banks .............................................. 6.3..............9
8.07 Regulation of securities exchanges ........................ 5.4............19
8.08 Legal rights index, 0–12 (best)* ................................. 4............80
9th pillar: Technological readiness
9.01 Availability of latest technologies ............................ 5.6............33
9.02 Firm-level technology absorption............................ 5.2............38
9.03 FDI and technology transfer ................................... 5.2............14
9.04 Individuals using Internet, %* ............................... 72.4............36
9.05 Fixed-broadband Internet subscriptions/100 pop.* 14.1............56
9.06 Int’l Internet bandwidth, kb/s per user* ................ 73.1............39
9.07 Mobile-broadband subscriptions/100 pop.* ......... 50.5............55
10th pillar: Market size
10.01 Domestic market size index, 1–7 (best)*................. 4.4............41
10.02 Foreign market size index, 1–7 (best)*.................... 5.1............49
10.03 GDP (PPP$ billions)* .......................................... 409.3............42
10.04 Exports as a percentage of GDP* ........................ 33.7............85
11th pillar: Business sophistication
11.01 Local supplier quantity ........................................... 4.4............80
11.02 Local supplier quality.............................................. 4.7............43
11.03 State of cluster development.................................. 3.7............72
11.04 Nature of competitive advantage............................ 3.3............82
11.05 Value chain breadth................................................ 3.9............58
11.06 Control of international distribution......................... 4.1............39
11.07 Production process sophistication.......................... 4.4............40
11.08 Extent of marketing................................................ 4.8............30
11.09 Willingness to delegate authority............................ 3.7............71
12th pillar: Innovation
12.01 Capacity for innovation........................................... 3.8............85
12.02 Quality of scientific research institutions ................. 4.1............48
12.03 Company spending on R&D................................... 3.0............92
12.04 University-industry collaboration in R&D ................. 4.2............39
12.05 Gov’t procurement of advanced tech products...... 3.1............89
12.06 Availability of scientists and engineers.................... 4.6............32
12.07 PCT patents, applications/million pop.*.................. 7.1............43
INDICATOR VALUE RANK/140
1st pillar: Institutions
1.01 Property rights ....................................................... 5.1............35
1.02 Intellectual property protection ............................... 4.2............49
1.03 Diversion of public funds........................................ 4.6............31
1.04 Public trust in politicians......................................... 3.3............53
1.05 Irregular payments and bribes................................ 5.5............28
1.06 Judicial independence............................................ 5.0............31
1.07 Favoritism in decisions of government officials ....... 3.6............42
1.08 Wastefulness of government spending................... 4.2............21
1.09 Burden of government regulation ........................... 3.7............45
1.10 Efficiency of legal framework in settling disputes.... 4.0............47
1.11 Efficiency of legal framework in challenging regs. ... 4.0............42
1.12 Transparency of government policymaking............. 4.9............26
1.13 Business costs of terrorism.................................... 5.6............52
1.14 Business costs of crime and violence..................... 4.6............71
1.15 Organized crime..................................................... 5.6............42
1.16 Reliability of police services.................................... 6.3..............4
1.17 Ethical behavior of firms ......................................... 4.5............32
1.18 Strength of auditing and reporting standards ......... 5.2............36
1.19 Efficacy of corporate boards .................................. 5.2............40
1.20 Protection of minority shareholders’ interests ......... 4.4............42
1.21 Strength of investor protection, 0–10 (best)* .......... 5.8............55
2nd pillar: Infrastructure
2.01 Quality of overall infrastructure ............................... 4.6............48
2.02 Quality of roads...................................................... 4.9............35
2.03 Quality of railroad infrastructure.............................. 2.4............79
2.04 Quality of port infrastructure................................... 4.9............35
2.05 Quality of air transport infrastructure....................... 5.2............36
2.06 Available airline seat km/week, millions* ............. 619.0............38
2.07 Quality of electricity supply..................................... 5.5............46
2.08 Mobile telephone subscriptions/100 pop.* ......... 133.3............40
2.09 Fixed-telephone lines/100 pop.*........................... 19.2............57
3rd pillar: Macroeconomic environment
3.01 Government budget balance, % GDP*................. –1.4............38
3.02 Gross national savings, % GDP* .......................... 20.3............70
3.03 Inflation, annual % change*.................................... 4.4............90
3.04 General government debt, % GDP* ..................... 13.9............10
3.05 Country credit rating, 0–100 (best)*...................... 78.5............22
4th pillar: Health and primary education
4.01 Malaria cases/100,000 pop.* ................................S.L............n/a
4.02 Business impact of malaria ............................. N/Appl............n/a
4.03 Tuberculosis cases/100,000 pop.* ....................... 16.0............35
4.04 Business impact of tuberculosis............................. 6.6............19
4.05 HIV prevalence, % adult pop.* ............................... 0.3............63
4.06 Business impact of HIV/AIDS................................. 6.0............47
4.07 Infant mortality, deaths/1,000 live births*................ 7.1............46
4.08 Life expectancy, years*......................................... 79.8............32
4.09 Quality of primary education................................... 3.0..........108
4.10 Primary education enrollment, net %* .................. 92.0............84
5th pillar: Higher education and training
5.01 Secondary education enrollment, gross %*.......... 89.0............72
5.02 Tertiary education enrollment, gross %*................ 74.4............19
5.03 Quality of the education system ............................. 3.4............86
5.04 Quality of math and science education .................. 3.3..........107
5.05 Quality of management schools ............................. 5.3............21
5.06 Internet access in schools...................................... 4.8............49
5.07 Availability of specialized training services .............. 4.7............36
5.08 Extent of staff training ............................................ 4.1............52
6th pillar: Goods market efficiency
6.01 Intensity of local competition.................................. 5.6............22
6.02 Extent of market dominance .................................. 2.9..........129
6.03 Effectiveness of anti-monopoly policy..................... 4.4............29
6.04 Effect of taxation on incentives to invest................. 3.7............64
6.05 Total tax rate, % profits*....................................... 27.9............30
Chile
Notes: Values are on a 1-to-7 scale unless otherwise annotated with an asterisk (*). For further details and explanation, please refer to the section “How to Read
the Country/Economy Profiles” on page 89.
The Global Competitiveness Index in detail
The Global Competitiveness Report 2015–2016 | 139
2: Country/Economy Profiles
© 2015 World Economic Forum

More Related Content

Viewers also liked

Revista Dani França Edição 1
Revista Dani França Edição 1Revista Dani França Edição 1
Revista Dani França Edição 1Rafa de Cristo
 
US09512516
US09512516US09512516
US09512516dbsloan
 
Apresentação cida, projeto limpeza
Apresentação cida, projeto limpezaApresentação cida, projeto limpeza
Apresentação cida, projeto limpezainespimpao
 
D timofeiczyk junior, romano
D   timofeiczyk junior, romanoD   timofeiczyk junior, romano
D timofeiczyk junior, romanoPetrucio Barros
 
Webwinkel Miranda Damhuis Maakt Goede Sier
Webwinkel Miranda Damhuis Maakt Goede SierWebwinkel Miranda Damhuis Maakt Goede Sier
Webwinkel Miranda Damhuis Maakt Goede Siermirandadamhuis
 
Oct 24 CAPHC Breakfast Symposium - Sponsored by Hitachi, CGI, Evident and I...
Oct 24   CAPHC Breakfast Symposium - Sponsored by Hitachi, CGI, Evident and I...Oct 24   CAPHC Breakfast Symposium - Sponsored by Hitachi, CGI, Evident and I...
Oct 24 CAPHC Breakfast Symposium - Sponsored by Hitachi, CGI, Evident and I...Glenna Gosewich
 
Edwin y juan acto creativo
Edwin y juan acto creativoEdwin y juan acto creativo
Edwin y juan acto creativoLOSDESTISOS
 
Marannook’s-Bible-Study-for-Training-Staff-Counselors
Marannook’s-Bible-Study-for-Training-Staff-CounselorsMarannook’s-Bible-Study-for-Training-Staff-Counselors
Marannook’s-Bible-Study-for-Training-Staff-CounselorsLee Decker
 
Cleber malavazzi
Cleber malavazziCleber malavazzi
Cleber malavazziguest044fd1
 
Crescimento e desenvolvimento infantil
Crescimento e desenvolvimento infantilCrescimento e desenvolvimento infantil
Crescimento e desenvolvimento infantilGladyanny Veras
 
B2B Beschaffungssprozess
B2B BeschaffungssprozessB2B Beschaffungssprozess
B2B BeschaffungssprozessRoman Spendler
 
Usos una base de datos steven y felipe 901
Usos una base de datos steven y felipe 901Usos una base de datos steven y felipe 901
Usos una base de datos steven y felipe 901steven_felipe
 

Viewers also liked (20)

10
1010
10
 
Revista Dani França Edição 1
Revista Dani França Edição 1Revista Dani França Edição 1
Revista Dani França Edição 1
 
Ana Carolina de Oliveira 2015pdf
Ana Carolina de Oliveira  2015pdfAna Carolina de Oliveira  2015pdf
Ana Carolina de Oliveira 2015pdf
 
US09512516
US09512516US09512516
US09512516
 
Blt Prime 07
Blt Prime 07Blt Prime 07
Blt Prime 07
 
Apresentação cida, projeto limpeza
Apresentação cida, projeto limpezaApresentação cida, projeto limpeza
Apresentação cida, projeto limpeza
 
D timofeiczyk junior, romano
D   timofeiczyk junior, romanoD   timofeiczyk junior, romano
D timofeiczyk junior, romano
 
Webwinkel Miranda Damhuis Maakt Goede Sier
Webwinkel Miranda Damhuis Maakt Goede SierWebwinkel Miranda Damhuis Maakt Goede Sier
Webwinkel Miranda Damhuis Maakt Goede Sier
 
Microsoft excel imagen
Microsoft excel imagenMicrosoft excel imagen
Microsoft excel imagen
 
Oct 24 CAPHC Breakfast Symposium - Sponsored by Hitachi, CGI, Evident and I...
Oct 24   CAPHC Breakfast Symposium - Sponsored by Hitachi, CGI, Evident and I...Oct 24   CAPHC Breakfast Symposium - Sponsored by Hitachi, CGI, Evident and I...
Oct 24 CAPHC Breakfast Symposium - Sponsored by Hitachi, CGI, Evident and I...
 
Edwin y juan acto creativo
Edwin y juan acto creativoEdwin y juan acto creativo
Edwin y juan acto creativo
 
Marannook’s-Bible-Study-for-Training-Staff-Counselors
Marannook’s-Bible-Study-for-Training-Staff-CounselorsMarannook’s-Bible-Study-for-Training-Staff-Counselors
Marannook’s-Bible-Study-for-Training-Staff-Counselors
 
Anguila vs riñon
Anguila vs riñonAnguila vs riñon
Anguila vs riñon
 
Control problemes genètica 3 bis
Control problemes genètica 3 bisControl problemes genètica 3 bis
Control problemes genètica 3 bis
 
Cleber malavazzi
Cleber malavazziCleber malavazzi
Cleber malavazzi
 
Test
TestTest
Test
 
DF27102016_Rowida
DF27102016_RowidaDF27102016_Rowida
DF27102016_Rowida
 
Crescimento e desenvolvimento infantil
Crescimento e desenvolvimento infantilCrescimento e desenvolvimento infantil
Crescimento e desenvolvimento infantil
 
B2B Beschaffungssprozess
B2B BeschaffungssprozessB2B Beschaffungssprozess
B2B Beschaffungssprozess
 
Usos una base de datos steven y felipe 901
Usos una base de datos steven y felipe 901Usos una base de datos steven y felipe 901
Usos una base de datos steven y felipe 901
 

Similar to Posicionamiento de chile en el mercado internacional.

What gci has been telling nigeria
What gci has been telling nigeriaWhat gci has been telling nigeria
What gci has been telling nigeriastatisense
 
IKE - Index of Knowledge Economy and Maturity Model
IKE - Index of Knowledge Economy and Maturity ModelIKE - Index of Knowledge Economy and Maturity Model
IKE - Index of Knowledge Economy and Maturity ModelMohamed Bouanane
 
ESADE_PoliticalEconomyLAC
ESADE_PoliticalEconomyLACESADE_PoliticalEconomyLAC
ESADE_PoliticalEconomyLACAngelMelguizo
 
Vocational training market in india 2019 2020
Vocational training market in india 2019 2020Vocational training market in india 2019 2020
Vocational training market in india 2019 2020alinaa123
 
Competitiveness and competition commission
Competitiveness and competition commissionCompetitiveness and competition commission
Competitiveness and competition commissionM S Siddiqui
 
Transformation to a knowledge-based economy in the GCC: Leveraging Existing S...
Transformation to a knowledge-based economy in the GCC: Leveraging Existing S...Transformation to a knowledge-based economy in the GCC: Leveraging Existing S...
Transformation to a knowledge-based economy in the GCC: Leveraging Existing S...Tatiana Zalan, MA, MBA, PhD
 
COLOMBIA Presentation
COLOMBIA Presentation COLOMBIA Presentation
COLOMBIA Presentation ProColombia
 
Scientific poster template abstract results .pptx
Scientific poster template abstract results .pptxScientific poster template abstract results .pptx
Scientific poster template abstract results .pptxmshawkycn
 
Emerging Consumer Survey 2015 (9 Key Countries Emerging Economies: Brazil, Ch...
Emerging Consumer Survey 2015 (9 Key Countries Emerging Economies: Brazil, Ch...Emerging Consumer Survey 2015 (9 Key Countries Emerging Economies: Brazil, Ch...
Emerging Consumer Survey 2015 (9 Key Countries Emerging Economies: Brazil, Ch...Henky Hendranantha
 
emerging-consumer-survey-2015
emerging-consumer-survey-2015emerging-consumer-survey-2015
emerging-consumer-survey-2015Ashlee Ramanathan
 
Piero ghezzi - inPERU
Piero ghezzi - inPERUPiero ghezzi - inPERU
Piero ghezzi - inPERUinperu
 
Class 10 economics
Class 10 economicsClass 10 economics
Class 10 economicsgopaldey
 
World Grain Marketing: Why the location of population & economic growth is cr...
World Grain Marketing: Why the location of population & economic growth is cr...World Grain Marketing: Why the location of population & economic growth is cr...
World Grain Marketing: Why the location of population & economic growth is cr...ChrisFerris
 
Achieving Sustainable Growth in the Caribbean - Ian Durant
Achieving Sustainable Growth in the Caribbean - Ian DurantAchieving Sustainable Growth in the Caribbean - Ian Durant
Achieving Sustainable Growth in the Caribbean - Ian DurantCaribbean Development Bank
 

Similar to Posicionamiento de chile en el mercado internacional. (20)

What gci has been telling nigeria
What gci has been telling nigeriaWhat gci has been telling nigeria
What gci has been telling nigeria
 
Dr. Balraj Kistow's PPT: WEF GCR 2015-2016 report
Dr. Balraj Kistow's PPT: WEF GCR 2015-2016 reportDr. Balraj Kistow's PPT: WEF GCR 2015-2016 report
Dr. Balraj Kistow's PPT: WEF GCR 2015-2016 report
 
IKE - Index of Knowledge Economy and Maturity Model
IKE - Index of Knowledge Economy and Maturity ModelIKE - Index of Knowledge Economy and Maturity Model
IKE - Index of Knowledge Economy and Maturity Model
 
ESADE_PoliticalEconomyLAC
ESADE_PoliticalEconomyLACESADE_PoliticalEconomyLAC
ESADE_PoliticalEconomyLAC
 
Vocational training market in india 2019 2020
Vocational training market in india 2019 2020Vocational training market in india 2019 2020
Vocational training market in india 2019 2020
 
Competitiveness and competition commission
Competitiveness and competition commissionCompetitiveness and competition commission
Competitiveness and competition commission
 
Prof. Miguel Carrillo: WEF Global Competitiveness Report 2015-2016
 Prof. Miguel Carrillo: WEF Global Competitiveness Report 2015-2016 Prof. Miguel Carrillo: WEF Global Competitiveness Report 2015-2016
Prof. Miguel Carrillo: WEF Global Competitiveness Report 2015-2016
 
Unido idea ppt
Unido idea pptUnido idea ppt
Unido idea ppt
 
Transformation to a knowledge-based economy in the GCC: Leveraging Existing S...
Transformation to a knowledge-based economy in the GCC: Leveraging Existing S...Transformation to a knowledge-based economy in the GCC: Leveraging Existing S...
Transformation to a knowledge-based economy in the GCC: Leveraging Existing S...
 
COLOMBIA Presentation
COLOMBIA Presentation COLOMBIA Presentation
COLOMBIA Presentation
 
Presentation by Dr. Balraj Kistow on analysis of WEF GCR 2016-2017
Presentation by Dr. Balraj Kistow on analysis of WEF GCR 2016-2017Presentation by Dr. Balraj Kistow on analysis of WEF GCR 2016-2017
Presentation by Dr. Balraj Kistow on analysis of WEF GCR 2016-2017
 
Global Economic Trends, Competitiveness and Inclusive Growth
Global Economic Trends, Competitiveness and Inclusive GrowthGlobal Economic Trends, Competitiveness and Inclusive Growth
Global Economic Trends, Competitiveness and Inclusive Growth
 
Scientific poster template abstract results .pptx
Scientific poster template abstract results .pptxScientific poster template abstract results .pptx
Scientific poster template abstract results .pptx
 
Emerging Consumer Survey 2015 (9 Key Countries Emerging Economies: Brazil, Ch...
Emerging Consumer Survey 2015 (9 Key Countries Emerging Economies: Brazil, Ch...Emerging Consumer Survey 2015 (9 Key Countries Emerging Economies: Brazil, Ch...
Emerging Consumer Survey 2015 (9 Key Countries Emerging Economies: Brazil, Ch...
 
emerging-consumer-survey-2015
emerging-consumer-survey-2015emerging-consumer-survey-2015
emerging-consumer-survey-2015
 
Piero ghezzi - inPERU
Piero ghezzi - inPERUPiero ghezzi - inPERU
Piero ghezzi - inPERU
 
Class 10 economics
Class 10 economicsClass 10 economics
Class 10 economics
 
World Grain Marketing: Why the location of population & economic growth is cr...
World Grain Marketing: Why the location of population & economic growth is cr...World Grain Marketing: Why the location of population & economic growth is cr...
World Grain Marketing: Why the location of population & economic growth is cr...
 
Achieving Sustainable Growth in the Caribbean - Ian Durant
Achieving Sustainable Growth in the Caribbean - Ian DurantAchieving Sustainable Growth in the Caribbean - Ian Durant
Achieving Sustainable Growth in the Caribbean - Ian Durant
 
Achieving Sustainable Growth in the Caribbean
Achieving Sustainable Growth in the CaribbeanAchieving Sustainable Growth in the Caribbean
Achieving Sustainable Growth in the Caribbean
 

Recently uploaded

(RIA) Call Girls Bhosari ( 7001035870 ) HI-Fi Pune Escorts Service
(RIA) Call Girls Bhosari ( 7001035870 ) HI-Fi Pune Escorts Service(RIA) Call Girls Bhosari ( 7001035870 ) HI-Fi Pune Escorts Service
(RIA) Call Girls Bhosari ( 7001035870 ) HI-Fi Pune Escorts Serviceranjana rawat
 
(ANJALI) Dange Chowk Call Girls Just Call 7001035870 [ Cash on Delivery ] Pun...
(ANJALI) Dange Chowk Call Girls Just Call 7001035870 [ Cash on Delivery ] Pun...(ANJALI) Dange Chowk Call Girls Just Call 7001035870 [ Cash on Delivery ] Pun...
(ANJALI) Dange Chowk Call Girls Just Call 7001035870 [ Cash on Delivery ] Pun...ranjana rawat
 
VIP Call Girls Service Kondapur Hyderabad Call +91-8250192130
VIP Call Girls Service Kondapur Hyderabad Call +91-8250192130VIP Call Girls Service Kondapur Hyderabad Call +91-8250192130
VIP Call Girls Service Kondapur Hyderabad Call +91-8250192130Suhani Kapoor
 
High Profile Call Girls Nagpur Meera Call 7001035870 Meet With Nagpur Escorts
High Profile Call Girls Nagpur Meera Call 7001035870 Meet With Nagpur EscortsHigh Profile Call Girls Nagpur Meera Call 7001035870 Meet With Nagpur Escorts
High Profile Call Girls Nagpur Meera Call 7001035870 Meet With Nagpur EscortsCall Girls in Nagpur High Profile
 
SPICE PARK APR2024 ( 6,793 SPICE Models )
SPICE PARK APR2024 ( 6,793 SPICE Models )SPICE PARK APR2024 ( 6,793 SPICE Models )
SPICE PARK APR2024 ( 6,793 SPICE Models )Tsuyoshi Horigome
 
Call Girls Delhi {Jodhpur} 9711199012 high profile service
Call Girls Delhi {Jodhpur} 9711199012 high profile serviceCall Girls Delhi {Jodhpur} 9711199012 high profile service
Call Girls Delhi {Jodhpur} 9711199012 high profile servicerehmti665
 
Decoding Kotlin - Your guide to solving the mysterious in Kotlin.pptx
Decoding Kotlin - Your guide to solving the mysterious in Kotlin.pptxDecoding Kotlin - Your guide to solving the mysterious in Kotlin.pptx
Decoding Kotlin - Your guide to solving the mysterious in Kotlin.pptxJoão Esperancinha
 
Introduction to IEEE STANDARDS and its different types.pptx
Introduction to IEEE STANDARDS and its different types.pptxIntroduction to IEEE STANDARDS and its different types.pptx
Introduction to IEEE STANDARDS and its different types.pptxupamatechverse
 
Biology for Computer Engineers Course Handout.pptx
Biology for Computer Engineers Course Handout.pptxBiology for Computer Engineers Course Handout.pptx
Biology for Computer Engineers Course Handout.pptxDeepakSakkari2
 
Structural Analysis and Design of Foundations: A Comprehensive Handbook for S...
Structural Analysis and Design of Foundations: A Comprehensive Handbook for S...Structural Analysis and Design of Foundations: A Comprehensive Handbook for S...
Structural Analysis and Design of Foundations: A Comprehensive Handbook for S...Dr.Costas Sachpazis
 
Analog to Digital and Digital to Analog Converter
Analog to Digital and Digital to Analog ConverterAnalog to Digital and Digital to Analog Converter
Analog to Digital and Digital to Analog ConverterAbhinavSharma374939
 
(ANVI) Koregaon Park Call Girls Just Call 7001035870 [ Cash on Delivery ] Pun...
(ANVI) Koregaon Park Call Girls Just Call 7001035870 [ Cash on Delivery ] Pun...(ANVI) Koregaon Park Call Girls Just Call 7001035870 [ Cash on Delivery ] Pun...
(ANVI) Koregaon Park Call Girls Just Call 7001035870 [ Cash on Delivery ] Pun...ranjana rawat
 
HARMONY IN THE NATURE AND EXISTENCE - Unit-IV
HARMONY IN THE NATURE AND EXISTENCE - Unit-IVHARMONY IN THE NATURE AND EXISTENCE - Unit-IV
HARMONY IN THE NATURE AND EXISTENCE - Unit-IVRajaP95
 
(MEERA) Dapodi Call Girls Just Call 7001035870 [ Cash on Delivery ] Pune Escorts
(MEERA) Dapodi Call Girls Just Call 7001035870 [ Cash on Delivery ] Pune Escorts(MEERA) Dapodi Call Girls Just Call 7001035870 [ Cash on Delivery ] Pune Escorts
(MEERA) Dapodi Call Girls Just Call 7001035870 [ Cash on Delivery ] Pune Escortsranjana rawat
 
IMPLICATIONS OF THE ABOVE HOLISTIC UNDERSTANDING OF HARMONY ON PROFESSIONAL E...
IMPLICATIONS OF THE ABOVE HOLISTIC UNDERSTANDING OF HARMONY ON PROFESSIONAL E...IMPLICATIONS OF THE ABOVE HOLISTIC UNDERSTANDING OF HARMONY ON PROFESSIONAL E...
IMPLICATIONS OF THE ABOVE HOLISTIC UNDERSTANDING OF HARMONY ON PROFESSIONAL E...RajaP95
 
Coefficient of Thermal Expansion and their Importance.pptx
Coefficient of Thermal Expansion and their Importance.pptxCoefficient of Thermal Expansion and their Importance.pptx
Coefficient of Thermal Expansion and their Importance.pptxAsutosh Ranjan
 
Software Development Life Cycle By Team Orange (Dept. of Pharmacy)
Software Development Life Cycle By  Team Orange (Dept. of Pharmacy)Software Development Life Cycle By  Team Orange (Dept. of Pharmacy)
Software Development Life Cycle By Team Orange (Dept. of Pharmacy)Suman Mia
 

Recently uploaded (20)

(RIA) Call Girls Bhosari ( 7001035870 ) HI-Fi Pune Escorts Service
(RIA) Call Girls Bhosari ( 7001035870 ) HI-Fi Pune Escorts Service(RIA) Call Girls Bhosari ( 7001035870 ) HI-Fi Pune Escorts Service
(RIA) Call Girls Bhosari ( 7001035870 ) HI-Fi Pune Escorts Service
 
(ANJALI) Dange Chowk Call Girls Just Call 7001035870 [ Cash on Delivery ] Pun...
(ANJALI) Dange Chowk Call Girls Just Call 7001035870 [ Cash on Delivery ] Pun...(ANJALI) Dange Chowk Call Girls Just Call 7001035870 [ Cash on Delivery ] Pun...
(ANJALI) Dange Chowk Call Girls Just Call 7001035870 [ Cash on Delivery ] Pun...
 
VIP Call Girls Service Kondapur Hyderabad Call +91-8250192130
VIP Call Girls Service Kondapur Hyderabad Call +91-8250192130VIP Call Girls Service Kondapur Hyderabad Call +91-8250192130
VIP Call Girls Service Kondapur Hyderabad Call +91-8250192130
 
Call Us -/9953056974- Call Girls In Vikaspuri-/- Delhi NCR
Call Us -/9953056974- Call Girls In Vikaspuri-/- Delhi NCRCall Us -/9953056974- Call Girls In Vikaspuri-/- Delhi NCR
Call Us -/9953056974- Call Girls In Vikaspuri-/- Delhi NCR
 
High Profile Call Girls Nagpur Meera Call 7001035870 Meet With Nagpur Escorts
High Profile Call Girls Nagpur Meera Call 7001035870 Meet With Nagpur EscortsHigh Profile Call Girls Nagpur Meera Call 7001035870 Meet With Nagpur Escorts
High Profile Call Girls Nagpur Meera Call 7001035870 Meet With Nagpur Escorts
 
SPICE PARK APR2024 ( 6,793 SPICE Models )
SPICE PARK APR2024 ( 6,793 SPICE Models )SPICE PARK APR2024 ( 6,793 SPICE Models )
SPICE PARK APR2024 ( 6,793 SPICE Models )
 
Call Girls Delhi {Jodhpur} 9711199012 high profile service
Call Girls Delhi {Jodhpur} 9711199012 high profile serviceCall Girls Delhi {Jodhpur} 9711199012 high profile service
Call Girls Delhi {Jodhpur} 9711199012 high profile service
 
Decoding Kotlin - Your guide to solving the mysterious in Kotlin.pptx
Decoding Kotlin - Your guide to solving the mysterious in Kotlin.pptxDecoding Kotlin - Your guide to solving the mysterious in Kotlin.pptx
Decoding Kotlin - Your guide to solving the mysterious in Kotlin.pptx
 
Introduction to IEEE STANDARDS and its different types.pptx
Introduction to IEEE STANDARDS and its different types.pptxIntroduction to IEEE STANDARDS and its different types.pptx
Introduction to IEEE STANDARDS and its different types.pptx
 
Biology for Computer Engineers Course Handout.pptx
Biology for Computer Engineers Course Handout.pptxBiology for Computer Engineers Course Handout.pptx
Biology for Computer Engineers Course Handout.pptx
 
★ CALL US 9953330565 ( HOT Young Call Girls In Badarpur delhi NCR
★ CALL US 9953330565 ( HOT Young Call Girls In Badarpur delhi NCR★ CALL US 9953330565 ( HOT Young Call Girls In Badarpur delhi NCR
★ CALL US 9953330565 ( HOT Young Call Girls In Badarpur delhi NCR
 
Structural Analysis and Design of Foundations: A Comprehensive Handbook for S...
Structural Analysis and Design of Foundations: A Comprehensive Handbook for S...Structural Analysis and Design of Foundations: A Comprehensive Handbook for S...
Structural Analysis and Design of Foundations: A Comprehensive Handbook for S...
 
Analog to Digital and Digital to Analog Converter
Analog to Digital and Digital to Analog ConverterAnalog to Digital and Digital to Analog Converter
Analog to Digital and Digital to Analog Converter
 
(ANVI) Koregaon Park Call Girls Just Call 7001035870 [ Cash on Delivery ] Pun...
(ANVI) Koregaon Park Call Girls Just Call 7001035870 [ Cash on Delivery ] Pun...(ANVI) Koregaon Park Call Girls Just Call 7001035870 [ Cash on Delivery ] Pun...
(ANVI) Koregaon Park Call Girls Just Call 7001035870 [ Cash on Delivery ] Pun...
 
HARMONY IN THE NATURE AND EXISTENCE - Unit-IV
HARMONY IN THE NATURE AND EXISTENCE - Unit-IVHARMONY IN THE NATURE AND EXISTENCE - Unit-IV
HARMONY IN THE NATURE AND EXISTENCE - Unit-IV
 
(MEERA) Dapodi Call Girls Just Call 7001035870 [ Cash on Delivery ] Pune Escorts
(MEERA) Dapodi Call Girls Just Call 7001035870 [ Cash on Delivery ] Pune Escorts(MEERA) Dapodi Call Girls Just Call 7001035870 [ Cash on Delivery ] Pune Escorts
(MEERA) Dapodi Call Girls Just Call 7001035870 [ Cash on Delivery ] Pune Escorts
 
IMPLICATIONS OF THE ABOVE HOLISTIC UNDERSTANDING OF HARMONY ON PROFESSIONAL E...
IMPLICATIONS OF THE ABOVE HOLISTIC UNDERSTANDING OF HARMONY ON PROFESSIONAL E...IMPLICATIONS OF THE ABOVE HOLISTIC UNDERSTANDING OF HARMONY ON PROFESSIONAL E...
IMPLICATIONS OF THE ABOVE HOLISTIC UNDERSTANDING OF HARMONY ON PROFESSIONAL E...
 
Coefficient of Thermal Expansion and their Importance.pptx
Coefficient of Thermal Expansion and their Importance.pptxCoefficient of Thermal Expansion and their Importance.pptx
Coefficient of Thermal Expansion and their Importance.pptx
 
Software Development Life Cycle By Team Orange (Dept. of Pharmacy)
Software Development Life Cycle By  Team Orange (Dept. of Pharmacy)Software Development Life Cycle By  Team Orange (Dept. of Pharmacy)
Software Development Life Cycle By Team Orange (Dept. of Pharmacy)
 
9953056974 Call Girls In South Ex, Escorts (Delhi) NCR.pdf
9953056974 Call Girls In South Ex, Escorts (Delhi) NCR.pdf9953056974 Call Girls In South Ex, Escorts (Delhi) NCR.pdf
9953056974 Call Girls In South Ex, Escorts (Delhi) NCR.pdf
 

Posicionamiento de chile en el mercado internacional.

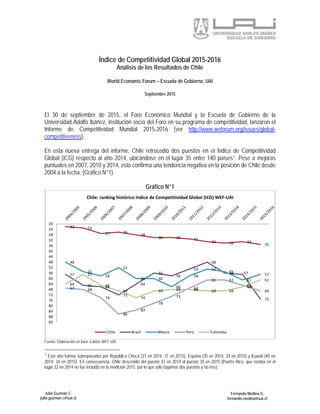
  • 1. Julio Guzmán C. julio.guzman.c@uai.cl Fernando Medina G. fernando.medina@uai.cl Índice de Competitividad Global 2015-2016 Análisis de los Resultados de Chile World Economic Forum – Escuela de Gobierno, UAI Septiembre 2015 El 30 de septiembre de 2015, el Foro Económico Mundial y la Escuela de Gobierno de la Universidad Adolfo Ibáñez, institución socia del Foro en su programa de competitividad, lanzaron el Informe de Competitividad Mundial 2015-2016 (ver http://www.weforum.org/issues/global- competitiveness). En esta nueva entrega del informe, Chile retrocedió dos puestos en el Índice de Competitividad Global (ICG) respecto al año 2014, ubicándose en el lugar 35 entre 140 países1. Pese a mejoras puntuales en 2007, 2010 y 2014, esto confirma una tendencia negativa en la posición de Chile desde 2004 a la fecha. (Gráfico N°1). Gráfico N°1 Fuente: Elaboración en base a datos WEF-UAI 1 Este año fuimos sobrepasados por República Checa (37 en 2014, 31 en 2015), España (35 en 2014, 33 en 2015) y Kuwait (40 en 2014, 34 en 2015). En consecuencia, Chile descendió del puesto 33 en 2014 al puesto 35 en 2015 (Puerto Rico, que estaba en el lugar 32 en 2014 no fue incluido en la medición 2015, por lo que sólo bajamos dos puestos y no tres). 22 23 27 26 28 30 30 31 33 34 33 35 57 65 66 72 64 56 58 53 48 56 57 75 48 55 58 52 60 60 66 58 53 55 61 57 67 68 74 86 83 78 73 67 61 61 65 69 64 57 65 69 74 69 68 68 69 69 66 61 20 24 28 32 36 40 44 48 52 56 60 64 68 72 76 80 84 88 92 Chile: ranking histórico Indice de Competitividad Global (ICG) WEF-UAI Chile Brazil México Perú Colombia
  • 2. Julio Guzmán C. julio.guzman.c@uai.cl Fernando Medina G. fernando.medina@uai.cl En términos comparativos, Chile continúa liderando la región. Este año se amplía la brecha en términos del índice de competitividad entre Chile, Perú (69) y Brasil (75), pero se reduce entre Chile, México (57) y Colombia (61). Estos movimientos se deben a la caída en el ranking de los dos primeros países y a la subida en el ranking de los dos últimos. Respecto a las fortalezas del país, al observar los 3 subíndices y los 12 pilares a partir de los cuales se construye el ICG (Gráfico N°2), se observa que el desarrollo del mercado financiero (21), el entorno macroeconómico (29) y la calidad de las instituciones (32) sobresalen. En tanto que las principales debilidades del país, se encuentran en la salud y educación primaria (74), la eficiencia del mercado laboral (63) y la sofisticación de los negocios (53). Gráfico N°2 Fuente: Elaboración en base a datos WEF-UAI En comparación con el año 2014, se avanzó en tan sólo 3 de los 12 pilares del ICG (Infraestructura, Tecnología y Sofisticación en los Negocios) y se retrocedió en los 9 pilares restantes. En cuanto a los subíndices, el mayor retroceso corresponde al subíndice de Requerimientos Básicos (baja del lugar 30 al 36), seguido por el subíndice Potenciadores de Eficiencia (baja del lugar 29 al 31) y el subíndice Sofisticación e Innovación (baja del lugar 49 al 50). La Figura adjunta da cuenta de la agrupación de pilares en subíndices. 48 55 49 41 42 19 50 34 32 29 70 22 49 28 30 50 53 50 44 39 21 63 40 33 31 74 29 45 32 36 0 10 20 30 40 50 60 70 80 Innovación Sofisticación Negocios SOFISTICACIÓN E INNOVACIÓN (23.7%) Tamaño del Mercado Tecnología Desarrollo Mercado Financiero EficienciaMercado Laboral Eficienciamercado de bienes Educación superior y capacitación POTENCIADORES DE EFICIENCIA (50%) Salud y educación primaria Entorno Macroeconómico Infraestructura Instituciones REQUERIMIENTOS BÁSICOS (26.3%) Posición en el ranking Índice de Competitividad Global WEF-UAI Ranking según Subíndices y Pilares, Chile 2014 y 2015 Chile 2015 Chile 2014
  • 3. Julio Guzmán C. julio.guzman.c@uai.cl Fernando Medina G. fernando.medina@uai.cl En términos comparativos con los países de la OCDE (Gráfico N°3), aún existen brechas relevantes en cuanto a la competitividad de Chile versus este grupo de naciones. Los principales pilares respecto a las cuales Chile se encuentra rezagado son salud y educación primaria, tecnología, sofisticación de los negocios, innovación e infraestructura. Gráfico N°3 Fuente: Elaboración en base a datos WEF-UAI Agrupación de los pilares en subíndices Fuente: WEF Requerimientos Básicos: • Instituciones • Infraestructura • Entorno Macroeconómico • Salud y educación primaria Factores de Sofisticación e Innovación: • Sofisticación en los negocios • Innovación Potenciadores de Eficiencia: • Educación superior y capacitación • Eficiencia del mercado de bienes • Eficiencia del mercado laboral • Desarrollo del mercado financiero • Disposición de tecnología • Tamaño del mercado Claves para economías impulsadas por: FACTORES Clave para economías impulsadas por: EFICIENCIA Clave para economías impulsadas por: INNOVACIÓN 0.0 1.0 2.0 3.0 4.0 5.0 6.0 7.0 Instituciones Infraestructura Entorno Macroeconómico Salud y educación primaria Educaciónsuperior y capacitación Eficienciamercadode bienes EficienciaMercado Laboral DesarrolloMercado Financiero Tecnología Tamaño del Mercado Sofisticación Negocios Innovación LAC OCDE Chile
  • 4. Julio Guzmán C. julio.guzman.c@uai.cl Fernando Medina G. fernando.medina@uai.cl ¿Qué es y para qué sirve la competitividad de un país? La competitividad de un país corresponde al conjunto de instituciones, políticas y factores que determinan el nivel de productividad de un país. A su vez, el nivel de productividad de un país determina la capacidad que tiene su economía para crecer y desarrollarse en el tiempo. Una economía más competitiva es una economía más preparada para mantener un ritmo de crecimiento potencial alto y sostenido. ¿Cómo se mide el Índice de Competitividad Global del WEF? El Índice de Competitividad Global, ICG, se mide anualmente sobre la base de tres subíndices: Requerimientos Básicos (26.3%), Potenciadores de Eficiencia (50%) y Factores de Sofisticación e Innovación (23.7%). Estos subíndices están compuestos a su vez por doce pilares, tales como Instituciones, Infraestructura, Eficiencia del Mercado Laboral, Desarrollo Financiero, entre otros. Estos pilares se construyen a partir de 114 indicadores que se calculan a partir de datos “duros”, tales como deuda pública, esperanza de vida, asistencia escolar, entre otros, y de datos cualitativos recolectados por la Encuesta de Opinión Ejecutiva, que en el caso de Chile es aplicada anualmente por la Escuela de Gobierno de la Universidad Adolfo Ibáñez, en su carácter de institución socia del WEF.
  • 5. The Global Competitiveness Report 2015–2016 | xv Note: The Global Competitiveness Index captures the fundamentals of an economy. Recent developments, including currency (e.g., Switzerland) and commodity price fluctuations (e.g., Azerbaijan, Qatar, Saudi Arabia), geopolitical uncertainties (e.g., Ukraine), and security issues (e.g., Turkey) must be kept in mind when interpreting the results. 1 Scale ranges from 1 to 7. 2 This shows the rank out of the 144 economies in the GCI 2014–2015. 3 The trend line shows the evolution in percentile rank since 2007; breaks in the trend line reflect years when the economy was not included in the GCI. Economy Score1 Prev.2 Trend3 Switzerland 5.76 1 Singapore 5.68 2 United States 5.61 3 Germany 5.53 5 Netherlands 5.50 8 Japan 5.47 6 Hong Kong SAR 5.46 7 Finland 5.45 4 Sweden 5.43 10 United Kingdom 5.43 9 Norway 5.41 11 Denmark 5.33 13 Canada 5.31 15 Qatar 5.30 16 Taiwan, China 5.28 14 New Zealand 5.25 17 United Arab Emirates 5.24 12 Malaysia 5.23 20 Belgium 5.20 18 Luxembourg 5.20 19 Australia 5.15 22 France 5.13 23 Austria 5.12 21 Ireland 5.11 25 Saudi Arabia 5.07 24 Korea, Rep. 4.99 26 Israel 4.98 27 China 4.89 28 Iceland 4.83 30 Estonia 4.74 29 Czech Republic 4.69 37 Thailand 4.64 31 Spain 4.59 35 Kuwait 4.59 40 Chile 4.58 33 Lithuania 4.55 41 Indonesia 4.52 34 Portugal 4.52 36 Bahrain 4.52 44 Azerbaijan 4.50 38 Poland 4.49 43 Kazakhstan 4.49 50 Italy 4.46 49 Latvia 4.45 42 Russian Federation 4.44 53 Mauritius 4.43 39 Philippines 4.39 52 Economy Score1 Prev.2 Trend3 El Salvador 3.87 84 Zambia 3.87 96 Seychelles 3.86 92 Dominican Republic 3.86 101 Kenya 3.85 90 Nepal 3.85 102 Lebanon 3.84 113 Kyrgyz Republic 3.83 108 Gabon 3.83 106 Mongolia 3.81 98 Bhutan 3.80 103 Argentina 3.79 104 Bangladesh 3.76 109 Nicaragua 3.75 99 Ethiopia 3.75 118 Senegal 3.73 112 Bosnia & Herzegovina 3.71 n/a Cape Verde 3.70 114 Lesotho 3.70 107 Cameroon 3.69 116 Uganda 3.66 122 Egypt 3.66 119 Bolivia 3.60 105 Paraguay 3.60 120 Ghana 3.58 111 Tanzania 3.57 121 Guyana 3.56 117 Benin 3.55 n/a Gambia, The 3.48 125 Nigeria 3.46 127 Zimbabwe 3.45 124 Pakistan 3.45 129 Mali 3.44 128 Swaziland 3.40 123 Liberia 3.37 n/a Madagascar 3.32 130 Myanmar 3.32 134 Venezuela 3.30 131 Mozambique 3.20 133 Haiti 3.18 137 Malawi 3.15 132 Burundi 3.11 139 Sierra Leone 3.06 138 Mauritania 3.03 141 Chad 2.96 143 Guinea 2.84 144 Economy Score1 Prev.2 Trend3 Malta 4.39 47 South Africa 4.39 56 Panama 4.38 48 Turkey 4.37 45 Costa Rica 4.33 51 Romania 4.32 59 Bulgaria 4.32 54 India 4.31 71 Vietnam 4.30 68 Mexico 4.29 61 Rwanda 4.29 62 Slovenia 4.28 70 Macedonia, FYR 4.28 63 Colombia 4.28 66 Oman 4.25 46 Hungary 4.25 60 Jordan 4.23 64 Cyprus 4.23 58 Georgia 4.22 69 Slovak Republic 4.22 75 Sri Lanka 4.21 73 Peru 4.21 65 Montenegro 4.20 67 Botswana 4.19 74 Morocco 4.17 72 Uruguay 4.09 80 Iran, Islamic Rep. 4.09 83 Brazil 4.08 57 Ecuador 4.07 n/a Croatia 4.07 77 Guatemala 4.05 78 Ukraine 4.03 76 Tajikistan 4.03 91 Greece 4.02 81 Armenia 4.01 85 Lao PDR 4.00 93 Moldova 4.00 82 Namibia 3.99 88 Jamaica 3.97 86 Algeria 3.97 79 Honduras 3.95 100 Trinidad and Tobago 3.94 89 Cambodia 3.94 95 Côte d’Ivoire 3.93 115 Tunisia 3.93 87 Albania 3.93 97 Serbia 3.89 94 Emerging and Developing Asia 1 10 19 28 37 46 4 13 22 31 40 7 16 25 34 43 2 11 20 29 38 47 5 14 23 32 41 8 17 26 35 44 3 12 21 30 39 6 15 24 33 42 9 18 27 36 45 99 108 117 120 126 135 102 111 129 138 105 114 123 132 100 118 127 136 103 112 121 130 139 106 115 124 133 101 110 119 128 137 104 113 122 131 140 107 116 125 134 97 95 98 96 109 50 59 68 77 86 53 62 71 80 89 56 65 74 83 92 51 60 69 78 54 72 81 90 57 66 75 93 52 61 70 79 88 55 64 73 82 91 58 67 76 85 94 84 48 63 87 49 Advanced Economies Middle East, North Africa, and Pakistan Latin America and the Caribbean Commonwealth of Independent States Emerging and Developing Europe !"#$%#&'()*)+' !"#$%#&'()*)+' !"#$%#&'()*)+' !"#$%#&'()*)+' !"#$%#&'()*)+' !"#$%#&'()*)+' !"#$%#&'()*)+' !"#$%#&'()*)+' !"#$%#&'()*)+'!"#$%#&'()*)+' The Global Competitiveness Index 2015–2016 Rankings Sub-Saharan Africa © 2015 World Economic Forum
  • 6. 0 5 10 15 20 25 30 5,000 10,000 15,000 20,000 25,000 Institutions Infrastructure Macroeconomic environment Health and primary education Higher education and training Goods market efficiency Labor market efficiency Financial market development Technological readiness Market size Business sophistication Innovation 1 2 3 4 5 6 7 Key indicators, 2014 Population (millions)........................................ 17.8 GDP (US$ billions) ........................................ 258.0 GDP per capita (US$)................................. 14,477 GDP (PPP) as share (%) of world total............ 0.38 Global Competitiveness Index GCI 2015–2016......................................................35..... 4.6 GCI 2014–2015 (out of 144)..................................... 33......4.6 GCI 2013–2014 (out of 148)..................................... 34......4.6 GCI 2012–2013 (out of 144)..................................... 33......4.6 Basic requirements (26.3%).......................................36 ......5.1 1st pillar: Institutions................................................. 32......4.6 2nd pillar: Infrastructure............................................ 45......4.6 3rd pillar: Macroeconomic environment.................... 29......5.6 4th pillar: Health and primary education ................... 74......5.6 Efficiency enhancers (50.0%).....................................31 ......4.7 5th pillar: Higher education and training ................... 33......5.0 6th pillar: Goods market efficiency............................ 40......4.6 7th pillar: Labor market efficiency ............................. 63......4.3 8th pillar: Financial market development................... 21......4.6 9th pillar: Technological readiness ............................ 39......4.8 10th pillar: Market size.............................................. 44......4.6 Innovation and sophistication factors (23.7%)...........50 ......3.8 11th pillar: Business sophistication .......................... 53......4.1 12th pillar: Innovation ............................................... 50......3.5 The most problematic factors for doing business Restrictive labor regulations...............................................18.0 Inadequately educated workforce......................................15.8 Inefficient government bureaucracy ...................................14.6 Insufficient capacity to innovate...........................................9.5 Complexity of tax regulations...............................................7.9 Inadequate supply of infrastructure......................................6.8 Tax rates..............................................................................5.7 Access to financing .............................................................5.6 Policy instability ...................................................................4.9 Poor work ethic in labor force..............................................4.0 Crime and theft ...................................................................3.0 Poor public health ...............................................................2.1 Corruption ...........................................................................1.3 Government instability/coups ..............................................0.4 Inflation................................................................................0.4 Foreign currency regulations................................................0.1 Chile Chile Latin America and the Caribbean GDP (PPP) per capita (int’l $), 1990–2014 Rank Score (out of 140) (1–7) Score* 2: Country/Economy Profiles 138 | The Global Competitiveness Report 2015–2016 Factor driven Efficiency driven Innovation driven 1 Transition 1–2 2 Transition 2–3 3 Stage of development * From the list of factors, respondents were asked to select the five most problematic for doing business in their country and to rank them between 1 (most problematic) and 5. The score corresponds to the responses weighted according to their rankings. Chile Latin America and the Caribbean © 2015 World Economic Forum
  • 7. INDICATOR VALUE RANK/140 6th pillar: Goods market efficiency (cont’d.) 6.06 No. procedures to start a business*.......................... 7............76 6.07 No. days to start a business* ................................. 5.5............24 6.08 Agricultural policy costs.......................................... 4.6............19 6.09 Prevalence of non-tariff barriers.............................. 4.9............14 6.10 Trade tariffs, % duty*.............................................. 4.6............65 6.11 Prevalence of foreign ownership............................. 5.4............16 6.12 Business impact of rules on FDI............................. 5.2............24 6.13 Burden of customs procedures.............................. 4.9............29 6.14 Imports as a percentage of GDP* ........................ 33.6............97 6.15 Degree of customer orientation.............................. 4.4............82 6.16 Buyer sophistication............................................... 4.0............28 7th pillar: Labor market efficiency 7.01 Cooperation in labor-employer relations ................. 4.5............55 7.02 Flexibility of wage determination............................. 5.8............12 7.03 Hiring and firing practices....................................... 3.3..........110 7.04 Redundancy costs, weeks of salary*.................... 27.4..........117 7.05 Effect of taxation on incentives to work.................. 4.6............19 7.06 Pay and productivity............................................... 4.2............54 7.07 Reliance on professional management................... 4.6............42 7.08 Country capacity to retain talent............................. 4.8............16 7.09 Country capacity to attract talent ........................... 4.2............22 7.10 Women in labor force, ratio to men*..................... 0.69............98 8th pillar: Financial market development 8.01 Availability of financial services ............................... 5.5............21 8.02 Affordability of financial services ............................. 4.9............41 8.03 Financing through local equity market.................... 4.5............24 8.04 Ease of access to loans ......................................... 3.7............20 8.05 Venture capital availability....................................... 3.3............32 8.06 Soundness of banks .............................................. 6.3..............9 8.07 Regulation of securities exchanges ........................ 5.4............19 8.08 Legal rights index, 0–12 (best)* ................................. 4............80 9th pillar: Technological readiness 9.01 Availability of latest technologies ............................ 5.6............33 9.02 Firm-level technology absorption............................ 5.2............38 9.03 FDI and technology transfer ................................... 5.2............14 9.04 Individuals using Internet, %* ............................... 72.4............36 9.05 Fixed-broadband Internet subscriptions/100 pop.* 14.1............56 9.06 Int’l Internet bandwidth, kb/s per user* ................ 73.1............39 9.07 Mobile-broadband subscriptions/100 pop.* ......... 50.5............55 10th pillar: Market size 10.01 Domestic market size index, 1–7 (best)*................. 4.4............41 10.02 Foreign market size index, 1–7 (best)*.................... 5.1............49 10.03 GDP (PPP$ billions)* .......................................... 409.3............42 10.04 Exports as a percentage of GDP* ........................ 33.7............85 11th pillar: Business sophistication 11.01 Local supplier quantity ........................................... 4.4............80 11.02 Local supplier quality.............................................. 4.7............43 11.03 State of cluster development.................................. 3.7............72 11.04 Nature of competitive advantage............................ 3.3............82 11.05 Value chain breadth................................................ 3.9............58 11.06 Control of international distribution......................... 4.1............39 11.07 Production process sophistication.......................... 4.4............40 11.08 Extent of marketing................................................ 4.8............30 11.09 Willingness to delegate authority............................ 3.7............71 12th pillar: Innovation 12.01 Capacity for innovation........................................... 3.8............85 12.02 Quality of scientific research institutions ................. 4.1............48 12.03 Company spending on R&D................................... 3.0............92 12.04 University-industry collaboration in R&D ................. 4.2............39 12.05 Gov’t procurement of advanced tech products...... 3.1............89 12.06 Availability of scientists and engineers.................... 4.6............32 12.07 PCT patents, applications/million pop.*.................. 7.1............43 INDICATOR VALUE RANK/140 1st pillar: Institutions 1.01 Property rights ....................................................... 5.1............35 1.02 Intellectual property protection ............................... 4.2............49 1.03 Diversion of public funds........................................ 4.6............31 1.04 Public trust in politicians......................................... 3.3............53 1.05 Irregular payments and bribes................................ 5.5............28 1.06 Judicial independence............................................ 5.0............31 1.07 Favoritism in decisions of government officials ....... 3.6............42 1.08 Wastefulness of government spending................... 4.2............21 1.09 Burden of government regulation ........................... 3.7............45 1.10 Efficiency of legal framework in settling disputes.... 4.0............47 1.11 Efficiency of legal framework in challenging regs. ... 4.0............42 1.12 Transparency of government policymaking............. 4.9............26 1.13 Business costs of terrorism.................................... 5.6............52 1.14 Business costs of crime and violence..................... 4.6............71 1.15 Organized crime..................................................... 5.6............42 1.16 Reliability of police services.................................... 6.3..............4 1.17 Ethical behavior of firms ......................................... 4.5............32 1.18 Strength of auditing and reporting standards ......... 5.2............36 1.19 Efficacy of corporate boards .................................. 5.2............40 1.20 Protection of minority shareholders’ interests ......... 4.4............42 1.21 Strength of investor protection, 0–10 (best)* .......... 5.8............55 2nd pillar: Infrastructure 2.01 Quality of overall infrastructure ............................... 4.6............48 2.02 Quality of roads...................................................... 4.9............35 2.03 Quality of railroad infrastructure.............................. 2.4............79 2.04 Quality of port infrastructure................................... 4.9............35 2.05 Quality of air transport infrastructure....................... 5.2............36 2.06 Available airline seat km/week, millions* ............. 619.0............38 2.07 Quality of electricity supply..................................... 5.5............46 2.08 Mobile telephone subscriptions/100 pop.* ......... 133.3............40 2.09 Fixed-telephone lines/100 pop.*........................... 19.2............57 3rd pillar: Macroeconomic environment 3.01 Government budget balance, % GDP*................. –1.4............38 3.02 Gross national savings, % GDP* .......................... 20.3............70 3.03 Inflation, annual % change*.................................... 4.4............90 3.04 General government debt, % GDP* ..................... 13.9............10 3.05 Country credit rating, 0–100 (best)*...................... 78.5............22 4th pillar: Health and primary education 4.01 Malaria cases/100,000 pop.* ................................S.L............n/a 4.02 Business impact of malaria ............................. N/Appl............n/a 4.03 Tuberculosis cases/100,000 pop.* ....................... 16.0............35 4.04 Business impact of tuberculosis............................. 6.6............19 4.05 HIV prevalence, % adult pop.* ............................... 0.3............63 4.06 Business impact of HIV/AIDS................................. 6.0............47 4.07 Infant mortality, deaths/1,000 live births*................ 7.1............46 4.08 Life expectancy, years*......................................... 79.8............32 4.09 Quality of primary education................................... 3.0..........108 4.10 Primary education enrollment, net %* .................. 92.0............84 5th pillar: Higher education and training 5.01 Secondary education enrollment, gross %*.......... 89.0............72 5.02 Tertiary education enrollment, gross %*................ 74.4............19 5.03 Quality of the education system ............................. 3.4............86 5.04 Quality of math and science education .................. 3.3..........107 5.05 Quality of management schools ............................. 5.3............21 5.06 Internet access in schools...................................... 4.8............49 5.07 Availability of specialized training services .............. 4.7............36 5.08 Extent of staff training ............................................ 4.1............52 6th pillar: Goods market efficiency 6.01 Intensity of local competition.................................. 5.6............22 6.02 Extent of market dominance .................................. 2.9..........129 6.03 Effectiveness of anti-monopoly policy..................... 4.4............29 6.04 Effect of taxation on incentives to invest................. 3.7............64 6.05 Total tax rate, % profits*....................................... 27.9............30 Chile Notes: Values are on a 1-to-7 scale unless otherwise annotated with an asterisk (*). For further details and explanation, please refer to the section “How to Read the Country/Economy Profiles” on page 89. The Global Competitiveness Index in detail The Global Competitiveness Report 2015–2016 | 139 2: Country/Economy Profiles © 2015 World Economic Forum