Private Company Liquidity Fuels Entrepreneurship
•
2 likes•729 views

Stock options are most valuable when the underlying stock can be readily exchanged in a well-functioning, liquid marketplace. Appreciation of any magnitude in an employee’s net worth can only reasonably be achieved through equity compensation. It is no wonder that stock option programs are such an important component of compensation packages to employees of high-growth companies. This paper quantitatively dissects the economic benefits to employees, managers and investors alike of having a well-functioning, liquid secondary market for private company shares. It goes a step further to show that a healthy secondary market will enable faster capital return cycle, to the benefit of the entire entrepreneurial ecosystem.

Recommended
Recommended
More Related Content
What's hot
Similar to Private Company Liquidity Fuels Entrepreneurship
Similar to Private Company Liquidity Fuels Entrepreneurship (20)
Recently uploaded
Recently uploaded (20)
Private Company Liquidity Fuels Entrepreneurship
- 1. Private Company Liquidity: Fueling American Entrepreneurship Bo Brustkern Introduction For high growth companies, one of the most efficient and effective ways to align interests among stakeholders, and to allocate wealth among those who help to create it, is through the issuance of stock, stock options and restricted stock units. This holds true for companies at the very earliest stages of formation all the way to large, publicly traded entities whose prospects for growth continue. Stock options are most valuable when the underlying stock can be readily exchanged in a well‐ functioning, liquid marketplace. Stock options for public market companies are the premiere example of this. For example, those employees who received stock options of publicly traded Apple, Inc. in 2003 at a strike price of $9.00 per share, and whose awards vested during the following years, have enjoyed spectacular returns on their investment of time as they have collectively built AAPL to approximately $400 per share as of this writing. This represents a $350 billion market cap, making AAPL among the most valuable companies on the planet.1 For the hypothetical employee, this represents an instantaneous gain of $391 per share, or 43.5 times the strike price of the stock in only eight years. Growth of this magnitude in an employee’s net worth can only reasonably be achieved through equity compensation. It is no wonder that stock option programs are such an important component of compensation packages to employees of high‐growth companies. It is also no wonder that companies and boards are willing to foot the bill for 409A compliance, including appraisals conducted by business valuation firms.2 1 I use examples such as Apple because publicly traded companies on the Nasdaq Global Market and the New York Stock Exchange are rich in data transparency and valuations are trustworthy due to robust market dynamics. However, this paper will be focused on private companies, where valuation is uncertain in the absence of a public market. 2 The author is affiliated with Arcstone Valuation, a nationally recognized business valuation firm, and Arcstone Equity Research, an independent investment research firm. 1
- 3. By definition, early employees play a key role in the development of young companies. And yet their tenure tends to last materially less than that the average 9 years from founding to exit. These early employees may not make it to the big exit that successful companies enjoy, and yet they may have built tremendous value for their respective companies in their years of service. For example, let’s say a startup marketing specialist, Jane, joins a company six months after the company’s founding, and shortly after receiving its round of angel financing. Jane is instrumental in building awareness of the company’s products and services in its target market, and creates tremendous value for the company during her five‐year stint there, during which time the company grows from zero to over $5 million in annual revenue, with forecasts for future revenue growth exceeding 100% year‐over‐year growth. But Jane is a startup specialist, and this company is now in a new phase of professionalization or institutionalization. Her team has grown manyfold, and Jane’s daily activities call on her to be a middle manager more than the role of marketing ninja she fancies. Her skills are less valued by the company in this stage of growth, and frankly she’s less enthusiastic about her day‐to‐day impact on the company. So she leaves to start with a new venture that has just recently been formed and which has received its first round of angel financing. Countless research has concluded that the people, processes, and practices that make a company successful from its earliest stages of formation must be replaced or retooled in order to make it through professionalization, institutionalization and later stages of maturity.3 Exit Zone Mid‐stage liquidity Early employee & angel liquidity Jane has every right to leave her firm to join a new one. Since she has five years of tenure, all of her originally issued options are now fully vested. When she joined, she was granted options at a strike price of $0.10 from her company’s board of directors. When she left the company, the fair market value of the company’s stock was shown to be over $1.60 per share.4 What’s more, as an early employee, she 3 Works in this arena of management science are voluminous. Growing Pains by Flammholz and Crossing the Chasm by Christiansen are two well‐known standards. 4 We won’t go into the specifics of 409A valuations in this paper, but will assume all entry and exit prices are made at fair market value, in accordance with Internal Revenue Code Section 409A. 3
- 4. was granted the equivalent of roughly 1% of the company’s outstanding stock, or 1,000,000 shares. With the expansion of value of the company, Jane has a paper fortune of $1.5 million. But that’s just it: it’s all paper, it’s all in private company stock. With any luck the company will have a big liquidity event in an additional five years. That’s five years of private company stock volatility, which Jane is not happy to bear. To quantify Jane’s discomfort, we can run a simple calculation using time (five years) and volatility (let’s assume 70%) as inputs. Using a protective put methodology, today’s value of a $1.60 stock with a five year lockup is $0.74, a 54% discount to its current fair market value.5 Naturally, Jane would prefer to convert the $1.5 million of illiquid value into cash, and move the cash into a basket of diversified investments, including real estate (read: pay down mortgage) and education (read: schooling for the kids). Possibly – I would argue likely – a portion of this capital would be invested in new entrepreneurial startups; perhaps her own new company. Without early liquidity for early “investors of human capital” like Jane, all of this value is unnecessarily locked up in the illiquid equity of the private company. This cycle of entrepreneurship is well recognized in the world of tech startups. It’s one reason that, after so many ups‐and‐downs in the private company market, private company stock options came to be considered essentially valueless for employees, except in the most exceptional cases. Troubled Angels The same is true with investors of financial capital. It turns out that some investors are very good at picking winners at their earliest stages of development. Many investors are not comfortable with that level of risk, and prefer to invest later in a company’s maturation. Still more investors wait until a company has achieved greater scale and its risk profile is further reduced. The deepest pools of capital, including mutual funds and hedge funds, play in the public markets where “mid‐cap” companies of greater than $10 billion equity value and “large‐cap” companies of greater than $30 billion in equity value attract a massive portion of the world’s investment dollars. But for those early‐stage investment 5 The protective put methodology calculates the cost of a put option to protect the value of a stock position for a given period of time under given volatility assumptions. In this case, purchasing a put to protect the $1.60 value for five years would cost $0.86. Purchasing such a put would wipe out more than half of the stock’s value. 4
- 5. specialists, they have to ride along with the company – much like Jane the marketing ninja – from an equity value approximating zero to an equity value approaching $100 million (in the case of M&A exits) or $1 billion (for IPOs) before they can expect to exit their investment. Is this efficient? Why have Angelo, an early stage investment specialist, lock up his capital for ten years waiting for a 40x return on an IPO (a “forty‐bagger” in the jargon) when he might exit with a highly respectable 5x return on investment in five years? Consider the tables below: Theoretically, Angelo should be indifferent between these two scenarios, as his Internal Rate of Return6 (“IRR”) is roughly equivalent between the 10‐year forty‐bagger and the 5‐year five‐bagger. But what is more efficient for an early stage specialist? Why, return his money quickly so he can go invest it again, of course. But how? Without a well‐functioning marketplace for Angelo’s stock, he’s likely to be stuck for five more years. What if Angelo could sell his stock at the five‐year mark? Is this not just swapping out one investor for another with the same expectations of the $4 million exit? No. Recall that Angelo invested in the company as an angel, prior to its first institutional round of venture capital. Assume the company was just an alpha‐stage product built out of a dorm room or in someone’s garage. For the risk he took, 6 Internal Rate of Return is defined as the annualized effective compounded return rate that makes the net present value of all cash flows from a particular investment equal to zero. Follow the math as illustrated in the above example to understand the mechanics of the IRR. The discount factor (item “d” above) grows exponentially in relation to the discount rate and passage of time. Because IRRs are subject to compounding, a 50% IRR increases return requirements massively, as illustrated in this example. 5
- 6. Angelo required a 50% IRR on his investment (or likely greater). But that was five years ago, and that was expensive capital. What if Angelo could sell his stake at the five‐year mark to a new investor? The new investor, in all likelihood, would require a materially lower IRR for the investment today. Twenty‐ five percent might suffice. After all, the company has significant revenues, well‐functioning operational departments, and is on its way to a big exit. What does this 25% return requirement do to the expectations of current investors? By the magic of compounding interest, it reduces the need for a mega exit to a moderate one. Here’s why: if Angelo’s expensive capital were to continue the ride from year 5 to year 10, his 50% IRR requirement would compound so aggressively that the $500,000 value today would have to grow by approximately 8x over the next five years (to $4 million) to meet his expected return. A 25% IRR threshold, on the other hand, only requires a 2.5x return over the same period of time, to $1.250 million, as illustrated below. If the company were to swap out all of its early stage investors for mezzanine investors at the five‐year mark, they would collectively require only a $1,250,000 exit for each $500,000 they invested. That’s nearly 70% less than the $4,000,000 Angelo required for his own hot‐stuff capital. Thus, not only is it more efficient to get Angelo investing again, it’s strategically important for companies to replace early stage capital in their equity structure with mezzanine investors at the appropriate stages of development, so as to reduce pressure on management to keep swinging for the fences, when more moderate strategies may be appropriate for the company’s sustained growth and success. How Does It Work? We could have discussions about the securities laws that allow private stock transactions between private individuals. We could also talk about the execution issues surrounding the T+45 closing 6
- 7. processes that often characterize the private company marketplace.7 But we’ll leave these discussions to the attorneys and stock administrators. There are many good minds at work trying to simplify and speed up the process. Suffice it to say that private company stock, at the simplest level, is the property of its individual owner. One of the fundamental characteristics of property is that is can be traded from one party to another. Thus established, the questions with which we are wrestling in this paper pertain to valuation and economics. What is a company’s value at inception, at early stages of growth, at mezzanine, and proximate to exit? How are values allocated across the classes of securities (debt, preferred equity, and common stock) that make up the company? What exit points are logical for early investors? What does it mean for entrepreneurship in the United States to have a well‐functioning marketplace for private company stock? Company Valuations through Time What is a company’s value? Ask any professional business appraiser this question and the likely response will be “it depends.” On what does it depend? Simply put, the company’s value depends on the present value of its expected future stream of cash flows. In other words, a hypothetical buyer will willingly exchange cash today for expected future cash flows, discounted for the risk that future cash flows may differ from what is forecast today. Valuation analysts – and more importantly, buyers – use a well‐established, time‐tested methodology to mathematically calculate the value of something today given the inherent riskiness of its cash flows. This is referred to as the discounted cash flow method (“DCF”), and it underpins everything in business valuation; that is, all other valuation approaches and methodologies can be reconciled back to what buyers are willing to pay for a stream of uncertain future cash flows. The DCF is elegant in its simplicity, with only two variable elements in the classical approach: 1) forecast cash flows, and 2) the risk associated with those forecasts, expressed in terms of a discount rate Discount rate, compound annual rate of return, and Internal Rate of Return all refer to the same measure. In this paper, I use the terms interchangeably, according to the point of view of the subject. For example, “Angelo requires an IRR of 50% for his $100,000 investment because the discount rate associated with this particular investment is 50% and the company expects to grow its equity value at a compound annual rate of 50%.” Below is a much‐simplified table that compares stage of company with typical rates of return required by investors at each stage: 7 Industry standards and regulations require Investors to complete or "settle" their security transactions within a set number of business days. This settlement cycle is known as "T+x," shorthand for "trade date plus x days." T+3 means that when you buy a security, your payment must be received by your brokerage firm no later than three business days after the trade is executed. When you sell a security, you must deliver to your brokerage firm your securities certificate no later than three business days after the sale. For transactions involving secondary sales of private company stock, T+30 settlement times are more common. 7
- 8. Inception Early Stage Mezzanine Public Market Mature US Gov’t Revenue Profit Long‐Term Long‐Term Milestone: Concept “Risk‐Free” Growth Growth Competitiveness Sustainability Cost of Capital: >50% 30% ‐ 50% <30% ~10% <10% <2% The DCF model is conceptually simple. The basic premise is that a dollar in the hand today is worth more than a dollar promised tomorrow. To construct a model showing how much less tomorrow’s dollar is worth, one must discount tomorrow’s dollar by a certain cost of capital. As described above, cost of capital is derived by examining the risk of a given venture relative to other potential investments. A company raising money at inception may only attract investment from investors if they can show that every dollar invested today will result in 50% growth in value of that dollar, year‐over‐year, until exit. In the illustration below, an investor is willing to finance the company’s negative free cash flow by investing $500,000 in year one, $525,000 in year two, $1,050,000 in year three, and $150,000 in year four as the company finally approaches cash‐flow breakeven. At the end of year five, after the company has turned a significant profit, the company intends to sell itself for 1.5x revenues, or $6,000,000. These cash flows yield a 50.7% internal rate of return. In other words, the company promises that every dollar invested will experience compounded annual growth of over 50%. That is quite an attractive investment, if you believe the company’s forecasts. But what is the risk that this company will not achieve its forecasts? In this case, we can conclude that the risk is equivalent to a 50% discount rate. Another way of putting it is that the company’s cost of capital is 50%. 8
- 9. To explain the concept of the DCF further, and the time‐sensitivity of returns on investment, we’ll take the same example but require that the investor ponies up for the full investment on Day 1 of Year 1. The same company will render just shy of a 30% return: Now that we have an appreciation for discount rates, let’s consider what happens when an investor makes an investment in an entrepreneurial venture. Even at the earliest stage of company development, invested capital does not comprise 100% of the value of the company. To illustrate this, we will assume that an angel investor is willing to invest $500,000 up front in an entrepreneurial venture in exchange for 50% equity in the company. After setting aside shares for an option pool, the company capitalization table (“cap table”) looks like this: 9
- 10. Angelo purchased these shares at $0.05 per share. The common stock is then said to be worth $0.05 per share, and the “post‐money valuation” is said to be $1 million. At the beginning of Year 2 of this venture, the same company attracts an additional $2 million of venture capital financing. This institutional capital is made as a preferred equity financing, with control and preference features attached that give the VCs enhanced returns, control and downside protection. This is the company’s Preferred A financing round, and in exchange for the $2.5 million investment the company trades away 10,000,000 shares of Preferred A stock priced at $0.25 per share. Now the cap table looks like this: Note that the post‐money valuation, which is equal to the price per share paid in the last round of financing multiplied by the total number of shares, is now $7.5 million. That’s significant appreciation for the entrepreneurial team’s efforts. The company’s prospects have changed considerably, and along with heightened forecasts of future performance, the company also requires more capital. 10
- 11. Two years later, the company closes on its Preferred B financing of $7.5 million at $0.50 per share, an “up round” with 100% appreciation in stock price. Now the cap table looks like this: We are now three full years into the venture. After two more years, and with a mezzanine round of growth capital on the horizon, it could be said that Angelo is feeling fatigued; so are the early employees. Recall our prior discussion regarding early stage specialists – founder, investors, and marketing ninjas alike are beginning to tire of this adventure. In order to consider the possibility of cashing out early investors, we must consider the value of their equity. Value Is Allocated According to the Capital Structure Equity participants are divided among groups of investors according to their seniority. Much like debt can be layered in senior, subordinate and unsecured classes, equity value is allocated according to different security classes. Because the preferred stock gets preferential payouts upon liquidation (and in this way somewhat functions like debt), liquidation tables must be created to describe how investors will be paid out given certain liquidation scenarios. This exercise is called the allocation of equity value. In this example, we’ll assume the first $10 million is allocated pari passu between the Series A and Series B preferred stock: 11
- 13. The next $7.5 million, which takes the equity value to $0.50 per share (the same price as the last round of financing) is split between the common and Series A preferred stock: And every dollar thereafter is split pari passu between the Series A, Series B and common stock: Thus, if the company’s total equity value is deemed to be $10 million, the preferred A is said to be worth $0.25 per share, the preferred B worth $0.50 per share, and the common stock zero. The preferred stock at a $0.25 value per share acts more like debt than equity, since they take all the value and the common stock gets none. However, at a total equity value of $30 million, the common stock has caught up to the preferred stock on a per share basis, and is now worth $0.67 per share. 13
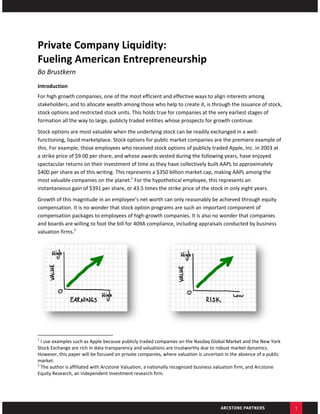
- 14. A graphical display of the above may look like the following: Exit… Stage Left Which brings us back to the cornerstone question: at what point will early employees and investors crave liquidity? Recall the below table, where time is represented on the X‐axis and exit valuations are represented on the Y‐axis. When one views the below table in the context of a discounted cash flow model, and the time‐ value of money, 60 quarters of time starts to look like an eternity for someone expecting a 50% IRR. Exit Zone Mid‐stage liquidity Early employee & angel liquidity 14
- 15. In this illustration, early employees and angels seek liquidity as the company lifts off from a valuation of near‐zero to approximately $30 million, after about 20 quarters (five years) of investment. Let’s examine this desire for liquidity in the context of the capital structure from above. In this example, common stock comprises 20,000,000 shares of a total of 45,000,000 shares outstanding. At a $30,000,000 valuation, the company’s fully diluted value is equal to $0.67 per share (identified by the dotted green line below). Now a new investor makes an offer to angels and early employees at $0.60 per share (identified by the dotted black line below). For founders who started with nothing, and for Angelo who purchased shares at $0.05 per share, a $0.60 per share offer represents an IRR of over 64%. 15
- 17. Meanwhile, the board of directors, representing all stakeholders, may wish to swap out the angel investors with new, long‐term investors eager to participate in the company’s forecast growth. In the end, a transaction of this kind does very little to impact the ownership structure of the company: A transaction of this type impacts the structure and dynamics of the company in the following ways: Founders and management are partially rewarded for their efforts. o Vested stock options may be sold. By definition, this is only a small portion (or none at all) of recently hired employees, and possibly a greater portion (up to 100%) of founders’ stock. The pressure to exit is thus reduced materially, which is often viewed positively in the same way that patient investors are viewed. o Early stage specialists are given the economic freedom to invest their time and capital in their next ventures. Angels are partially or wholly rewarded for the risks they took at the formation of the company, and this capital is re‐deployed into the entrepreneurial landscape. New investors are allowed exposure to private companies at attractive pre‐IPO valuations. This is an exciting area of investment for many investors, where risk‐adjusted returns can be high. Companies have the opportunity to remove fatigued investors and employees (known as “dead cap”) from the cap table in exchange for new, long‐term investors eager to participate in the company’s forecast growth. 17
- 18. As discussed before, new investors at this stage of investment require a reduced IRR due o to the reduced risks associated with the company. In our example, an IRR of 25% is a meaningful difference from the expensive capital the company acquired at its founding. o Replacing dead cap with patient capital is nearly always viewed in a positive light. The board of directors remains unchanged. Control still rests with the preferred stock investors. Other Exits Not Available8 David Weild and Edward Kim, two senior advisors at Grant Thornton Capital Markets and former NASDAQ executives, have analyzed the causes of the current IPO crisis in two subsequent white papers. In their papers, Why are IPOs in the ICU? and Market Structure is Causing the IPO Crisis, Weild and Kim identify regulatory and technological shifts that have irreversibly altered the market for IPOs, including the near disappearance of VC‐backed IPOs after the dot‐com bust of 2000 and the telecom bust of 2001. The disappearance of smaller IPOs has directly led to longer times to exit, termed the IPO Gap: Online brokerages, decreases in brokers’ spreads, and decimalization reduced the profitability of providing investment research and liquidity for smaller stocks – two critical elements for small‐cap, recently public firms. These structural changes provided an antagonistic environment to smaller IPOs and, by extension, to a great many venture‐backed IPOs. The Role of Private Company Liquidity in the US Economy As the IPO window for companies with equity values between $100 million and $1 billion has been effectively shut, and as M&A activity has not provided an equivalent volume of exit options, there are an increasing number of attractive companies growing through the small cap valuation range as private companies. Without a viable secondary market for private company stock, these companies are holding hostage countless fatigued early‐stage specialists, investors and employees alike. 8 Drean and Hege, “The Secondary Private Markets – New Players in the Venture Capital Ecosystem,” École des Hautes Études Commerciales de Paris, 2011. 18
- 19. While IPO and M&A exits are still available to private companies, they have been complemented – and in some cases possibly supplanted – by this newly recognized form of liquidity called the secondary trading of private company stock. A healthy private company liquidity environment in the US, where investors, employees, directors, regulators, and lawmakers understand the benefits and risks associated with private company liquidity, would be of immense value to the US economy. The legal exchange of private shares of stock has brought new efficiency to the private capital markets by allowing early employees, founders and early‐stage investors to exit all or a portion of their holdings. The benefits of allowing an exit at earlier stages in a company’s life, and at various times in graduated fashion, are numerous: Early stage investment specialists are empowered by allowing them to recycle their capital into the next generation of promising startups. Early stage staff are empowered by allowing them to leave a company they’ve helped build and put their energy into new early stage ventures. Entrepreneurs and founders are empowered by allowing them to receive repayment for what are often large personal investments, thus making it easier for them to give up the reins of control to executives more suited to management of mid‐ and later‐stage start‐ups. The company is not pressured to push for exaggerated growth at the cost of sustainable business practices. Conclusion Stock option programs are an important component of compensation packages to employees of high‐ growth companies because they are so efficient and effective in aligning interests among stakeholders and allocating wealth among those who help to create it. For stock compensation to work, however, equity must be converted to cash. For employees of large publicly traded companies, such conversion is not a problem as there is a liquid market in which individuals may sell their stock. This paper illustrates the increasingly well accepted methods that allow private company shareholders to access a ready market in which individuals may access liquidity. The reasons that private company employee liquidity programs are taking hold are numerous, including the long time horizons through which early employees and angels have to wait until their companies experience an exit through M&A or IPO. The negotiation of price and terms, structuring, and the math that underlies private stock transactions are characteristic of the complexities of the private markets themselves. But in the end, it’s all math; specifically, it’s the application of a discounted cash flow model to expected future returns at an appropriate discount rate. At least, it’s all math as far as the transaction is concerned. The true value of an investment can never be foretold; it is always ultimately up to management to make or break any opportunity; to make or break any company. Increased acceptance and prevalence of private company liquidity programs should be embraced as a highly positive development for all market participants including company management, shareholders, boards of directors, and new and old investors alike. The US economy as a whole will enjoy some 19