1. Frank Fudem
The Corporate Real Estate Letter Senior Vice President/Partner
Corporate Real Estate Services
by Frank Fudem | August 2012 Cassidy Turley Northern California
415-677-0455 ffudem@ctbt.com
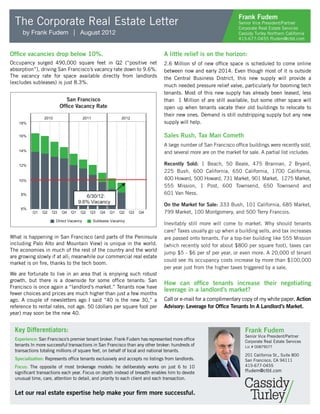
Office vacancies drop below 10%. A little relief is on the horizon:
Occupancy surged 490,000 square feet in Q2 (“positive net 2.6 Million sf of new office space is scheduled to come online
absorption”), driving San Francisco’s vacancy rate down to 9.6%. between now and early 2014. Even though most of it is outside
The vacancy rate for space available directly from landlords the Central Business District, this new supply will provide a
(excludes subleases) is just 8.3%.
much needed pressure relief valve, particularly for booming tech
tenants. Most of this new supply has already been leased, less
San Francisco than 1 Million sf are still available, but some other space will
Office Vacancy Rate open up when tenants vacate their old buildings to relocate to
their new ones. Demand is still outstripping supply but any new
2010 2011 2012
18% supply will help.
16% Sales Rush, Tax Man Cometh
A large number of San Francisco office buildings were recently sold,
14% and several more are on the market for sale. A partial list includes:
12% Recently Sold: 1 Beach, 50 Beale, 475 Brannan, 2 Bryant,
225 Bush, 600 California, 650 California, 1700 California,
10% 400 Howard, 500 Howard, 731 Market, 901 Market, 1275 Market,
555 Mission, 1 Post, 600 Townsend, 650 Townsend and
8% 601 Van Ness.
6/30/12:
9.6% Vacancy
On the Market for Sale: 333 Bush, 101 California, 685 Market,
6%
Q1 Q2 Q3 Q4 Q1 Q2 Q3 Q4 Q1 Q2 Q3 Q4 799 Market, 100 Montgomery, and 500 Terry Francois.
Direct Vacancy Sublease Vacancy
Inevitably still more will come to market. Why should tenants
care? Taxes usually go up when a building sells, and tax increases
What is happening in San Francisco (and parts of the Peninsula are passed onto tenants. For a top-tier building like 555 Mission
including Palo Alto and Mountain View) is unique in the world. (which recently sold for about $800 per square foot), taxes can
The economies in much of the rest of the country and the world
jump $5 - $6 per sf per year, or even more. A 20,000 sf tenant
are growing slowly if at all; meanwhile our commercial real estate
could see its occupancy costs increase by more than $100,000
market is on fire, thanks to the tech boom.
per year just from the higher taxes triggered by a sale.
We are fortunate to live in an area that is enjoying such robust
growth, but there is a downside for some office tenants: San
How can office tenants increase their negotiating
Francisco is once again a “landlord’s market.” Tenants now have
leverage in a landlord’s market?
fewer choices and prices are much higher than just a few months
ago. A couple of newsletters ago I said “40 is the new 30,” a Call or e-mail for a complimentary copy of my white paper, Action
reference to rental rates, not age. 50 (dollars per square foot per Advisory: Leverage for Office Tenants In A Landlord’s Market.
year) may soon be the new 40.
Key Differentiators: Frank Fudem
Senior Vice President/Partner
Experience: San Francisco’s premier tenant broker. Frank Fudem has represented more office Corporate Real Estate Services
tenants In more successful transactions in San Francisco than any other broker: hundreds of Lic # 00879077
transactions totaling millions of square feet, on behalf of local and national tenants.
201 California St., Suite 800
Specialization: Represents office tenants exclusively and accepts no listings from landlords. San Francisco, CA 94111
Focus: The opposite of most brokerage models: he deliberately works on just 6 to 10 415-677-0455
significant transactions each year. Focus on depth instead of breadth enables him to devote ffudem@ctbt.com
unusual time, care, attention to detail, and priority to each client and each transaction.
Let our real estate expertise help make your firm more successful.
2. Frank Fudem
The Corporate Real Estate Letter Senior Vice President/Partner
Corporate Real Estate Services
by Frank Fudem | August 2012 Cassidy Turley
415-677-0455 ffudem@ctbt.com
North & South Financial District Jackson Square/N. Waterfront
B AY S T 2011 2012 2011 2012
C
13% 12%
O
LU
M Vacancy % Vacancy %
BU 12%
S 11%
11%
N. Waterfront
10%
San Francisco Overall CBD 10%
2011 2012 W AY
BROAD 9% 9%
14% Jackson Square
1,200K 200K
Vacancy % 1,000K 150K Net Absorption
12%
800K Net Absorption 100K
Financial 600K 50K
10% District 400K 0
Square Feet
Square Feet
200K -50K
8%
KE AR NY
T
S South 0 -100K
1,200K T
ST
E Q1 Q2 Q3 Q4 Q1 Q2 Q3 Q4 Q1 Q2 Q3 Q4 Q1 Q2 Q3 Q4
K Financial
R
1,000K A
M District
800K
80
600K
Yerba Buena SoMa Area
400K
Square Feet
200K Net Absorption 2011 2012 2011 2012
Rincon /
30% 15%
0 South Beach
Q1 Q2 Q3 Q4 Q1 Q2 Q3 Q4 Yerba Buena Vacancy % Vacancy %
25%
6T
H
13%
S
3R
T
D
20%
S
T
11%
15%
10% 9%
South of 350K 450K
Market 300K 375K Net Absorption
250K Net Absorption 300K
7T
200K 225K
H
S
T
150K 150K
T
S 100K 75K
Y Mission Bay
R
Square Feet
Square Feet
R 50K 0
101 E China Basin
B
0 -75K
-50K -150K
Q1 Q2 Q3 Q4 Q1 Q2 Q3 Q4 Q1 Q2 Q3 Q4 Q1 Q2 Q3 Q4
Frank Fudem 201 California St., Suite 800
Senior Vice President/Partner San Francisco, CA 94111
Corporate Real Estate Services 415-677-0455
Lic # 00879077 ffudem@ctbt.com