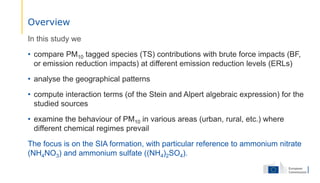

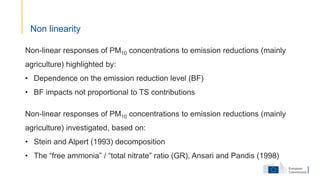
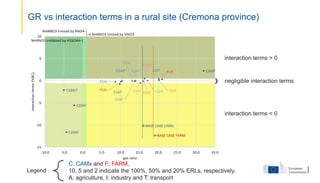
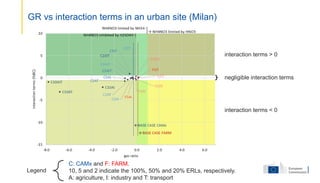
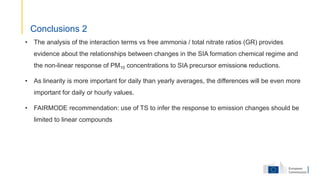
![The gas ratio (GR, Ansari and Pandis,1998) was used to define the chemical regime in
each of the simulations :
GR= ([NH3] + [NH4
+] – 2[SO4
2-]) / ([HNO3] + [NO3
-])
where concentrations are nmol.m-³ or in nmol.mol-1 of air (ppb).
The GR value defines three different chemical regimes:
(a) GR>1, in which NH4NO3 formation is limited by the availability of HNO3,
(b) 0<GR<1, in which NH4NO3 formation is limited by the availability of NH3, and
(c) GR<0, in which NH4NO3 formation is inhibited by H2SO4the gas ratio (GR)
“free ammonia” / “total nitrate” gas ratio](https://image.slidesharecdn.com/04-210209114744/85/Source-apportionment-approaches-and-non-linearities-10-320.jpg)


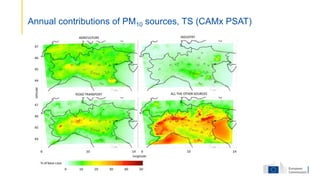
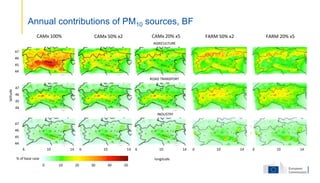
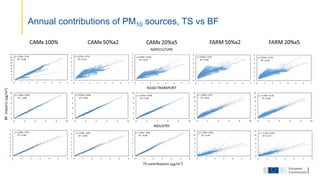
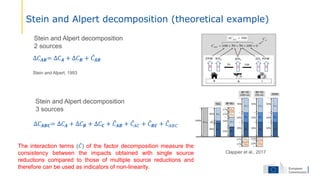
This document compares source apportionment approaches for PM10 using tagged species (TS) contributions and brute force impacts (BF) simulations with the CAMx and FARM air quality models. Non-linear responses of PM10 concentrations to emission reductions, particularly for agriculture, are highlighted by the dependence on emission reduction levels and differences between TS and BF results. The gas ratio and Stein and Alpert decomposition indicate relationships between changes in secondary inorganic aerosol formation chemistry and non-linear responses to precursor emission reductions. Differences between linear and non-linear sources suggest limitations in using TS to infer emission change responses.


![Polymer [ बहुलक ] Chemistry Notes PDF - Irfanullah Mehar - JJ Sir Chemistry.pdf](https://cdn.slidesharecdn.com/ss_thumbnails/polymerchemistrynotespdf-irfanullahmehar-jjsirchemistry-260210172118-3f9b37f7-thumbnail.jpg?width=640&height=640&fit=bounds)


