Tugas 1 abdul rozak
•Download as DOCX, PDF•
0 likes•261 views

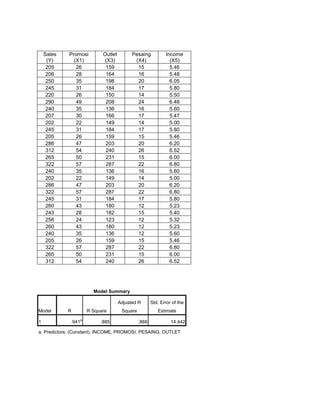
The model summary shows that the independent variables (Promosi, Outlet, Pesaing, and Income) together predict 88.5% of the variation in Sales, with an adjusted R-square of 86.6%. The ANOVA table shows that the regression model is statistically significant (p < 0.001). The coefficients table indicates that only Promosi has a statistically significant relationship with Sales (p < 0.001), while Outlet, Pesaing, and Income do not.

Recommended
Recommended
More Related Content
Similar to Tugas 1 abdul rozak
More from Wahono Syahida
More from Wahono Syahida (20)
Tugas 1 abdul rozak
- 1. Sales (Y) 205 206 250 245 220 290 240 207 202 245 205 286 312 265 322 240 202 286 322 245 260 243 256 260 240 205 322 265 312 Promosi (X1) 26 28 35 31 26 49 35 30 22 31 26 47 54 50 57 35 22 47 57 31 43 28 24 43 35 26 57 50 54 Outlet (X3) 159 164 198 184 150 208 136 166 149 184 159 203 240 231 287 136 149 203 287 184 180 182 123 180 136 159 287 231 240 Pesaing (X4) 15 16 20 17 14 24 16 17 14 17 15 20 26 15 22 16 14 20 22 17 12 15 12 12 12 15 22 15 26 Income (X5) 5.46 5.48 6.05 5.80 5.50 6.48 5.60 5.47 5.00 5.80 5.46 6.20 6.52 6.00 6.80 5.60 5.00 6.20 6.80 5.80 5.23 5.40 5.32 5.23 5.60 5.46 6.80 6.00 6.52 Model Summary Adjusted R Model 1 R .941 R Square a .885 Std. Error of the Square Estimate .866 14.442 a. Predictors: (Constant), INCOME, PROMOSI, PESAING, OUTLET
- 2. b ANOVA Model 1 Sum of Squares Regression df Mean Square 38502.004 4 9625.501 5005.789 24 43507.793 Sig. 46.149 .000 a 208.575 28 Residual Total F a. Predictors: (Constant), INCOME, PROMOSI, PESAING, OUTLET b. Dependent Variable: SALES Coefficients a Standardized Unstandardized Coefficients Model 1 B Std. Error (Constant) 27.963 2.248 .524 OUTLET -.054 PESAING Beta t 62.004 PROMOSI Coefficients INCOME a. Dependent Variable: SALES Sig. .451 .656 .677 4.294 .000 .140 -.063 -.386 .703 .024 1.417 .003 .017 .986 25.865 16.675 .352 1.551 .134