Kedia daily bullion report as on 08052020
•
0 likes•82 views

Kedia Advisory Daily Bullion Report as on 08052020

Recommended
Recommended
More Related Content
What's hot
What's hot (12)
Similar to Kedia daily bullion report as on 08052020
Similar to Kedia daily bullion report as on 08052020 (20)
Recently uploaded
Recently uploaded (20)
Kedia daily bullion report as on 08052020
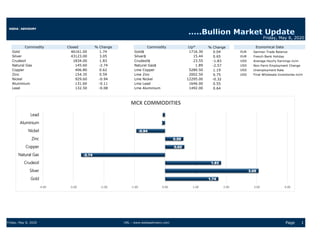
- 1. % Change 0.04 EUR 0.65 EUR -1.83 USD -2.57 USD 1.19 USD 0.75 USD -0.32 0 0.55 0 0.64 0 Friday, May 8, 2020 URL : www.kediaadvisory.com Page 1 Lead 132.50 -0.08 Lme Aluminium 1492.00 0 Aluminium 131.60 -0.11 Lme Lead 1646.00 0 Nickel 929.60 -0.94 Lme Nickel 12295.00 0 Zinc 154.35 0.59 Lme Zinc 2002.50 Final Wholesale Inventories m/m Copper 406.80 0.62 Lme Copper 5280.50 Unemployment Rate 1716.30 German Trade Balance Natural Gas 145.60 -2.74 Natural Gas$ 1.89 Non-Farm Employment Change Crudeoil 1834.00 1.83 Crudeoil$ 23.55 Average Hourly Earnings m/m Friday, May 8, 2020 Commodity Closed % Change Commodity Ltp* Economical Data Silver 43123.00 3.05 Silver$ 15.44 French Bank Holiday Gold 46161.00 1.74 Gold$ 1.74 3.05 1.83 -2.74 0.62 0.59 -0.94 -0.11 -0.08 -4.00 -3.00 -2.00 -1.00 0.00 1.00 2.00 3.00 4.00 Gold Silver Crudeoil Natural Gas Copper Zinc Nickel Aluminium Lead MCX COMMODITIES
- 2. % Chg % Chg Month Rate Jun Aug Oct Month Rate Jul Sep Dec Commodity Min Jun 46161 218.00 436.00 Jul 43123 400.00 977.00 Gold -40.00 Aug 46379 218.00 Sep 43523 577.00 Silver 35.00 Oct 46597 Dec 44100 Res - 1 Res - 2 1729.62 1743.86 Sup - 1 Sup - 2 1692.42 1669.46 Res - 1 Res - 2 15.53 15.74 Sup - 1 Sup - 2 14.96 14.61 Sup - 3 1766.82 1655.22 Pivot Res - 3 16.10 Sup - 3 14.40 Gold Last 4 Day Movement Silver Last 4 Day Movement Friday, May 8, 2020 URL : www.kediaadvisory.com Page 2 1.19% 4-May-20 14.943 15.010 14.757 14.758 -0.186 -1.24% 5-May-20 14.757 14.997 14.730 14.934 0.176 3.29% 6-May-20 14.935 15.119 14.832 14.832 -0.102 -0.68% 7-May-20 14.832 15.386 14.820 15.321 0.488 Date Open High Low Close Rs Chg % Chg 0.24% 4-May-20 1699.93 1709.10 1692.91 1700.74 2.12 0.12% 5-May-20 1700.75 1710.47 1693.52 1704.87 4.13 1.81% 6-May-20 1704.91 1707.28 1683.39 1684.94 -19.93 -1.17% 7-May-20 1684.83 1720.89 1683.69 1715.39 30.45 INTERNATIONAL MARKET SYNOPSIS Date Open High Low Close Rs Chg % Chg Max Avg 874.00 232.00 1478.00 645.00 Pivot Res - 3 Gold Silver Spread History 46772.00 47335.00 Fresh Buying Silver Jul 40708.00 41217.00 42170.00 42679.00 43632.00 44141.00 Gold Jun 44728.00 45034.00 45597.00 45903.00 46466.00 45094.00 Fresh Buying SPREAD SYNOPSIS 0.00 MCX PIVOT Contract Sup - 3 Sup - 2 Sup - 1 Pivot Res - 1 Res - 2 Res - 3 OI Status Silver Dec 0.00 0.00 0.00 44100.00 1050.00 2.44 0 0 3.05 21462 5792 13.37 Silver Sep 42458.00 43599.00 42456.00 43523.00 1185.00 Silver Jul 41840.00 43188.00 41726.00 43123.00 1278.00 2.80 135 29 52.63 0.00 Contract Open High Low Close Rs Chg % Chg Volume OI Gold Oct 0.00 0.00 0.00 46597.00 778.00 1.70 0 0 1.56 Gold Aug 45720.00 46403.00 45600.00 46379.00 784.00 1.72 617 6962 4.19 Gold Jun 45430.00 46209.00 45340.00 46161.00 790.00 1.74 9318 13489 Friday, May 8, 2020 MCX MARKET SYNOPSIS Contract Open High Low Close Rs Chg % Chg Volume OI
- 3. SELL GOLD JUN 2020 @ 45550 SL 45850 TGT 45200-44900.MCX SELL SILVER JUL 2020 @ 42000 SL 42450 TGT 41550-41200.MCX Friday, May 8, 2020 URL : www.kediaadvisory.com Page 3 Underscoring the deepening economic impact of Covid-19, a report showed that the U.S. service sector shrank for the first time in a decade last month. A report from payroll process ADP showed private sector employment nosedived in the month of April, plunging by 20.236 million jobs SILVER Silver trading range for the day is 41217-44141. Silver gained amid concerns about the economy after data showed unemployment claims remained at an elevated level last week. U.S. President Donald Trump said the coronavirus task force would be shut down in the coming weeks. Spread between LBMA and COMEX prices narrows SPDR gold holdings jump to 7-year high Gold trading range for the day is 45034-46772. Gold prices rose as another 3 million Americans filed for jobless benefits, reviving concerns about the outlook for the U.S. economy. Data showed U.S. private sector employment plunged by as much as 20.236 million jobs in April. Friday, May 8, 2020 GOLD
- 4. * Rates including GST * Rates including GST Exch. Descr. * Rates including GST Spread -773.00 -4643.00 -4673.00 -1223.00 -4603.00 -4633.00 -1063.00 -1178.00 Page Gold and Silver Ratio MCX GOLD SILVER RATIO 107.04 Gold London AM FIX Gold London PM FIX Silver London FIX 1696.30 1699.55 14.75 CMDTY CMDTY CMDTY Friday, May 8, 2020 BULLION SPOT MARKET SYNOPSIS 0 0 1724.60 1732.00 45525.00 35934.00 15.67 18.41 0.00 0.00 GOLD 27MAY2020 GOLD 29JUL2020 GOLD QUANTO 28MAY2020 GOLD QUANTO 30JUL2020 SILVER 26JUN2020 SILVER 27AUG2020 CMDTY Silver 999 - Hyderabad 38520.00 4 Bullion Futures on DGCX Exch. Descr. Ltp* DGCX DGCX Intl Spot GOLD SILVER RATIO 111.20 CMDTY Silver 999 - Kolkata 42060.00 CMDTY Silver 999 - Mumbai 41945.00 DGCX DGCX DGCX DGCX DGCX DGCX Friday, May 8, 2020 URL : www.kediaadvisory.com CMDTY Silver 999 - Jaipur 38490.00 CMDTY Silver 999 - Bangalore 38480.00 Silver 999 - Chennai 38450.00 CMDTY Silver 999 - Delhi 41900.00 Silver Spot 999 Exch. Descr. Ltp* Gold and Silver Fix Exch. Descr. Ltp* Gold 999 - Jaipur Gold 999 - Mumbai46780.00 47050.00 CMDTY CMDTY 42415.00 47200.00 47150.00 42350.00 42400.00 42405.00 46990.00 42400.00 Gold 999 - Ahmedabad Gold 999 - Bangalore Gold 999 - Chennai Gold 999 - Cochin Gold 999 - Delhi Gold 999 - Hyderabad Gold 995 - Delhi Gold 995 - Hyderabad Gold 995 - Jaipur CMDTY CMDTY CMDTY CMDTY CMDTY CMDTY CMDTY CMDTY CMDTY CMDTY 47020.00 42200.00 42250.00 42255.00 46840.00 42250.00 Gold Spot 995 Gold Spot 999 CMDTY CMDTY Silver 999 - Ahmedabad 42350.00 CMDTY CMDTY Gold 995 - Kolkata Gold 995 - Mumbai 42295.00 Ltp*Descr. CMDTY CMDTY CMDTY Gold 995 - Ahmedabad Exch. Ltp*Descr. Exch. Gold 995 - Bangalore Gold 995 - Chennai Gold 995 - Cochin Delhi - Mcx Gold 989.00 -3811.00 -3761.00 -3756.00 829.00 Ltp* -3761.00 -3746.00 1039.00 Jaipur - Mcx Silver Kolkata - Mcx Silver Mumbai - Mcx Silver Gold 999 Hyderabad - Mcx Gold Jaipur - Mcx Gold Mumbai - Mcx Gold SPOT Vs MCX SPREAD Silver 999 Ahmedabad - Mcx Silver Bangalore - Mcx Silver Chennai - Mcx Silver Delhi - Mcx Silver Hyderabad - Mcx Silver Spread Ahmedabad - Mcx Gold Bangalore - Mcx Gold Chennai - Mcx Gold Cochin - Mcx Gold
- 5. Friday, May 8, 2020 Friday, May 8, 2020 URL : www.kediaadvisory.com Page 5 Year JAN FEB MAR APR MAY JUN JUL AUG SEP OCT NOV DEC Growth 19922 20923 20693 22820 22426 21904 23166 27184 25989 27343 29061 27329 6601.00 -3.89 5.02 -1.10 10.28 -1.73 -2.33 5.76 17.34 -4.40 5.21 6.28 -5.96 31.85 28078 27952 28518 29183 29148 29665 29749 31206 31535 31105 31076 30859 3530.00 2.74 -0.45 2.02 2.33 -0.12 1.77 0.28 4.90 1.05 -1.36 -0.09 -0.70 12.92 29871 29570 29394 26905 26874 25669 28207 35074 29874 29793 29234 28364 -2495.00 -3.20 -1.01 -0.60 -8.47 -0.12 -4.48 9.89 24.35 -14.83 -0.27 -1.88 -2.98 -8.09 29462 30090 28536 28887 26863 27776 27818 27996 26313 25881 25835 26703 -1661.00 3.87 2.13 -5.16 1.23 -7.01 3.40 0.15 0.64 -6.01 -1.64 -0.18 3.36 -5.86 27895 26477 26204 26716 26860 26471 24813 26682 25856 26499 25069 24931 -1772.00 4.46 -5.08 -1.03 1.95 0.54 -1.45 -6.26 7.53 -3.10 2.49 -5.40 -0.55 -6.64 26638 29513 28549 30266 28627 31199 31549 30724 30742 29950 28385 27445 2514.00 6.85 10.79 -3.27 6.01 -5.42 8.98 1.12 -2.61 0.06 -2.58 -5.23 -3.31 10.08 28942 29566 28463 28873 28843 28439 28557 29745 29557 29153 29012 29000 1555.00 5.45 2.16 -3.73 1.44 -0.10 -1.40 0.41 4.16 -0.63 -1.37 -0.48 -0.04 5.67 30117 30379 30408 31036 30831 30432 29653 30129 30481 31748 30240 31391 2391.00 3.85 0.87 0.10 2.07 -0.66 -1.29 -2.56 1.61 1.17 4.16 -4.75 3.81 8.24 33096 33286 31998 31756 32266 34206 35420 38805 37323 38578 38031 39108 7717.00 5.43 0.57 -3.87 -0.76 1.61 6.01 3.55 9.56 -3.82 3.36 -1.42 2.83 24.58 41000 41397 43000 44906 5798.00 4.84 0.97 3.87 4.43 14.83 7.512.50 -1.43 -0.56 1.21 -0.94 -0.26 2016 2017 2018 GOLD PRICE MOVEMENT SINCE 2011 2011 Average 2012 2013 2014 2015 -3.10Average 1.78 2.33 1.18 2019 0.66 2020
- 6. Note: 5 Mumbai. India. Mobile: 09323406035 / 09819296333 Email: URL: www.kediaadvisory.com Buy at supports and sell at target. Support broken becomes resistance and a resistance broken becomes support. Always use Stop-loss never average loss making positions. This report is based on previous closing. levels may change based on next day’s opening price. Please register on the site for daily levels.Yahoo messenger id is for getting latest levels on your messenger. The call expires once the target is achieved or the stop-loss is hit.The calls given in this report are valid only for the current day. A trader should understand that, he/she should not carryforward the trade, unless explicitly stated. DateSource:MCX, NCDEX, COMEX, NYMEX, and other Exchange. Disclaimer:The calls made herein are for informational purpose and report contains only the viewpoints. We make no representation or warranty regarding the correctness, accuracy or completeness of any information, and is not responsible for errors of any kind though the information obtained from the sources, which is believed to be reliable. The information contained herein is strictly confidential and is meant for the intended recipients. Any alteration, transmission, photocopied distribution in part or in whole or reproduction of any form of the information without prior consent of Kedia Stocks & Commodities Research Pvt Ltd. is prohibited. The information and data are derived from the source that are deemed to be reliable the above calls are based on the theory of Technical Analysis. Neither the company nor its employee is responsible for the Profit (es) &loss (es) arising due to the trader(s). The commodities and derivatives discussed and opinions expressed in this report may not be suitable for all investors falling under different jurisdictions. All futures entail significant risk, which should be fully understood prior to trading. Consult your Investment Advisor / Broker before making any investment.www.kediaadvisory.com Friday, May 8, 2020 URL : www.kediaadvisory.com Page Contact Details Kedia Stocks & Commodities Research Pvt Ltd. SEBI REGISTRATION NUMBER - INH000006156