1. The Evolution of R: Growth of the R-Help Email Archives over Time
Richard Kwock, Robert E. Weiss
University of California, Los Angeles, Biostatistics, U.S.A.
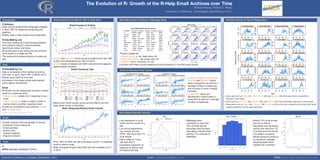
Introduction Email Activity From March 1997 to April 2012 Most Mentioned Functions in Message Body Monthly Activity of Top 20 Responders
R Software Email Counts of Archive
Starter Emails
Response Emails
1. Prof Brian Ripley 2. David Winsemius 3. Gabor Grothendieck 4. Peter Dalgaard
Open source programming language released 1. c 2. function 3. library 4. list 5. plot
150 250
050 150 250
200
0 50 150 250
Overall Starter Response
0 200 400 600
0 100 200 300
150
0 20 40 60
Top 30 Most Mentioned Functions
4000
in April 1997 for statistical computing and
0 50 100
0 50 100
Function Counts Function Counts Function Counts
0 50
graphics
0 50
c 60623 paste 11977 par 6601
3000
98 02 06 10 98 02 06 10 98 02 06 10 98 02 06 10 98 02 06 10
Widely used in data analysis and exploration function 30607 seq 9347 return 6100 6. data.frame 7. length 8. matrix 9. rep 10. rnorm
0 50 150 250
0 50 100 150
0 50 100 150
0 50 100 150
library 23875 for 8609 factor 5991
0 50 100150
98 02 06 10 98 02 06 10 98 02 06 10 98 02 06 10
Email Counts
list 20267 summary 8599 lapply 5635
R-help Mailing List
2000
5. Uwe Ligges 6. Duncan Murdoch 7. jim holtman 8. Thomas Lumley
0 10 30 50
plot 17920 print 8514 if 5603
020 60 100
Frequency
50 100
The main mailing list for discussing problems data.frame 17204 cbind 8449 sample 5576 98 02 06 10 98 02 06 10 98 02 06 10 98 02 06 10 98 02 06 10
0 20 60
length 15574 lm 7977 apply 5471 11. paste 12. seq 13. for 14. summary 15. print
1000
50 100 150
and solutions using R, announcements,
50 100
50 100
50 100
matrix 13144 read.table 7914 nrow 5381
0 20406080
benchmark codes, and more
0
rep 13065 names 7461 runif 5342
All emails sent to the mailing list are archived rnorm 12976 sum 7253 str 5216
0
0
0
0
98 02 06 10 98 02 06 10 98 02 06 10 98 02 06 10
0
Response Emails
98 02 06 10 98 02 06 10 98 02 06 10 98 02 06 10 98 02 06 10
9. Marc Schwartz 10. Henrique Dallazuanna 11. Greg Snow 12. Martin Maechler
each month in a single text file 1997 1998 1999 2000 2001 2002 2003 2004 2005 2006 2007 2008 2009 2010 2011 2012
Popular categories 16. cbind 17. lm 18. read.table 19. names 20. sum
0 20 60 100
0 20 60 100
0 20 40 60 80
50 100
0 10 20 30
0 20 40 60
50 100
Year
0 20 40 60
0 20406080
The mailing list receives dozens of emails per data structure: c, list, data.frame, etc
day Overall and response email counts increased from late 1997 data manipulation: rep, paste, seq, etc
0
0
to 2010 and decreased from 2010 to 2012 statistics rnorm, summary, lm, etc Time in Year
98 02 06 10 98 02 06 10 98 02 06 10 98 02 06 10 98 02 06 10
Data Starter emails increased until 2005 and since then appears Functions with fewer counts experience more fluctuation in monthly email counts 98 02 06 10 98 02 06 10 98 02 06 10 98 02 06 10
approximately constant 13. Spencer Graves 14. Deepayan Sarkar 15. Ted Harding) 16. Douglas Bates
0 10 20 30 40
0 10 20 30 40
0 20 40 60
0 10 20 30
R-Help Mailing List Email Counts by Year Trend of Selected Email Topics
Data is composed of the mailing list archive 4000
from last 15 years, April 1997 to March 2012* Computational Topics Statistical Topics
Proportion Graph Topics Average Graph Topic Responses Proportion Bayesian Topics Average Bayesian Topic Responses
0.30
0.00 0.02 0.04 0.06 0.08
Emails were read into R as text Graphics, Speed, Data Mining, 98 02 06 10 98 02 06 10 98 02 06 10 98 02 06 10
4
3000
3
0.20
3
17. Jim Lemon 18. John Fox 19. Frank E Harrell Jr 20. hadley wickham
Information from these emails were parsed
2
Survival and Bayesian topics
Email Counts
2
0 20 40 60
0.10
010 30 50
0 10203040
1
1
using regular expressions
0 510 20
2000
grew in proportion as well as in
0.00
0
0
1998 2002 2006 2010 1998 2002 2006 2010 1998 2002 2006 2010 1998 2002 2006 2010
Proportion Speed Topics Average Speed Topic Responses Proportion Longitudinal Topics Average Longitudinal Topic Responses
average number of responses
0.06
5
0.00 0.02 0.04 0.06 0.08
3
Email 1000
and continue to have a steady
4
0.04
2
3
All emails can be categorized as either a starter increase 98 02 06 10 98 02 06 10 98 02 06 10 98 02 06 10
2
0.02
1
0
1
email or a response email
0.00
Longitudinal topics are Year
0
0
Jan Feb Mar Apr May Jun Jul Aug Sep Oct Nov Dec 1998 2002 2006 2010 1998 2002 2006 2010 1998 2002 2006 2010 1998 2002 2006 2010
Starter emails: emails not in response to any 1997 2001 2005 2009
Proportion Data Mining Topics Average Data Mining Topic Responses Proportion Survival Topics Average Survival Topic Responses
decreasing in recent years in Early users such as Ripley (#1), Grothendieck (#3) and Dalgaard (#4) show early rise to a peak then a
4
5
0.00 0.02 0.04 0.06 0.08
1998 2002 2006 2010
email decrease in later years
4
0.04
3
1999 2003 2007 2011
2000 2004 2008 2012 proportion as well as in average
3
2
response emails: emails in reply to either a
0.02
2
number of responses Users such as Winsemius (#2), Murdoch (#6), and Holtman (#7) have increasing responses in recent years
1
Most active month usually occurs around March and the
1
0.00
starter email or another response email
0
0
Responders such as Ligges (#5), Schwartz (#9), Harding (#15) do not have a simple time trend and their email
least active month is December 1998 2002 2006 2010 1998 2002 2006 2010 1998 2002 2006 2010 1998 2002 2006 2010
Emails are composed of two sections: header Year Year
response behaviors are not easily described
Ratio (Response/Starter) Email Counts
and message body
* https://stat.ethz.ch/pipermail/r-help/ Daily/Weekly/Monthly Activity
2.0
Hour Day of Week Month
Goals
Ratio (Response/Starter)
Overall Peak time at 8am
Starter Down time at 10pm
Line represents a cyclic Response
Weekdays each Almost 10% of all emails
1.5
Visually present trend and growth of various trend over the course of a contribute to more than sent are in March 0.095
component of the mailing list day
0.07
15% of email activity 0.15
December has the lowest 0.090
Email activities
1.0
List server experiences 0.06
Saturdays and Sundays activity with less than 7%
Active users max activity at 8 am 0.05 have about half the email of emails sent that month 0.085
Density
Density
0.10
Popular subjects (PST), with more than 7% activity (7%) compare to The pattern of activity
Density
0.5
0.04
Popular functions 1997 1998 1999 2000 2001 2002 2003 2004 2005 2006 2007 2008 2009 2010 2011 2012 of all emails weekdays follows behavior similar to
0.080
0.03
0.05
Year
Hits a valley at 10 pm, an academic calendar 0.075
Tools From 1997 to 2003, the ratio fluctuates around 1.0 response with less than 2 0.02
showing peaks when 0.070
email to starter email Consistent proportion of 0.01
0.00 classes are in session
R Ratio increased linearly after 2003 and hits a plateau at 2.2 response to starter ratio Sun Mon Tue Wed Thu Fri Sat
Jan Feb Mar Apr May Jun Jul Aug Sep Oct Nov Dec
lattice package (Deepayan Sarkar) in 2010 throughout the day.
12am 3am 6am 9am 12pm
Time (PST)
3pm 6pm 9pm
Day of Week Month
University of California, Los Angeles, Biostatistics, U.S.A. Email: richardkwock@gmail.com WWW: http://www.biostat.ucla.edu/