VVIP Pune Call Girls Hadapsar (7001035870) Pune Escorts Nearby with Complete ...
Data Tambang 01.pptx
1. 1
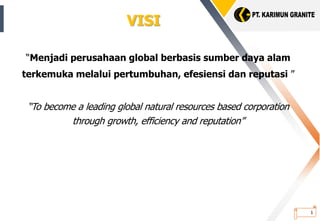
VISI
“Menjadi perusahaan global berbasis sumber daya alam
terkemuka melalui pertumbuhan, efesiensi dan reputasi ”
“To become a leading global natural resources based corporation
through growth, efficiency and reputation”
2. OSO Securities
COMPANY PROFILE
The Rock (“The Company”) was established on September 29th, 1971. The
company operates in mining industry which produce the granite building &
construction materials, and manufactured sand with such huge reserves, the
company’s quarry is the largest quarry in Southeast Asia and has tremendous
potential business.
Vision
Become the market leader in South East Asia
Mission
With 3.7 billion granite reserve the biggest and richest quarry in South
East Asia
2
3. OSO Securities
LOCATION AND PRODUCT
The Company geographically located at position
1° 6’ 21.4” N to 1° 8’ 7.5 “ N latitude and
between 103° 19’ 59.0°” E to 103° 21’ 26.8” E.
Precisely in Karimun Besar Island, Pasir
Panjang Village, Meral district, Karimun, Riau
Islands Province. By Ferry, Karimun can be
reached in 1 hour and 45 minutes from
Singapore and 1 hour 15 minutes from Batam
Island.
As at the moment the Company is producing
Crushed Stone which consisting of 4 types: 1)
Armor Rock, 2) Aggregates, 3) Road Base, and
4) Manufactured Sand. The products are sold
at varying prices according to the type as
many as 90% - 95% are sold to Singapore and
domestic markets. 3
Location
Products
6. OSO Securities
TOTAL VOLUME OF PRODUCTION (In Mt. ton)
Source: Company
5,650,000 6,000,000
7,200,000
8,400,000
9,600,000
10,800,000
-
2,000,000
4,000,000
6,000,000
8,000,000
10,000,000
12,000,000
2020 2021 2022 2023 2024 2025
Yearly
Production
6
7. OSO Securities
TOTAL VOLUME OF PRODUCTION (In Mt. ton)
7
Source: Company
Average of monthly
production
470,833
500,000
600,000
700,000
800,000
900,000
44,650
36,000
37,000
38,000
39,000
40,000
41,000
42,000
43,000
44,000
45,000
46,000
-
100,000
200,000
300,000
400,000
500,000
600,000
700,000
800,000
900,000
1,000,000
2020 2021 2022 2023 2024 2025
Production (LHS) Cost/ton by process (RHS)
39,500
The bigger volume of
production, the cheaper
production cost
8. OSO Securities
TOTAL SALES (in millions IDR)
8
16,009 18,103
77,893 98,736
554,005 572,280
686,736
801,192
915,648
1,030,104
-
200,000
400,000
600,000
800,000
1,000,000
1,200,000
2016 2017 2018 2019 est 2020 F 2021 F 2022 F 2023 F 2024 F 2025 F
Source: Company
9. OSO Securities
Local Market
Export Market
60%
40%
Local Market
• Revenue in Rp
Export Market
• Long Term Contract
• Revenue in Sin $.
9
MARKET SEGMENT
10. OSO Securities
Source: Company’s FS2020
Sales Volume 2019 2020 2021-2025
Export 90% 67% 60%
Local 10% 33% 40%
60%
40%
2021-2025
Export Sales Local Sales
Graded
Stones
20%
Aggregate
56%
M. Sand
24%
Graded Stones
20%
Aggregate
56%
M. Sand
24%
Composition of
Export
Composition of
Domestic
THE COMPOSITION OF SALES VOLUME (export-import)
10