Dry powder or particles in aqueous /organic suspension
- Truly Automodal: You don\'t need to know anything related to size / modalities prior to running sample.
- Highest accuracy: Scattered data Cannot be manipulated to meet modality expectations. You get what what you have in there. 1 single answer every time.
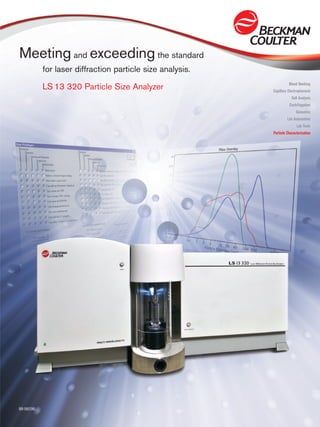
1. Meeting and exceeding the standard
for laser diffraction particle size analysis.
Blood Banking
LS 13 320 Particle Size Analyzer Capillary Electrophoresis
Cell Analysis
Centrifugation
Genomics
Lab Automation
Lab Tools
Particle Characterization
BR-9809B
2. LS 13 320 Integrated smart solutions for
laser diffraction particle size analysis
The LS 13 320 Series is the most versatile and Our latest generation of sample-handling modules has
sophisticated laser diffraction particle size analyzer been designed for flexibility and convenience, offering
available today. Using the Fraunhofer and Mie theories varying degrees of automation. To save operators valuable
of light scattering, the LS 13 320 Series offers the time, all modules “auto-dock” in seconds and are
highest resolution, reproducibility and unsurpassed automatically configured and recognized by the optical
accuracy. All this, so you can count on the results bench due to their “plug-and-play” capabilities. To
generated by the LS 13 320 Series. In fact, the facilitate meeting compliance requirements, all the
LS 13 320 can measure unknown sample distributions module functions are fully controlled via Standard
without having the analyst guess the type of distribution Operating Methods (SOM’s) and Standard Operating
mode to preprogram the instrument. Procedures (SOP’s), making their operation simple
and ensuring that all instrument conditions and settings
Depending on your applications and requirements, two
remain constant for any given sample. If full automation
options of optical benches are available: the single-
is required, the Auto Prep Station is available with
wavelength system covering a size range from 0.4 µm
up to 30 samples for walk-away routines.
to 2,000 µm and the flagship multi-wavelength system
incorporating Beckman Coulter’s Polarization Intensity Equally at home in research and development, quality
Differential Scattering (PIDS) technology covering control and manufacturing, the LS 13 320 particle
a size range from 0.017 µm to 2,000 µm. size analyzer provides the analyst with a system that
is easy to use, producing fast and reliable results, yet
technically advanced for dry, aqueous and non-aqueous
samples to satisfy all your particle sizing needs.
2
3. Step 1
Load your
SOM or SOP
Step 2
Click Start
Power, flexibility and simplictiy SOM or SOP
are the driving force behind the
LS 13 320 software.
Step 3
Get results
Presenting your results in a flexible way Efficient data management
The LS 13 320 software offers great flexibility when The LS 13 320 software allows the customization
presenting your results. Whether for pharmaceutical, of data output and printed reports. Through the use
industrial, quality control, or research applications, of SOP’s or preference files, design the report that
the software will satisfy any requirements for best fits your needs.
data presentation.
3
4. SOM & SOP Standardize your process with
Standard Operating Procedures and Methods
Establishing the SOM is quick, simple and foolproof
With Standard Operating Methods and Procedures, you
can ensure your analyses are the same run after run.
The use of SOM’s and SOP’s guarantee consistency and
uniformity of your results, regardless of the instrument
settings, operators and locations.
Step 1 Your solution to
Set up your SOM and
sample description consistent results
and reports.
Step 2
Identify your sample
Step 3
Set up your anlaysis
parameters
Step 4 Standard Operating Procedure (SOP)
Choose your optical
model Every element of the analysis from method set-up
to the final printout can be implemented into a user
definable Standard Operating Procedure (SOP).
Step 5 Just select an SOM and Preference file and save
them as an SOP. Then click “Start SOP” and
Save your SOM you’re on your way to consistent results.
4
5. Size Trend
The Size Trend function is used to plot the statistics
of several sample runs on one graph or report.
This can help you keep track of your specific
process since the files can be updated as often
as necessary.
Software designed
with the user in mind.
Cum. <
ASTM Volume %
999 0
400 79.5164
Sieve Analysis 325 83.6407
270 87.4781
230 91.1161
The Sieve Analysis function
200 94.0814
allows you to view the 170 96.2735
data obtained from your 140 97.5502
120 98.4782
LS 13 320 in a sieve 100 99.2856
format if you need to 80 99.8087
70 99.9786
compare old sieve data.
60 99.9993
50 100
45 100
40 100
35 100
30 100
25 100
20 100
Interpolation
The LS 13 320 software can be used to create
sample reports that will arrange the data to conform
to a set of user defined “size classes” through the
Size Interpolation function.
5
6. ISO 13 320 Meeting and exceeding
the standard
With the publication of the International
Standard ISO 13320, Particle size analysis —
Laser diffraction methods, it becomes possible
for users to evaluate statistics within a scientific
frame of reference.
Accuracy
The response of the laser diffraction instrument is
considered to meet this standard if the mean value
of the X50 coming from at least three independent
measurements deviates less than 3% from the certified
range of values specified for the material, i.e. the mean
value together with its standard deviation; the mean
values for the X10 and X90 should deviate less than
5% from the certified range of values.
Repeatability
The repeatability of characteristic particle sizes in size
distributions should be as follows: for any chosen
central value of the distribution, e.g. the median size
(X50), the coefficient of variation should be smaller than
3%. Values at the sides of the distribution, e.g. X10
and X90, should have a coefficient of variation not
exceeding 5%.
An average of 10 separate runs showing the spread
of results with error bars of one standard deviation.
6
7. Resolution & Sensitivity
The resolution of the particle size
distribution, i.e. capability to differ-
entiate between different particle
sizes, and the sensitivity for small
(extra) amounts of particles of
certain size are restricted by the
following factors:
• Number, position and geometry
of the detector elements
• Signal to noise ratio
• Fine structure in the measured
scattering pattern
• Difference in scattering pattern
between size classes
• Actual size range of the
particulate material
• Adequacy of the optical model
• Smoothing applied in the
deconvolution procedure
How does the LS 13 320 comply?
Accuracy Resolution & Sensitivity Repeatability
• Custom designed X-shaped detector • High number of log-spaced detectors • The automatic alignment system
array allows the most accurate provide a clear difference in scattering ensures accurate angular calibration
measurement to be obtained for the pattern between size classes of the laser with respect to the
characterization of the scattering • Continuous averaging amplification optical path. The benefit of this is
pattern, which ultimately leads to circuitry to increase signal-to-noise that the scattered light from any
the most accurate results possible ratio particulates in the sample cell will
• The PIDS system delivers unrivaled fall on the correct detectors from
• No requirement to pre-select curve an angular perspective, offering
accuracy in the submicron region fitting routines as with other manu-
by taking 36 detection measure- reproducible results time after time
facturers, meaning the user has
ments for this region alone. No no need to have an understanding • High quality components throughout
other comparable system offers of the nature of the distribution the LS 13 320 design
this degree of capability in the prior to the analysis
submicron region
• Full and complete invocation of
both Fraunhofer and Mie theories,
including the use of multi-wave-
length modeling, ensures the user
can make most benefit of the
available raw data
7
8. Security 21 CFR Part 11 and
instrument qualification process
Security
The LS 13 320 software comes with a configurable security system.
The user can choose between 5 levels of security, from No security
to 21 CFR Part 11, the choice is yours. Choosing 21 CFR Part 11
configures the software to be compliant to 21 CFR Part 11, the FDA
regulation covering electronic signatures and records.
One click away
from compliance.
8
9. Regulatory Compliance
The Electronic Records and Electronic
Signatures Rule (21 CFR Part 11)
was established by the FDA to define
the requirements for submitting docu-
mentation in electronic form and the
criteria for approved electronic signa-
tures. This rule, which has been in
effect since August 20, 1997, does
not stand in isolation; it defines the
standards by which an organization
can use electronic records to meet
its record-keeping requirements.
Organizations that choose to use
electronic records must comply with
21 CFR Part 11. It is intended to
improve an organization’s quality
control while preserving the FDA’s
charter to protect the public. Since
analytical instrument systems such
as the LS 13 320 generate electronic records, these systems
must comply with the Electronic Records Rule. By selecting the
21 CFR Part 11 option in the software, the system automatically
reconfigures to comply with these regulations. In addition to the
21 CFR Part 11, the software offers other security levels that may
be customized by the user.
V-Check Program
The V-Check Program is a comprehensive package that covers
appropriate aspects of a product’s life cycle, from instrument
development to verification (e.g. SQ, DQ, IQ, OQ). The V-Check
Program contains the necessary documentation for instrument
validation. It consists of a number of functional inter-linked
components, which have been designed to give you assurance
that the product is fit for its designed purpose and will deliver
consistent performance. Where other instrument manufacturers
leave off, Beckman Coulter and its V-Check Program assist
with ongoing quality checks of the instrument – demonstrating
the value of a manufacturer who not only understands your
needs, but is also willing to develop a partnership for the future.
9
10. Operating Principles
Beckman Coulter Firsts:
• First company offering wide dynamic range without changing lenses
• First company with auto-alignment
• First company to utilize four wavelengths
• First and only company to incorporate scattering technology – PIDS
PIDS Detectors
High Angle Detectors
Low Angle Detectors
Multiple
Wavelength
PIDS Wheel Mid Angle Detectors
PIDS Light Source
Sample Chamber
Fourier Lens
Laser
The scattering of light is one of the most widely used within a suitable sample cell. The light scattered by the
techniques for measuring the size distribution of particles. particles is then detected by silicon photo-detectors.
It is a fast and flexible technique that offers even the The intensity of light on each detector measured as
novice user the chance to obtain high quality data. a function of angle, is then subjected to mathematical
analysis using a complex inversion matrix algorithm.
The basis of the method is simple: a laser light source
The result is a particle size distribution displayed as
is used to illuminate particulates, usually contained
volume % in discrete size classes.
10
11. PIDS PIDS relies upon
Polarization Intensity Differential Scattering the transverse
nature of light i.e.,
Why use PIDS for sizing sub-micron particles rather that it consists of
than the standard forward low-angle scattering tech- a magnetic vector
nologies employed by other instrument manufacturers? and an electric
Particles below a few microns in diameter have very vector at ninety
similar light scattering patterns that are alike in both degrees to it. If for
shape and intensity. These physical properties make example the elec-
it difficult to distinguish the differences between such tric vector is ‘up
patterns, which means inaccurate sizing with low and down’ the
resolution, resulting in a high degree of uncertainty light is said to be
when resolving the actual particle size. vertically polarized.
When a sample is illuminated with a light of a given
polarized wavelength, the oscillating electric field
establishes a dipole, or oscillation, of the electrons
in the sample. These oscillations will be in the same
plane of polarization as the propagated light source.
The oscillating dipoles in the particles radiate light in
all directions except that of the irradiating light source.
PIDS takes advantage of this phenomenon. Light at
three wavelengths (450 nm, 600 nm, and 900 nm)
Large particles scatter light strongly at low angles sequentially irradiates the sample, with first vertical and
and with readily detectable maxima and minima in the then horizontal polarized light. The LS 13 320 measures
scattering pattern. This means that detectors placed the scattered light from the samples over a range of
at low angles relative to the optical path and with angles. By analyzing the differences between the
sufficient angular resolution can detect these maxima horizontally and the vertically radiated light for each
and minima. Conversely small particles scatter light wavelength, we gain information about the particle size
weakly and without any discernible maxima and distribution of the sample. It is important to remember
minima until extremely high angles of measurement are that we are measuring the differences between the
reached. This makes the detection and the resolution vertically and the horizontally polarized signals, and
of the scattering pattern difficult. not simply the values of a given polarization.
Manufacturers have adopted different solutions to The intensity vs. scattering angle information from the
overcome these limitations with varying degrees of PIDS signals is then incorporated into the standard
success. Most efforts have focused on the measurement algorithm from the intensity vs. scattering angle data
of back-scattered light. While such strategies help they from the laser light scattering to give a continuous size
are not complete solutions. For this reason Beckman distribution.
Coulter developed the PIDS system, allowing for the first Another major benefit of acquiring PIDS data is that by
time a complete solution to the problem of sub-micron simple interpretation of the raw data we can quickly
sizing. The technology employed in PIDS is elegant confirm whether small particles are genuinely present
yet simple and takes advantage of the Mie theory of or not, as large particles do not exhibit the differential
light scattering. signal shown by small particles.
Benefit from
the increased
sensitivity and
performance –
real data means
real results.
11