
Recommended
More Related Content
What's hot
Similar to Women prisoners rs
Similar to Women prisoners rs (18)
More from ZahidManiyar
More from ZahidManiyar (20)
Recently uploaded
Recently uploaded (7)
Women prisoners rs
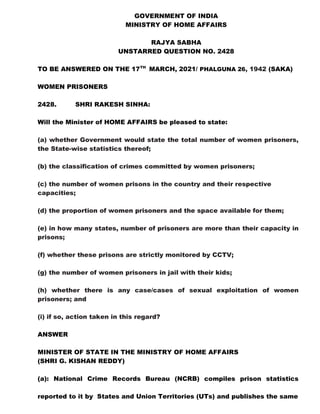
- 1. GOVERNMENT OF INDIA MINISTRY OF HOME AFFAIRS RAJYA SABHA UNSTARRED QUESTION NO. 2428 TO BE ANSWERED ON THE 17TH MARCH, 2021/ PHALGUNA 26, 1942 (SAKA) WOMEN PRISONERS 2428. SHRI RAKESH SINHA: Will the Minister of HOME AFFAIRS be pleased to state: (a) whether Government would state the total number of women prisoners, the State-wise statistics thereof; (b) the classification of crimes committed by women prisoners; (c) the number of women prisons in the country and their respective capacities; (d) the proportion of women prisoners and the space available for them; (e) in how many states, number of prisoners are more than their capacity in prisons; (f) whether these prisons are strictly monitored by CCTV; (g) the number of women prisoners in jail with their kids; (h) whether there is any case/cases of sexual exploitation of women prisoners; and (i) if so, action taken in this regard? ANSWER MINISTER OF STATE IN THE MINISTRY OF HOME AFFAIRS (SHRI G. KISHAN REDDY) (a): National Crime Records Bureau (NCRB) compiles prison statistics reported to it by States and Union Territories (UTs) and publishes the same
- 2. --2-- R.S.US.Q.NO. 2428 FOR 17.03.2021 in its annual report “Prison Statistics India”. The latest published report is of the year 2019. State and UT-wise number of women prisoners lodged in various jails of the country as on 31.12.2019 are given in Annexure-I. (b): Details of classification of various crimes committed by women prisoners as reported to NCRB by States and UTs are given in Annexure-II. (c) & (d): As against the 4,78,600 inmates lodged in various jails of the country as on 31.12.2019, 19,913 were women inmates. There are 31 exclusive women jails in various States and UTs with a capacity of 6,511 women inmates, against which 3,652 women inmates are lodged. At places where there are no exclusive women jails, women prisoners are lodged in special barracks/ enclosures separate from male inmates, depending upon the requirement. Various jails in States and UTs of the country have a total capacity for 27,703 women inmates, against which 19,913 women inmates are lodged. State and UT-wise details in this regard, as on 31.12.2019, is given in Annexure-III. (e): State and UT-wise capacity of prisons and actual inmate population as on 31.12.2019 are given in Annexure-IV. (f): As per the latest published data of NCRB, 22,456 CCTVs have been installed in various jails of the country as on 31.12.2019.
- 3. --3-- R.S.US.Q.NO. 2428 FOR 17.03.2021 (g): 1,543 women prisoners having kids are lodged in various jails of the country as on 31.12.2019. (h) & (i): ‘Prisons’, ‘persons detained therein’ and ‘Police’ are State subjects as per List II of Seventh Schedule to the Constitution of India. The State Governments are competent to deal with such offences under extant provisions of laws. Specific information in this regard is not maintained centrally.
- 4. --2-- R.S.US.Q.NO. 2428 FOR 17.03.2021 ANNEXURE-I State and UT-wise number of women prisoners as on 31.12.2019 S No. State/UT Number of Women Prisoners 1 Andhra Pradesh 466 2 Arunachal Pradesh 8 3 Assam 307 4 Bihar 1324 5 Chhattisgarh 883 6 Goa 34 7 Gujarat 563 8 Haryana 642 9 Himachal Pradesh 87 10 Jammu & Kashmir @ 126 11 Jharkhand 813 12 Karnataka 611 13 Kerala 173 14 Madhya Pradesh 1758 15 Maharashtra 1569 16 Manipur 54 17 Meghalaya 29 18 Mizoram 189 19 Nagaland 4 20 Odisha 587 21 Punjab 1244 22 Rajasthan 589 23 Sikkim 12 24 Tamil Nadu 743 25 Telangana 445 26 Tripura 45 27 Uttar Pradesh 4174 28 Uttarakhand 262 29 West Bengal # 1479 30 A & N Islands 7 31 Chandigarh 49 32 D&N Haveli * 0 33 Daman & Diu * 5 34 Delhi 629 35 Lakshadweep 0 36 Puducherry 3 Total 19913 @ Jammu and Kashmir and Ladakh are now Union Territories. This is consolidated data of both UTs - Jammu and Kashmir and Ladakh. * D&N Haveli and Daman & Diu have since been merged into one UT. # Due to non-receipt of data from West Bengal for the year 2018 & 2019, data furnished for 2017 has been used.
- 5. R.S.US.Q.NO. 2428 FOR 17.03.2021 ANNEXURE-II Classification of crimes committed by women prisoners S No. Offence Indian Penal Code (IPC) Crimes 1 Murder 2 Attempt to Murder 3 C.H. not amounting to Murder 4 Rape 5 Kidnapping & Abduction 6 Dacoity 7 Prep. and Assembly for Dacoity 8 Robbery 9 Burglary 10 Thefts 11 Extortion 12 Riots 13 Arson 14 Criminal Breach of Trust 15 Cheating 16 Counterfeiting 17 Dowry Deaths 18 Assault on Women with Intent to Outrage her Modesty 19 Insult to the Modesty of Women 20 Cruelty by Husband or Relatives of Husband 21 Other IPC Crimes Special and Local Laws (SLL) Crimes 22 Arms Act 23 NDPS Act 24 Gambling Act 25 Excise Act 26 Prohibition Act 27 Explosive & Explosive Substances Act 28 Terrorist & Distruptive Activities Act (TADA) 29 Immoral Traffic (Prevention) Act 30 Indian Railways Act 31 Registration of Foreigners Act 32 Protection of Civil Rights Act 33 SC/ST (Prevention of Atrocities) Act 34 Indian Passport Act 35 Essential Commodities Act 36 Antiquities and Art Treasures Act 37 Dowry Prohibition Act 38 Foreign Exchange Regulation Act 39 Prevention of Corruption Act 40 Conservation of Foreign Exchange & Prev. of Smuggling Act 41 Other SLL Crimes
- 6. R.S.US.Q.NO. 2428 FOR 17.03.2021 ANNEXURE-III State / UT-wise Women Capacity, Women Population and Occupancy in Women Jails and Total Jails as on 31.12.2019 Sl. No. State/UT Women Jail Total Jails No. of Women Jails Capacity Inmate Population Total No. of Jails Total Women Capacity Total Women Inmates 1 ANDHRA PRADESH 2 280 213 106 926 466 2 ARUNACHAL PRADESH 0 0 0 2 24 8 3 ASSAM 0 0 0 31 684 307 4 BIHAR 2 152 171 59 1650 1324 5 CHHATTISGARH 0 0 0 33 649 883 6 GOA 0 0 0 1 50 34 7 GUJARAT 2 410 190 30 1112 563 8 HARYANA 0 0 0 19 911 642 9 HIMACHAL PRADESH 0 0 0 14 136 87 10 JAMMU & KASHMIR @ 0 0 0 15 138 126 11 JHARKHAND 0 0 0 30 868 813 12 KARNATAKA 1 100 51 104 1216 611 13 KERALA 3 232 112 55 404 173 14 MADHYA PRADESH 0 0 0 131 1873 1758 15 MAHARASHTRA 1 262 363 64 1265 1569 16 MANIPUR 0 0 0 5 250 54 17 MEGHALAYA 0 0 0 5 55 29 18 MIZORAM 1 90 42 10 274 189 19 NAGALAND 0 0 0 11 180 4 20 ODISHA 1 55 26 91 1902 587 21 PUNJAB 1 320 188 24 1765 1244 22 RAJASTHAN 7 1048 354 144 1757 589 23 SIKKIM 0 0 0 2 40 12 24 TAMIL NADU 5 2018 551 141 2548 743 25 TELANGANA 1 250 222 37 675 445 26 TRIPURA 0 0 0 13 151 45 27 UTTAR PRADESH 1 420 219 72 3278 4174 28 UTTARAKHAND 0 0 0 11 154 262 29 WEST BENGAL # 1 226 321 59 1885 1479 30 A & N ISLANDS 0 0 0 4 40 7 31 CHANDIGARH 0 0 0 1 120 49 32 D & N HAVELI * 0 0 0 1 10 0 33 DAMAN & DIU * 0 0 0 1 20 5 34 DELHI 2 648 629 16 648 629 35 LAKSHADWEEP 0 0 0 4 0 0 36 PUDUCHERRY 0 0 0 4 45 3 TOTAL 31 6511 3652 1350 27703 19913 @ Jammu and Kashmir and Ladakh are now Union Territories. This is consolidated data of both UTs - Jammu and Kashmir and Ladakh. * D&N Haveli and Daman & Diu have since been merged into one UT. # Due to non-receipt of data from West Bengal for the year 2018 & 2019, data furnished for 2017 has been used.
- 7. R.S.US.Q.NO. 2428 FOR 17.03.2021 ANNEXURE-IV State and UT-wise capacity of prisons and inmate population as on 31st December, 2019 S No. State/UT Available Capacity Inmate Population 1 Andhra Pradesh 8789 7579 2 Arunachal Pradesh 233 247 3 Assam 8888 9226 4 Bihar 42222 39814 5 Chhattisgarh 12063 18112 6 Goa 624 518 7 Gujarat 13762 15089 8 Haryana 19306 20423 9 Himachal Pradesh 2146 2373 10 Jammu & Kashmir @ 2910 3689 11 Jharkhand 16795 18654 12 Karnataka 14315 14515 13 Kerala 6841 7499 14 Madhya Pradesh 28718 44603 15 Maharashtra 24095 36798 16 Manipur 1272 876 17 Meghalaya 650 1023 18 Mizoram 1601 1698 19 Nagaland 1450 446 20 Odisha 19291 17563 21 Punjab 23488 24174 22 Rajasthan 22952 21599 23 Sikkim 260 400 24 Tamil Nadu 23392 14707 25 Telangana 7785 6717 26 Tripura 2174 1103 27 Uttar Pradesh 60340 101297 28 Uttarakhand 3540 5629 29 West Bengal # 21772 23092 30 A & N Islands 309 244 31 Chandigarh 1120 984 32 D&N Haveli * 70 46 33 Daman & Diu * 60 62 34 Delhi 10026 17534 35 Lakshadweep 64 4 36 Puducherry 416 263 Total 403739 478600 @ Jammu and Kashmir and Ladakh are now Union Territories. This is consolidated data of both UTs - Jammu and Kashmir and Ladakh. * D&N Haveli and Daman & Diu have since been merged into one UT. # Due to non-receipt of data from West Bengal for the year 2018 & 2019, data furnished for 2017 has been used.