Metrics While working as Desktop Support Engineer
•
0 likes•88 views

Contains metrics concerning my work performance while working as a desktop support engineer at a previous position. While I was there, my customer satisfaction scores were consistently the highest.

Recommended
More Related Content
Recently uploaded
Recently uploaded (20)
Featured
Featured (20)
Metrics While working as Desktop Support Engineer
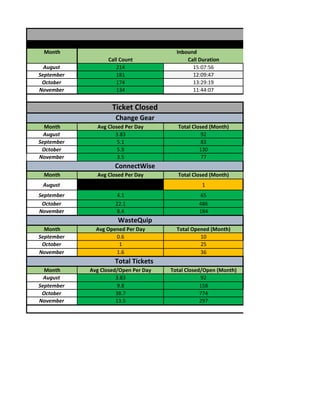
- 1. Month Call Count Call Duration August 214 15:07:56 September 181 12:09:47 October 174 13:29:19 November 134 11:44:07 Month Avg Closed Per Day Total Closed (Month) August 3.83 92 September 5.1 83 October 5.9 130 November 3.5 77 Month Avg Closed Per Day Total Closed (Month) August 1 September 4.1 65 October 22.1 486 November 8.4 184 Month Avg Opened Per Day Total Opened (Month) September 0.6 10 October 1 25 November 1.6 36 Month Avg Closed/Open Per Day Total Closed/Open (Month) August 3.83 92 September 9.8 158 October 38.7 774 November 13.5 297 Inbound Ticket Closed WasteQuip Total Tickets Change Gear ConnectWise
- 2. Avg Call Duration Call Count Call Duration Avg Call Duration 4:15 124 04:16:18 2:04 4:33 69 1:50:16 1:46 5:08 92 4:51:32 1:35 5:15 67 4:17:13 3:50 Month Avg Time to Accept Avg Time to Resolve (mins) August 3.82 17.31 September 22.8 17.8 October 7.13 13.16 November 5.8 13.08 Score # Surveys August 44.3 12 September 42.3 9 October 42.6 15 November 44.6 5 Overall Average 43.1 10.3 Green - You are performing at the standards Red - You are performing below the standard Yellow - Lack of opportunity to fully measure (weight coming soon) Will Higgs' Scorecard 2015 Outbound Ticket Response & Resolution Time Change Gear Survey Results
- 3. Call Count Call Duration Avg Call Duration 338 19:24:14 3:27 250 15:25:56 4:03 266 18:40:54 4:08 201 16:01:20 4:46 TOTAL