1. CREDIT AVAILABILITY AND ITS DETERMINANTS
FINANCIALLY CONSTRAINED FIRMS AND THEIR FINANCING BEHAVIOUR
by
WILKE VAN DER SPEK
401987WS
A thesis submitted to Erasmus University
in partial fulfillment of the requirements for the degree of
MASTER OF SCIENCE IN FINANCE & INVESTMENTS
S. van Kampen, MSc
Prof. Dr. D. Schoenmaker
Rotterdam School of Management
June 2016
2. FINANCIALLY CONSTRAINED FIRMS AND THEIR FINANCING BEHAVIOUR
2
I would like to express my gratitude towards my coach and co-reader for their support and
guidance throughout this study.
The copyright of this master thesis rests with the author. The author is responsible for its contents.
RSM is only responsible for the educational coaching and cannot be held liable for the content.
3. FINANCIALLY CONSTRAINED FIRMS AND THEIR FINANCING BEHAVIOUR
3
ABSTRACT
This study contributes to finance literature by analyzing the direct effect of financial
constraints on firm financing behaviour using various measures of financial constraint,
including the KZ, SA, and WW index. I use the September 2008 crisis episode to gauge the
effect of financial constraints on real firm financing behaviour in times when constraints are
tightened from both the supply side and the demand side. This study analyses whether
constrained firms substitute debt with other sources of financing such as equity and trade credit.
Results indicate that during normal times constrained firms issue more equity and trade credit
than unconstrained firms, and that constrained firms substitute debt with equity and trade credit
during crises.
4. FINANCIALLY CONSTRAINED FIRMS AND THEIR FINANCING BEHAVIOUR
4
TABLE OF CONTENTS
Abstract ........................................................................................................................................... 3
Table of Contents............................................................................................................................ 4
Overview Figures and Tables......................................................................................................... 5
I. Introduction ............................................................................................................................... 6
II. Literature Review .................................................................................................................. 11
A. Discussion of Relevant Literature................................................................................. 11
i. Measures of Financial Constraint.................................................................................. 11
ii. Capital Structure Theories and Financial Constraints.................................................. 14
B. Propositions and Hypotheses......................................................................................... 15
III. Methodology......................................................................................................................... 18
A. Measurement of Variables............................................................................................. 18
i. Financial Constraint ....................................................................................................... 18
ii. Global Financial Crisis 2008......................................................................................... 20
iii.Debt Issuance.................................................................................................................. 20
iv. Equity Issuance............................................................................................................... 21
v. Trade Credit Issuance..................................................................................................... 21
vi. Series of Control Variables............................................................................................ 21
B. Methodology................................................................................................................... 22
IV. Data Set................................................................................................................................. 25
A. Data and Data Sources................................................................................................... 25
B. Descriptive Statistics...................................................................................................... 25
V. Results and Discussion.......................................................................................................... 30
A. Overview of Results....................................................................................................... 30
i. Debt as a Financing Choice........................................................................................... 30
ii. Equity as a Financing Choice........................................................................................ 34
iii.Trade Credit as a Financing Choice.............................................................................. 37
B. Discussion of Results..................................................................................................... 40
i. Firm Financing Behaviour............................................................................................. 40
ii. Measuring Financial Constraint .................................................................................... 41
iii.Limitations and Future Research................................................................................... 42
VI. Conclusion............................................................................................................................ 44
List of References ......................................................................................................................... 46
Appendix........................................................................................................................................ 51
5. FINANCIALLY CONSTRAINED FIRMS AND THEIR FINANCING BEHAVIOUR
5
OVERVIEW FIGURES AND TABLES
Table 1 Overview Summary Statistics...................................................................................... 28
Table 2 Regression of Debt Issuance ....................................................................................... 31
Table 3 Regression of Short- and Long-Term Debt Issuance .................................................. 33
Table 4 Regression of Net Stock Issuance................................................................................ 36
Table 5 Regression of Trade Credit Issuance ......................................................................... 39
Figure 1 Conceptual Framework of this Analysis.................................................................... 17
6. FINANCIALLY CONSTRAINED FIRMS AND THEIR FINANCING BEHAVIOUR
6
I. INTRODUCTION
The financial crisis of 2008 altered the global financial infrastructure in many ways and
changed the financial status and funding behaviour of many corporates. In order to survive,
banks had to restrict their lending activities and show more risk-averse behaviour. The equity
market had lost all its trust in the global economy, and stock prices plummeted. Private equity
firms reduced their investments as well. As a result, external financing became a serious
problem for the worldwide economy and financial constraints intensified substantially during
this period. Although the effects of the financial crisis were disastrous and unfortunate, it gives
us the opportunity to study the effect of (an increase in) financial constraints on corporate
funding behaviour. Even in the aftermath of the crisis, the effects on attracting funding are still
there. Government regulation regarding bank credit has tightened, causing corporates to attract
alternative sources of funding. One of these alternative funding sources is trade credit, of which
its use is common among many corporates and can be seen as a well-accepted substitute of bank
debt. Although much literature can be found on the corporate structure choice of
(un)constrained firms, many papers and theories date from before the financial crisis of 2008.
As the economic and financial landscape has changed dramatically over the last decade, it
would be interesting to see how the financial crisis and tightened regulation has influenced the
financing behaviour of financially constrained firms and how these firms finance their
operations nowadays.
This leads me to the following research question:
“HOW DO FINANCIALLY CONSTRAINED FIRMS FINANCE THEIR OPERATIONS?”
During this research I would like to focus on the following sub-questions: (a) How does the
financing behaviour of financially constrained firms differ from unconstrained firms? And (b),
What effect did the 2008 financial crisis have on the financing behaviour of financially
constrained firms? And concluding, (c), What substitution behaviour in funding can be
observed for financially constrained firms? These sub-questions provide a more detailed
understanding of the financing choices of financially constrained firms and whether they prefer
equity and/or trade credit to finance operations as opposed to debt.
A considerable amount of evidence indicates that financial constraints can have a significant
impact on a firm’s financial position, with constraints acting as an obstacle to investment and
growth (e.g., see Hubbard (1998), Almeida and Campello (2007), Love (2003), and Stein
(2003)). The influential propositions of Modigliani and Miller (1958) state that without any
7. FINANCIALLY CONSTRAINED FIRMS AND THEIR FINANCING BEHAVIOUR
7
imperfections in capital and credit markets, a firm’s financing decisions are irrelevant and have
no influence on investment and firm value. But the existence of such imperfections means that
financial constraints have a bearing on firm value and investment. This effect was even more
visible during the financial crisis of 2008. Several studies have shown the large impact of the
financial crisis on financial constraints. During the crisis, constrained firms initiated a decline
in investment spending and an increase in asset sales to fund operations, and cash resources
were exhausted more quickly (Campello, Graham, and Harvey, 2010). Furthermore, financially
constrained firms had trouble renewing their credit lines during the crisis as a result of tightened
lending terms (Campello, Giambona, Graham, and Harvey, 2012). Existing credit lines were
drawn down, and new loans to large borrowers decreased by almost one half during the last
quarter of 2008 relative to the second quarter of 2007 (Ivashina and Scharfstein, 2010). These
developments suggest that the financial crisis of 2008 decreased the supply of credit and
increased financial constraints for firms. As such, it would be interesting to see what effect this
would have on the corporate financial structure of constrained firms. Constrained firms can be
defined as those firms that experience difficulty in attracting external funding, mainly debt. The
pecking order theory, as conjectured by Donaldson (1961), Myers (1984), and Myers and
Majluf (1984), suggests a hierarchy in financing, in which internal funds are preferred over
external funds, and debt over equity. This is because adverse selection costs make equity
costlier than any other source of financing. Therefore, the theory also suggests that firms with
restricted access to debt should use internal resources such as cash, and external resources such
as equity to raise the necessary funds (preferably in that order). This finding is supported by
Faulkender and Petersen (2006), Sufi (2009), Fama and French (2002), Frank and Goyal (2003),
and Bolton, Chen, and Wang (2013). But the use of alternative funding sources should not be
ignored. The popularity of trade credit has been documented for several years in studies by
Petersen and Rajan (1997) and Biais and Gollier (1997). Trade credit can be seen as a widely
accepted substitute for bank debt, although be it an expensive one. Especially for firms that face
restrictions to bank debt, the use of trade credit is common. In this study, the first two research
questions examine the financing choices of constrained firms versus unconstrained firms and
the influence of the 2008 financial crisis on those choices. Since debt access is limited, I expect
constrained firms to issue relatively more equity and trade credit than unconstrained firms.
Also, the recent crisis enlarged the constraint status of many firms on both debt and equity.
Therefore, I study the interaction effect of severe financial constraints and the 2008 financial
crisis on the choice for both equity and trade credit. Thus, did the financial crisis intensify the
use of equity and trade credit for financially constrained firms? To finalize this study, I include
8. FINANCIALLY CONSTRAINED FIRMS AND THEIR FINANCING BEHAVIOUR
8
an interaction effect in the analysis to examine the joint effect of severe financial constraints
and a change in debt issuance on equity and trade credit issuance levels.
This work is related to existing literature on financial constraints and firm behaviour and
complements the work of Kahle and Stulz (2010), who study the effect of credit contraction
during the crisis on corporate financial policies for industrial firms and Lemmon and Zender
(2010), who measure the impact of debt capacity on testing different capital structure theories.
KS find that debt financing decreases severely for all types of firms after September 2008,
where large firms compensate the decrease in debt financing with a reduction in share
repurchases, leading to an increase in cash holdings. Furthermore, financially constrained firms
lower their equity sales during the crisis, but maintain their capital expenditure levels, which
according to the authors, thus must be financed with cash to offset the decrease in equity sales.
This research also builds on the existing work of LZ, who show that financially unconstrained
firms seeking external funding primarily use debt as a financing source, whereas firms with
limited debt capacity seek external equity financing more often. This study complements the
work of LZ and KS by including trade credit as a possible funding source and by examining the
effects of the 2008 financial crisis on all funding sources (i.e., debt, equity, and trade credit).
The sample for this study includes all non-financial and non-regulated North-American
companies listed in the Compustat Fundamentals database over the period 2002 to 2014. This
period reflects the financing choices of constrained firms pre, during and post financial crisis.
The Compustat Fundamentals database provides general accounting data of these firms, along
with data on yearly financing choices made by firms. I obtain all relevant variables in this study
from the Compustat Fundamentals database and the Compustat Ratings database. In order to
attain a valid outcome in this study, all variables that are part of the regression analysis should
be present for each firm in the data set.
In order to assess the financing choices of financially constrained firms I perform a series of
panel regressions. The main dependent variable of interest in this study involves the financing
choices of firms, which can be separated into the variables debt issuance, equity issuance, and
trade credit issuance. I run each regression separately with a different dependent variable. Main
explanatory variables in the empirical analysis include financial constraint, the financial crisis
of 2008, and possible shocks to debt issuance. To quantity financial constraint, I use four
different measures that finance literature has identified as proxies of financial constraint, of
which three are indices (i.e., Kaplan-Zingales (KZ) index, Size-Age (SA) index, and Whited-
9. FINANCIALLY CONSTRAINED FIRMS AND THEIR FINANCING BEHAVIOUR
9
Wu (WW) index)1
and one univariate measure (i.e., Standard & Poor’s credit rating). I foremost
use the KZ index as a measure of constraint, since this particular index is the most recognized
one in the field of finance, and many researchers have used the KZ index as a measure of
constraint in their studies. Furthermore, the KZ index takes multiple constraint indicators into
account, such as dividend payment behaviour, cash resources, and market equity values, all of
which are known for their effect on financial constraint in finance literature. I perform
robustness checks via the three other measures of constraint. The reason for using multiple
indictors to measure financial constraint is that none of the indices are without controversy and
finance literature is divided on which indicator most accurately measures financial constraint.
Other studies also recognize this issue and consequently use multiple indicators of constraint.
After computing the relevant financial constraint scores from all three indices, I rank firms
accordingly, and divide the data set into septiles. I classify those firms in the top (bottom) septile
of the distribution as “financially constrained” (“financially unconstrained”), and firms in the
second (sixth) septile as “highly likely financially constrained” (“highly likely financially
unconstrained”), as all the indices show higher values for financially constrained firms. For
credit rating, I classify firms with an investment-grade credit rating as “financially
unconstrained” and firms with a non-investment grade credit rating as “financially constrained”.
Explanatory variable of interest in this study is a dummy variable indicative of a firm’s level of
financial constraint. I am also interested in the effect of the 2008 financial crisis and as such I
include a dummy variable to the baseline regression specifying whether an observation takes
place during financial crisis years or otherwise. To enhance the credibility of the analysis and
to control for additional effects, a group of control variables (i.e., profitability, firm size,
investment, Tobin’s q, cash, and asset maturity) that are typically seen as important capital
structure determinants are also included in the analysis.
To summarize, the analysis in this study has three parts to it. As an introductory step to this
analysis, I analyze the difference in financing behaviour between financially constrained and
unconstrained firms. Second, I study the effect of the 2008 financial crisis on the funding
behaviour of constrained firms, for which I introduce an interaction term in the baseline
regression. The main coefficient of interest then is the interaction term that measures the actual
impact of the crisis on the funding behaviour of constrained firms. To conclude, I empirically
1
The KZ index is established by Kaplan and Zingales (1997) and Lamont, Polk, and Saa-Requejo (2001). The
WW and SA indices are developed by Whited and Wu (2006) and Hadlock and Pierce (2010) respectively.
10. FINANCIALLY CONSTRAINED FIRMS AND THEIR FINANCING BEHAVIOUR
10
analyze whether a constrained firm shows certain substitution behaviour towards equity and/or
trade credit following a change in debt issuance levels.
Overall, this paper makes an important contribution to corporate finance literature by
identifying the direct impact of financial constraint on the financing choices of firms. This study
develops an understanding of the financing behaviour of financially constrained firms, and the
effect of the 2008 financial crisis on their financing choices. This work examines the financing
outcomes that firms tend to refer to when they experience certain financing constraints, explore
the patterns that can be identified from the data, and draw conclusions from these patterns that
are useful to both theory, policy and further research in this field. The use of trade credit and/or
equity as a substitute for debt or the effects of the recent financial crisis might provide new
insights on the effect of financing constraints that are not accounted for in previously performed
research and as such are useful from an academic perspective as well as from a more managerial
one.
The remainder of this report is structured as follows: Chapter II reviews the literature that pays
attention to the measurement of financial constraint and its effect on corporate financial
policies. Chapter III provides an overview of the data and sample used in this study. Chapter
IV describes the empirical approach and analysis involved in this study, of which the results
and a discussion are provided in Chapter V. Chapter VI summarizes the main conclusions that
can be derived from the data.
11. FINANCIALLY CONSTRAINED FIRMS AND THEIR FINANCING BEHAVIOUR
11
II. LITERATURE REVIEW
This chapter provides an overview of the relevant literature for this study and it shows the
conceptual framework representing the foundation of this study. Also, a discussion of the main
hypotheses that can be derived from the literature is included.
A. Discussion of Relevant Literature
This section provides a detailed overview of all literature relevant to this study. In the first
part of this section I provide an overview of the various measures of financial constraint that
are used in related empirical studies. The second part provides a more detailed description of
existing work on capital structure theories that relate to financial constraint and firm behaviour,
and the choice of constrained firms for equity and trade credit.
i. Measures of Financial Constraint
This analysis requires a reliable instrument to measure a firm’s access to credit and capital
markets in order to identify firms as financially constrained or unconstrained. Financially
constrained firms can be defined as those firms that experience limited access to external
financing, and researchers have used a variety of methods to identify firms as such. The correct
identification of financial constraints has been an imperative issue in the corporate finance
literature, since a firm’s financial constraints cannot directly be observed. For that reason,
researchers have introduced several proxies that account for a firm’s constraint level, which can
be divided into univariate and index-based measures. Univariate measures are measures of
constraint that are based on theoretical assumptions on the relationship between constraints and
a corresponding indicator. Main advantage of these indicators is that they are widely available
for firms, and that they can easily be implemented. For instance, the (non)presence of an
external credit rating delivered by rating agencies can be used as a measure of financial
constraint. A credit rating, which is an objective valuation of firm soundness and regularly
required to access debt provided by banks or capital markets, thus increases the access to
external financing (Whited (1992), Denis and Sibilkov (2010)). Furthermore, a credit rating can
reduce asymmetric information because firms are closely monitored by the rating agencies and
firm-specific information is made publicly available because of these rating agencies. Almeida,
Campello, and Weisbach (2004) and Campello and Chen (2010) show that a firm’s credit rating
status (investment-grade versus speculative (or non-investment-grade)), firm size, firm age, and
dividend payment behaviour can be used as indicators of financial constraint. Firms with high
dividend pay-out ratios are expected to rely less on external financing because the high pay-out
12. FINANCIALLY CONSTRAINED FIRMS AND THEIR FINANCING BEHAVIOUR
12
ratio indicates that a firm has sufficient internal funds readily available and/or less investment
opportunities to choose from. Either way, access to external financing is assumed to be less
essential to these firms (Gilchrist and Himmelberg (1995), Fazzari et al. (1988), Cleary, 2006)).
The correlation of a firm’s rating status and its access to external finance is recognized in
finance literature, where investment-grade firms usually have better access to external finance
(Boot et al. (2006), Hann et al. (2013)) and lowering credit ratings increase the cost of external
debt because of rising default rates (Datta, Iskandar, and Patel (1999)). Besides these issues,
some investors are subject to certain regulatory limitations where they are simply not allowed
to invest in firms with a credit rating below a specific minimum threshold. The problem
however with this specific measure of constraint is that not all firms have a public debt rating,
and by limiting the sample set to firms with access to public debt, one could unintentionally
exclude more constrained firms (i.e., the ones without access to public debt or equity) from the
analysis. Another measure to indicate financial constraints is firm age. Mature firms are
considered to be less constrained as they are better known, have a reputation, and display a
reliable track record over a longer period of time. (Devreux and Schiantarelli (1990), Chirinko
and Schaller (1995), Honjo and Harada (2006), Rauh (2006), Fee, Hadlock, and Pierce (2009)).
As with maturity, research has also indicated firm size to be a valid proxy of firms’ constraints
status. Larger firms in terms of total assets are considered less constrained (Devreux and
Schiantarelli (1990), Gertler and Gilchrist (1994), Becchetti and Trovato (2002), Carpenter and
Petersen (2002), Oliveira and Fortunato (2006), Whited (2006)). Firms with a large asset based
structure are expected to have better access to external debt as their assets can serve as collateral
in case of default (Frank and Goyal (2007)). Also, they are well known and likely to be listed
on a stock exchange, which lowers information asymmetry costs and thus improves these firms’
access to external finance (Jaffee and Russell (1976), Stiglitz and Weiss (1981), Myers and
Majluf (1984)).
Researchers also refer to special indices built on linear combinations of observable firm
characteristics. Whereas univariate measures refer to a specific indicator, index-based measures
include several of them in one index and then rank firms based on the outcome of the calculation
corresponding to the relevant index. The most popular indices used in financial literature have
been developed by Kaplan and Zingales (the KZ index, 1997), by Whited and Wu (the WW
index, 2006), and Hadlock and Pierce (the Size Age (SA) index, 2010). The KZ index is
developed as a response to the empirical study by Fazzari, Hubbard, and Petersen (1988) on
cash flow sensitivities as a measure of constraints, where Kaplan and Zingales study the
13. FINANCIALLY CONSTRAINED FIRMS AND THEIR FINANCING BEHAVIOUR
13
influence of financial constraints on firm financial policy. Kaplan and Zingales split the sample
into groups, ranging from “not financially constrained” to “definitely financially constrained”
based on financial statements and newspaper articles. Only a few firms that have been classified
by Fazzari et al. as constrained are considered to be financially constrained by Kaplan and
Zingales, and the authors conclude that investment-cash flow sensitivities are an invalid
measure of financial constraints. Using the qualitative work of Kaplan and Zingales, Lamont,
Polk, and Saá-Requejo (2001) implement a nonlinear ordered logit model to analyze the
correlation between a group of financial variables and a firm’s financial constraint level. This
approach is followed by a number of later studies to separate financially constrained firms from
unconstrained firms (e.g., see Baker et al. (2003), Hennesy and Whited (2007), Campello and
Chen (2010), and Li (2011)). The KZ index as used by Lamont et al. (2001) includes variables
such as the amount of debt outstanding, Tobin’s q, the amount of dividends issued, cash
holdings, and cash flows. Although the KZ index is a commonly accepted measure of financial
constraint, it has certain limitations that cannot be ignored. Because the index is based on the
qualitative work of Kaplan and Zingales, the number of firms in their sample is rather limited
and thus results could be biased towards this specific subsample of firms. Additionally, the
classification scheme that the index is built upon is subjective and any misinterpretation of
statements in the reports or news articles could influence the results of the study. Another
problem lies in the fact that managers may not truthfully disclose all information regarding a
firm’s financial constraints which also biases the outcome of the study. Because of this, Hadlock
and Pierce (2001) introduce an alternative measure of financial constraint, namely the Size Age
(SA) index. Their approach follows the method of Lamont et al., however Hadlock and Pierce
introduce a number of different exogenous variables. The authors conclude that firm size and
age are the most reliable indicators of financial constraints. Li (2011) uses the same approach
in a study on financial constraints, R&D investment, and stock returns. Another commonly used
index to identify financially constraints is the WW-index, which is built on a condensed form
Euler equation. This approach does not deliver a classification scheme like the other indices, so
the authors empirically estimate the Euler equation and relate the results to a group of
explanatory variables that are supposed to capture information on financial constraints. This
approach is applied in studies by Hennesy and Whited (2007), Li (2011) and Hann et al. (2013).
The WW index includes long-term debt to total assets, the firm’s three-digit industry average
sales growth, cash flow to total assets, sales growth, log of total assets, and a dividend policy
indicator.
14. FINANCIALLY CONSTRAINED FIRMS AND THEIR FINANCING BEHAVIOUR
14
ii. Capital Structure Theories and Financial Constraints
(1) Equity versus Debt. From the literature listed in the introduction it can be inferred that
financial constraints significantly impact a firm’s particular choice of funding. Overall, it is
assumed that financially constrained firms show higher asymmetric information levels and as
such experience limited access to external finance. According to the pecking order theory, this
means that financially constrained firms issue relatively more equity than unconstrained firms.
This is confirmed in a study by Lemmon and Zender (2010), who state in a study on debt
capacity that financially unconstrained firms seeking external funding primarily use debt as a
financing source, whereas firms with limited debt capacity seek external equity financing more
often. Bolton, Chen and Wang (2013) find that financially constrained firms decide to limit
their debt levels in order to maintain their cash holdings. Debt payments decrease a firm’s
valuable cash holdings and thus entail higher expected external financing costs. If outside
financiers have limited or incomplete information about a firm, they may be reluctant to finance
a firm’s investments. This suggests that financially constrained firms face limited access to
external financing because of high asymmetric information levels. The pecking order theory
suggests that because of asymmetric information, firms should follow a hierarchy in capital
structure choice by preferring internal financing over debt, and debt over equity. This hierarchy
should especially apply to firms that face higher adverse selection costs, as for those firms the
costs of external financing are higher. Firms facing larger financial constraints are often
perceived to fall in the category of small, high-growth (i.e., risky) firms. Due to high
asymmetric information levels, these firms have inferior access to external financing, which
causes them to rely on “funding of last resort”, being equity. Fama and French (2002) and Frank
and Goyal (2003) find that small, high-growth type of firms are the primary issuers of equity.
The findings in these studies suggest that financially constrained firms rely more heavily on
cash reserves and equity than unconstrained firms.
(2) Trade Credit versus Debt. The choice of firms for trade credit over bank debt has been
documented by Petersen and Rajan (1997) and Biais and Gollier (1997). Petersen and Rajan
(1997) find evidence that firms use trade credit relatively more when credit from financial
institutions is not available and conclude that trade credit can be seen as a commonly accepted
substitute of bank debt. This suggests that constrained firms would rely more on trade credit
when traditional forms of funding are no longer applicable. One existing study confirms that
for credit constrained firms, the use of trade credit as opposed to bank debt intensified during
the 2008 financial crisis (García-Appendini & Montoriol-Garriga (2006)), whereas
15. FINANCIALLY CONSTRAINED FIRMS AND THEIR FINANCING BEHAVIOUR
15
unconstrained firms relied on bank debt (Carbó, Rodríquez, and Udell (2012). The use of trade
credit as an important funding source has been established a long time ago (e.g., see Petersen
and Rajan (1995), Cole (1968), Lee and Stowe (1993), Seiden (1964), Long, Malitz and Ravid
(1993)), and its popularity is explained by a considerable body of research. Some researchers
have found that suppliers may act as “relationship lenders” for the reason that they possess a
unique information advantage towards their customers (McMillan and Woodruff (1999),
Uchida, Udell, and Watanabe (2011)). Another possibility is that suppliers acquire information
about the real performance of their customer’s business that is unknown to banks (Smith (1987),
Biais and Gollier (1997)). Cuñat (2007) shows that suppliers of trade credit can easier enforce
unsecured debt contracts, which allows them to supply more credit than banks when financial
market constraints tighten. Another motivation for trade credit is explained by Demirgüç-Kunt
and Maksimovic (2001), who suggest that trade credit suppliers find information about their
customers valuable and that suppliers use this information to extend credit on terms that cannot
be offered by banks. From the aforementioned literature it can be concluded that trade credit
has become an important alternative funding source to firms.
B. Propositions and Hypotheses
This section describes the main propositions and hypotheses that can be derived from the
previously discussed literature. The conceptual framework as provided in Figure 1 presents an
overview of all variables and assumed relationships that serve as a basis for this study. These
propositions are composed with the pecking order theory as underlying foundation.
Sub-question (a): How does the financing behaviour of financially constrained firms differ
from unconstrained firms?
The majority of literature as presented earlier in this research indicates that financially
constrained firms face restricted access to debt and as such rely more on equity than
unconstrained firms. Also, a vast body of research has shown the preference of (un)constrained
firms for trade credit as a financing source. Consequently, this produces the following
hypotheses used in this analysis:
H1: Financially constrained firms have lower debt issuance levels than unconstrained firms.
H2: Financially constrained firms have higher equity issuance levels than unconstrained firms.
H3: Financially constrained firms have higher trade credit issuance levels than unconstrained
firms.
16. FINANCIALLY CONSTRAINED FIRMS AND THEIR FINANCING BEHAVIOUR
16
Sub-question (b): What effect did the 2008 financial crisis have on the financing behaviour of
financially constrained firms?
Research has shown that the 2008 global financial crisis increased financial constraints and
reduced the supply of capital and credit. Therefore, I expect the financial crisis to negatively
impact the availability of bank debt, causing financially constrained firms to rely more on equity
and trade credit. On the other hand, research exists that equity markets also tightened during
the crisis. But for now, I employ the hypotheses as listed below:
H4: The 2008 financial crisis caused financially constrained firms to further decrease debt
issuance levels.
H5: The 2008 financial crisis caused financially constrained firms to further increase equity
issuance levels.
H6: The 2008 financial crisis caused financially constrained firms to further increase trade
credit issuance levels.
Sub-question (c): What substitution behaviour in funding can be observed for financially
constrained firms?
Financially constrained firms are likely to experience a negative shock in debt issuance, as
these firms have less access to debt as a financing source. It is therefore reasonable to expect
that these firms are exploring alternative funding sources, such as equity and trade credit. This
research question explores the interaction effect between severe financial constraints and a
change in debt issuance levels on equity and trade credit issuance levels. This effect can be
summarized as follows:
H6: The impact of a decrease in debt issuance levels on equity issuance levels is stronger for
financially constrained firms.
H7: The impact of a decrease in debt issuance levels on trade credit issuance levels is stronger
for financially constrained firms.
The next chapter describes the measurement of variables and methodology used in this study.
17. FINANCIALLY CONSTRAINED FIRMS AND THEIR FINANCING BEHAVIOUR
17
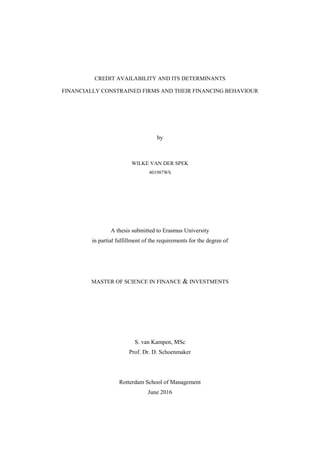
Figure 1
Conceptual Framework
2008 FINANCIAL CRISIS
(D_CRISIS)
FINANCIAL CONSTRAINT
(D_FC), (D_HLFC), …, (D_NFC)
DEBT
ISSUANCE
SELECTED SOURCE OF FINANCING:
TRADE CREDIT
ISSUANCE
EQUITY
ISSUANCE
DEBT
ISSUANCE
Figure 1 illustrates an overview of the relevant variables in this study and the context of this research.
Explanatory variables in this study are the 2008 financial crisis, the degree of financial constraint that a firm is
facing, and a firm’s variation in debt issuance levels. Financial constraint levels are measured by means of the
KZ-, SA-, and WW index, and S&P credit rating. Financially constrained firms are those firms that are
categorized in the top septile of the distribution after ranking them according to constraint score. Dependent
variable in this study is the financing choice of firms, consisting of debt, stock, and trade credit. Control variables
(not mentioned in this framework) include firm size, profitability, investment, Tobin’s q, cash, and asset
maturity. Main variables of interest are the interaction terms between the 2008 financial crisis and financial
constraint and debt issuance and financial constraint. The sample in this study consists of non-financial, non-
regulated firms listed in the (North-America) Compustat Annual Fundamentals and Ratings database over the
period 2002-2014. Firms are required to have non-missing information on each relevant variable in this study
for them to be included in the sample.
18. FINANCIALLY CONSTRAINED FIRMS AND THEIR FINANCING BEHAVIOUR
18
(1)
III. METHODOLOGY
This chapter gives an overview of the relevant variables and how they are defined and
describes the methodology used throughout the empirical analyses. Also, limitations in the
analyses are described.
A. Measurement of Variables
i. Financial Constraint
In this study I use several financial constraint measures as proposed by finance literature. An
overview of their measurement is provided below.
(1) Kaplan-Zingales Index. The KZ index, based on the work of Kaplan and Zingales (1997),
is a linear combination of five accounting measures indicating a firm’s probability of financial
constraint. The KZ index is a well-known measure of financial constraint and is used in a
number of subsequent studies in finance literature. The index is a linear combination of firm-
specific variables that loads positively on debt to total capital and Tobin’s q, and negatively on
dividends to capital, cash holdings to capital and cash flow to capital. As reported by Lamont
et al. (2001), the KZ index can be computed as follows:
KZ = −1.001909 (Cash Flow/K) + 0.2826389 (Tobin′s q) +
3.139193 (Debt/TotalCapital) − 39.3678 (Dividends/K) − 1.314759 (Cash/K),
where CashFlow/K is computed as [income before extraordinary items (IB) + depreciation and
amortization (DP)] divided by property, plant, and equipment total (PPENT), Tobin’s q as [total
assets (AT) + CRSP December market equity – common/ordinary equity total (CEQ) – deferred
taxes (TXDB)] divided by total assets, Debt/TotalCapital as [long-term debt total (DLTT) +
debt in current liabilities (DLC)] divided by [long-term debt total + debt in current liabilities +
stockholder’s equity total (SEQ)], Dividends/K as [dividends common (DVC) + dividends
preferred (DVP)] divided by property, plant, and equipment total, and Cash/K as cash and short-
term investments (CHE) divided by property, plant, and equipment total. Data item property,
plant, and equipment total is lagged. It is required that a firm has valid information on all of the
above annual items to be able to have an effective KZ index. Higher levels of the KZ index
indicate lesser cash flows, higher leverage, lower dividend distribution, and thus a greater
likelihood that a firm is financially constrained. I rank the sample firms according to their KZ
value at the end of the year prior to the issuing year and classify those firms in the top (bottom)
septile of the distribution as financially constrained (unconstrained), as the KZ index shows
higher values for financially constrained firms.
19. FINANCIALLY CONSTRAINED FIRMS AND THEIR FINANCING BEHAVIOUR
19
(2)
(3)
(2) Whited-Wu Index. The WW index consists of a combination of six variables, including
cash flow, dividend, leverage, firm size, industry sales growth, and firm sales growth. The WW
index loads positively on long-term debt to total assets and the firm’s three-digit industry sales
growth, whereas it loads negatively on cash flow to total assets, sales growth, log of total assets,
and a dividend policy indicator. Following the approach of Whited and Wu (2006), the index
is calculated through the following formula:
WW = − 0.091 (CF) − 0.062 (DIVPOS) + 0.021 (TLTD) − 0.044 (LNTA) +
0.102 (ISG) − 0.035 (SG),
where CF is the ratio of cash flow to total assets calculated by [income before extraordinary
items (IB) + depreciation and amortization (DP)] divided by total assets (AT), DIVPOS a
dummy variable equal to 1 if the firm has a positive value for cash dividends paid (DVPD)2
,
TLTD is the percentage of long-term debt to total assets and can be calculated by dividing long-
term debt total (DLTT) by total assets, LNTA is the natural logarithm of total assets, ISG is
average sales growth in the firm’s 3-digit SIC industry and SG is firm sales growth, measured
by receivables total (RECT). As with the KZ index, higher levels of the WW index indicate
higher levels of financial constraint. I rank the sample firms according to their WW value at the
end of the year prior to the issuing year and classify those firms in the top (bottom) septile of
the distribution as financially constrained (unconstrained).
(3) Size-Age Index. In a response to Kaplan and Zingales, Hadlock and Pierce (2010)
developed the SA index as an alternative index to measure financial constraint. The SA index
is a combination of firm size and firm age and one of the most recent proposed measures of
financial constraint. The index is computed as follows:
SA = − 0.737 (Size) + 0.043 (Size2
) − 0.040 (Age),
where Size is the natural logarithm of Total Assets (AT) winsorized at the natural logarithm of
$4.5 billion, and Age is the number of years a firm is listed with a non-missing stock price on
Compustat winsorized at 37 years3
, calculated as the number of years between a firm’s initial
public offering (IPO) date and the issue date. As with both previous indices, a higher SA index
score indicates larger financial constraint levels. I rank the sample firms according to their SA
2
Adding cash dividends paid to the analysis returns only 17 observations after excluding missing variables;
therefore, I forego this particular variable and include common and preferred dividends paid to the analysis instead.
3
The winsorizing is done at the recommendation of Hadlock and Pierce (2010), who suggest to winsorize both
variables at these specific values.
20. FINANCIALLY CONSTRAINED FIRMS AND THEIR FINANCING BEHAVIOUR
20
value at the end of the year prior to the issuing year and classify those firms in the top (bottom)
septile of the distribution as financially constrained (unconstrained).
(4) Standard & Poor’s Credit Rating (Investment Grade vs. Non-investment Grade). A credit
rating delivered by a rating agency like Standard & Poor’s indicates an external grading of a
firm’s creditworthiness and as such its access to external debt. More specifically, investment
grade firms are considered to be less constrained than non-investment grade firms. A public
debt rating is an objective assessment of firm soundness and an investment grade status is often
required to access debt provided by banks or capital markets. Also, the mere presence of a credit
rating can reduce asymmetric information because firms are closely monitored by the rating
agencies and firm-specific information is made publicly available because of these rating
agencies. Firms that have an S&P domestic long-term issuer credit rating (SPLTICRM) of BB+
or lower are classified as non-investment grade, whereas firms with a credit rating of BBB- or
higher are classified as investment grade.
The method used to indicate a firm’s corresponding level of constraint entails a set of dummy
variables ranging from financially constrained to highly likely financially constrained, likely
financially constrained, neutral, likely financially unconstrained, highly likely financially
unconstrained, and financially unconstrained. To be more specific, D_FC1,D_HLFC2, D_LFC3,
D_NE4, D_NLFC5, D_HNLFC6, and D_NFC7, respectively, where the subscript refers to the
matching septile. The reference group, in this case variable D_NFC7, reflects the subsample of
firms with the least or zero level of constraint and is consequently not included in the regression
analysis.
ii. Global Financial Crisis 2008
Another explanatory variable in this analysis is the effect of the 2008 financial crisis on a
firm’s financing choice, which is captured by a dummy variable D_CRISIS with value 1 if an
observation takes place in the period 2007 to 2009 and 0 otherwise.
iii. Debt Issuance
In this analysis, this variable is used both as an explanatory and dependent variable. As a
dependent variable, it illustrates whether financially constrained firms issue relatively less debt
than unconstrained firms. As an explanatory variable, it measures a firm’s substitution
behaviour from debt towards either equity and/or trade credit. The net issuance of total debt is
calculated as (total debt at time t – total debt at time t-1) / total assets at time t. Total Debt is
calculated by adding debt in current liabilities total (DLC) to long-term debt total (DLTT). A
positive (negative) result for this variable indicates an increase (decrease) in total debt.
21. FINANCIALLY CONSTRAINED FIRMS AND THEIR FINANCING BEHAVIOUR
21
iv. Equity Issuance
The net issuance of equity is measured as (sale of common and preferred stock (SSTK) at time
t – purchase of common and preferred stock (PRSTKC) at time t) / total assets at time t. A
positive (negative) result for this variable indicates an increase (decrease) in equity levels.
v. Trade Credit Issuance
The net issuance of trade credit is defined as (accounts payable trade (AP) at time t – accounts
payable trade at time t-1) / total assets at time t. A positive (negative) result for this variable
indicates an increase (decrease) in trade credit levels.
vi. Series of Control Variables
To enhance the validity of this study I include a number of control variables (Xi,t) in the
empirical analysis that are known for their impact on capital structure decisions. As such, I
control for the following items:
(1) Firm Size. The size of a firm is known to influence firm financing behaviour severely and
therefore I control for firm size by taking the natural logarithm of Total Assets (AT).
(2) Profitability. By including firm profitability to the analysis I control for distressed firm-
year observations, as distress can bias the outcome of the study. Although distress is a form of
constraint, I am mostly interested in the effect of constraint itself, and as such I want to isolate
constraint from distress. I measure profitability through return on assets, i.e., dividing operating
income before depreciation (OIBDP) by total assets.
(3) Investment. Firms with very few investment opportunities available require less funding
than firms with numerous investment opportunities in their portfolio. I observe for the effect
that investment has on financing behaviour and therefore I add capital expenditures (CAPX)
divided by net sales (SALE) as a control variable to the empirical analysis.
(4) Tobin’s q. I control for the effect of firm market-to-book equity ratios on financing choice
as financial research indicates that market-to-book ratios (or indirectly, growth opportunities)
influence a firm’s financing decision. For this I use Tobin’s q, which is defined as (total assets
+ CRSP December market equity - common/ordinary equity total (CEQ) - deferred taxes
(TXDB)) / total assets.
(5) Cash. A surplus of cash resources may lower a firm’s need for external financing and
consequently affect a firm’s decision to issue external financing. Together with investment,
these variables measure a firm’s level of external finance dependence. I measure firm internal
cash resources by dividing cash (CH) by total assets.
22. FINANCIALLY CONSTRAINED FIRMS AND THEIR FINANCING BEHAVIOUR
22
(6) Asset Maturity. A short asset maturity might partially explain a firm’s use of trade credit
as a financing source; an effect that I control for in the analysis. I define asset maturity as
working capital (WCAP), which represents the difference between total current assets minus
total current liabilities divided by total assets.
B. Methodology
This section of the report provides an overview of the methodology and empirical analyses
used for each research question.
Sub-question (a): How does the financing behaviour of financially constrained firms differ
from unconstrained firms?
As an introductory step to the main analysis in this study I look at the differences in financing
choices of financially constrained versus financially unconstrained firms. I foremost use the KZ
index as a measure of constraint, while implementing the other measures as robustness checks.
As an estimation framework I divide the sample between firms that are “financially
constrained”, “highly likely financially constrained”, “likely financially constrained”,
“neutral”, “likely financially unconstrained”, “highly likely financially unconstrained”, and
“financially unconstrained”. To do so, I split the data set into septiles, ranking firms by index
constraint score, where firms in the top (bottom) septile have the highest (lowest) financial
constraint value and as such are categorized as “financially constrained” (“financially
unconstrained”), and firms in the second (sixth) septile are categorized as “highly likely
financially constrained” (“highly likely financially unconstrained”), and so on and so forth. To
identify constrained firms from unconstrained firms via credit rating, I categorize firms with an
S&P non-investment grade credit rating as “financially constrained” and firms with an S&P
investment grade credit rating as “financially unconstrained”. To make sure I properly identify
constrained firms from unconstrained firms, I start the baseline regression including the
financially constrained score based on the KZ index and re-run the analysis three more times
(including the SA and WW index and S&P credit rating) to check for robustness. I choose to
include several measures of financial constraint since none of the measures are without
controversy and financial literature is divided about which one is the most valid indicator of
financial constraint. By including all these measures of constraint, I follow the literature and
include all relevant indicators of constraint in my analysis. The reason for including discrete
variables (through dummy variables indicating levels of constraint) rather than continuous
variables (through direct constraint score) as indicators of financial constraint lies in the
reasoning that a small change in constraint is not likely to significantly affect a firm’s financing
23. FINANCIALLY CONSTRAINED FIRMS AND THEIR FINANCING BEHAVIOUR
23
(4)
(5)
behaviour. On the other hand, a change in a firm’s degree of constraint, causing a firm to move
between actual levels of constraint, is much more likely to have an impact on firm financing
behaviour, and as such more relevant to this study.
The empirical strategy of this study relies on a series of panel regressions, where the baseline
regression has the following functional form:
FINTYPEi,t = αo + ∑ 𝛽6
𝑛=1 n * FCi,(t-1) +ϒ * Xi,t + εi,t,
where FINTYPE can take one the following dependent variables: equity issuance, debt issuance,
and trade credit issuance. As I have three different dependent variables, I run a series of three
regressions for this particular research question, each time with a different dependent variable.
The dummy variables indicating financial constraint are lagged and equal to 1 if a firm-year
observation is corresponding with that particular level of constraint, and 0 otherwise. I lag this
particular dummy variable to counter the possible effect of endogeneity, as higher debt issuance
levels can increase a firm’s level of constraint and a firm’s level of constraint can influence a
firm’s debt issuance levels. I am particularly interested in the effect of constraint on firm
financing behaviour, which is best captured by using a lagged variable. Xi,t represents a vector
of control variables that control for firm size, profitability, Tobin’s q, investment, and cash
resources as these variables are known for their impact on firm capital structure (Winker (1999),
Beck, Demirgüç-Kunt and Maksimovic (2002), Frank and Goyal (2009)). β would measure the
impact of financial constraint level on a firm’s financing decision. ϒ represents a vector of
coefficients and εi,t an error-term. I estimate all regressions separately for each measure of
financial constraint to alleviate concerns that the results are driven by an invalid measure of
financial constraint.
Sub-question (b): What effect did the 2008 financial crisis have on the financing behaviour of
financially constrained firms?
To enhance the empirical analysis, I focus on financially constrained firms and analyze the
effects of the financial crisis on their financing behaviour. As a result, I add a dummy variable
measuring the impact of the 2008 financial crisis to the empirical analysis. Moreover, to assess
the direct impact of the financial crisis in conjunction with financial constraint on firm financing
behaviour, I introduce an interaction term in the baseline regression. This provides the
following empirical function:
FINTYPEi,t = αo + ∑ 𝛽6
𝑛=1 n * FCi,(t-1)+ ẞ7 * D_CRISIS +
ẞ8 * D_FCi,(t-1) * D_CRISIS + ϒ * Xi,t + εi,t,
24. FINANCIALLY CONSTRAINED FIRMS AND THEIR FINANCING BEHAVIOUR
24
(6)
where FINTYPE again consists of three different dependent variables (i.e., equity issuance, debt
issuance, and trade credit issuance). The main variable of interest in this regression is the
interaction variable that measures the impact of financial constraint during crisis years on firm
financing choice. Again, I include a vector of control variables to account for other effects.
Sub-question (c): What substitution behaviour in funding can be observed for financially
constrained firms?
To conclude the empirical analysis, I study whether firms display certain substitution
behaviour between debt and equity and/or debt and trade credit. More specifically, I identify
the effect of a change in debt levels interacted with a firm’s level of constraint on firm equity
issuance and trade credit issuance, where I expect that a negative change in debt levels
associated with a high degree of financial constraint positively affects equity issuance and trade
credit issuance. To test for this, I use the following empirical framework:
FINTYPEi,t = αo + ∑ 𝛽6
𝑛=1 n * FCi,(t-1) + ẞ7 * ΔDEBTi,(t-1) +
ẞ8 * D_FCi,(t-1) * ΔDEBTi,(t-1) + ẞ9 * D_FCi,(t-1) * ΔDEBTi,(t-1) * D_CRISIS + ϒ * Xi,t + εi,t,
where FINTYPE consists of two dependent variables, including equity issuance and trade credit
issuance. By adding the change in debt to the analysis I analyze the effect of a change in a firm’s
debt level on firm financing behaviour. Put differently, does a decrease in debt levels cause a
firm to increase equity and/or trade credit levels? Main variables of interest in this analysis are
the interaction effects that measure the effect of a change in debt together with a firm’s level of
constraint (and a crisis dummy) on equity issuance and trade credit issuance.
Lastly, in all the empirical analyses I introduce cross-sectional fixed effects to control for
unobservable factors affecting the financial behaviour of corporates. Time fixed effects are
captured by including a crisis dummy to the analysis. The next chapter introduces the data set
used in this study.
25. FINANCIALLY CONSTRAINED FIRMS AND THEIR FINANCING BEHAVIOUR
25
IV. DATA SET
This chapter presents the data set used in this study and gives an overview of its composition
and descriptive statistics.
A. Data and Data Sources
To access information on firms’ balance sheets, income statements and statements of cash
flow, I refer to the Compustat Fundamentals database. For information on firm credit rating I
access the Compustat Ratings database. As a sample I select all Northern-American firms that
have annual information available on all variables over the period 2002 until 2014 in the
Compustat databases. I exclude financials, regulated utilities, services, public administration
and nonclassifiable industries from the sample (SIC 6000 to 6799, 4900 to 4949, 7000 to 8999,
9100 to 9729, and 9900 to 9999, respectively). To avoid any financial shocks caused by the
dot-com bubble in 2000 I start the sample period in 2002. This provides me with six years of
data before the 2008 financial crisis and six years of data after the onset of the financial crisis.
I delete firm-year observations that have missing values for the variables total debt and total
assets4
. I also delete duplicate firm-year observations and semi-annual observations5
. Then I
merge the data from the Compustat Fundamentals database with the data from the Compustat
Ratings database. This results in a total sample of 54,194 firm-year observations. Next, I
calculate the respective indices to acquire financial constraint values. For each index I classify
the top septile of the data set as financially constrained, the second septile as highly likely
financially constrained, and so on and so forth. I create dummy variables for each septile of the
data set indicating the corresponding level of constraint. To conclude, I winsorize variables at
the 5 and 95 percent level to reduce skewness and kurtosis and consequently prevent outliers
from impacting the analyses6
.
B. Descriptive Statistics
I start the empirical analysis by providing summary statistics of some of the key variables
used in this analysis in Table 1. As can be observed from Panel B of Table 1, constrained firms
4
When calculating the respective constraint indices, each firm-year observation is required to have non-missing
information on each variable that is part of the index for it to be included in the analysis. I do not completely
exclude these observations from the entire data set as this results in an unnecessary reduction of firm-year
observations.
5
113 firm observations in the data set have semi-annual observations taking place in April and December of the
same year. For these observations, I delete the April observations.
6
I winsorize all variables at the 5 and 95 percent level, except for profitability and debt issuance, which I winsorize
at the 1 and 99 percent level.
26. FINANCIALLY CONSTRAINED FIRMS AND THEIR FINANCING BEHAVIOUR
26
in general have higher leverage levels, lower profitability ratios, fewer asset totals, and less
internal cash resources available than unconstrained firms. These results are consistent
throughout the different measures of constraint (with cash resources being the exception). Here
it can be clearly seen that the respective indices load positively on leverage and negatively on
profitability and firm size. Consistent with literature, the indices take into account that a small
asset-based structure, financial distress, liquidity issues, and debt overhang are all possible
indicators of financial constraint. Interesting result is that although the indices measure
constraint through different variables, they seem to be consistent with regards to basic constraint
indicators, such as size, profitability, and leverage. So far, the indices do not contradict each
other; which also indicates that it does not necessarily mean that the results are driven by the
variables included in the indices. For instance, where the SA index only includes size and age
as estimators of financial constraint, it projects the same results with regards to leverage and
profitability as the KZ index, an index that includes a positive (negative) loading on debt
(profitability) in its index. Of course, it could also be that an underlying factor such as size is
driving these results, for which I naturally control in the empirical analysis.
In terms of financing behaviour, Table 1 indicates that the average use of trade credit amongst
financially constrained firms is much higher than the average use of trade credit amongst
unconstrained firms. This result persists across the different measures of constraint, reducing
the concern that a specific index loading positively on the use of debt of any kind drives these
results. The average increased use of trade credit by financially constrained firms could indicate
that constrained firms explore alternative funding sources in order to replace the funding
sources that they have limited access to.
As far as constrained firms’ investment opportunities go, the results are somewhat
contradictive for each measure of financial constraint. All indices except for the WW index
indicate that constrained firms make on average larger capital expenditures than unconstrained
firms. This corresponds with theory, as smaller and younger firms relatively invest more than
larger and older firms (Bassetto & Kalatzis (2011), Carreira & Silva (2010)).
When looking at direct firm financing behaviour, the results per constraint measure vary
somewhat. According to both the KZ and SA index, financially constrained firms have
significantly higher average debt issuance ratios, equity issuance ratios, and trade credit
issuance ratios. The WW index and S&P credit rating provide mixed results. As a firm, being
financially constrained indicates restricted access to external finance such as debt, however,
these summary statistics show a different picture. A partial, reasonable explanation for the
27. FINANCIALLY CONSTRAINED FIRMS AND THEIR FINANCING BEHAVIOUR
27
greater use of external debt by constrained firms could be the positive loading that the KZ and
WW index have on long-term debt, meaning that these indices classify firms with higher debt
levels as more financially constrained. For the SA index there is no such loading on external
debt, however, it shows the same results with regards to debt issuance7
. Unobserved factors
could perhaps drive these results. To gain more insight into this specific issue, empirical
analyses that control for other (un)observed factors are introduced in the next chapter of this
study. Average equity issuance levels are also higher for constrained firms. This, along with the
fact that the average issuance ratio of equity is higher than the average issuance ratio of debt,
possibly indicates that constrained firms substitute equity for debt. However, more in-depth
analyses are necessary to make convinced statements about the substitution behaviour of
constrained corporates. Among constrained firms, trade credit is the least favorite of all external
financing sources as trade credit issuance ratios are lowest of all issuance ratios for constrained
firms. This is a probable result, as trade credit is rather expensive and usually of shorter
maturity. The average use of trade credit is higher for constrained firms compared to
unconstrained firms, possibly indicating that constrained firms use this type of credit as a
substitute for other financing sources. As only the KZ index has a positive loading on total debt,
the consistent results throughout nearly all different measures of constraint rule out the
possibility that these results are driven by a positive loading of trade credit on financial
constraint.
When testing the equality of means of all variables, ANOVA results provide support that the
means of these variables are not equal per constraint level, indicating that there is significant
difference in mean levels among different levels of constraint. Since these are univariate
statistics, I next turn to multivariate regressions to assess what differences exist in firm
financing behaviour between various levels of constraint after I condition for other
(un)observed factors. The next chapter introduces the relevant analyses as performed in this
study.
7
Calculating average issuance values categorized by a lagged constraint indicator does not significantly alter any
results.
28. FINANCIALLY CONSTRAINED FIRMS AND THEIR FINANCING BEHAVIOUR
28
Table 1
Overview Summary Statistics Full Sample
Panel A reports summary statistics for the full sample in this study (with n = 40,353 observations), including statistics for the
main variable of constraint (KZ value) in this study. Panel B reports mean values per constraint level based on all measures of
constraint in this study, being the Kaplan-Zingales (KZ) index, the Size-Age (SA) index, the Whited-Wu (WW) index, and S&P
credit rating. The indices are calculated as follows: KZ = −1.001909 (Cash Flow/K) + 0.2826389 (Tobin′s Q) + 3.139193
(Debt/TotalCapital) − 39.3678 (Dividends/K) − 1.314759 (Cash/K), SA = − 0.737 (Size) + 0.043 (Size2
) − 0.040 (Age), and
WW = − 0.091 (CF) − 0.062 (DIVPOS) + 0.021 (TLTD) − 0.044 (LNTA) + 0.102 (ISG) − 0.035 (SG). Financially constrained
firms (FCKZ) are those firms that are ranked in the top septile of the distribution, and financially unconstrained firms are those
firms that are ranked in the bottom septiles of the distribution. The S&P credit rating indicates if a firm is classified as non-
investment grade, and therefore more constrained than investment grade firms. Firms with a non-investment grade S&P domestic
long term issuer credit rating are classified as financially constrained in this case. Leverage is calculated by dividing total debt
by total assets and profitability is calculated by dividing operating income before depreciation over total assets. Firm size is
measured by taking the natural logarithm of total assets. Trade credit is measured as accounts payable (trade) divided by total
assets. Tobin’s q is calculated as (total assets plus December market equity, minus common/ordinary equity total, minus deferred
taxes, divided by total assets. Investment is capital expenditures divided by net sales. Cash, debt issuance, stock issuance, and
trade issuance are all scaled by total assets. All variables are winsorized at the 5 and 95 percent level, except for profitability
and debt issuance, which are winsorized at the 1 and 99 percent level. An equality of means-test for all variables categorized by
constraint dummy’s based on KZ score is also included. Observations with missing values are not included. Values are reported
over an annual 2002-2014 period and derived from the Compustat North-America Annual Fundamentals and Ratings Databases.
Panel A: Summary statistics full sample (n = 40,353)
LEVERAGE INVESTMENT FIRM
SIZE
TRADE
CREDIT
KZ VALUE TOBIN’S Q PROFITABILITY
Mean 0.288462 0.160880 5.837497 1.447303 -3.896917 2.157509 -0.009985
Median 0.236478 0.039848 5.967126 0.358484 -0.228923 1.436408 0.098583
Maximum 1.022354 1.303851 13.08138 12.00321 12.64460 12.51168 1.065896
Minimum 0.000000 0.001900 -6.907755 0.026786 -58.56283 0.659664 -1.765337
Std. Dev. 0.246730 0.309841 2.654877 2.908116 12.93836 2.220020 0.383918
Skewness 1.303201 2.791396 -0.281471 2.874871 -2.871166 3.275707 -3.149606
Kurtosis 4.511921 9.875066 3.124057 10.18508 11.92275 14.34070 13.64545
Panel B: Reported mean values by constraint indication
(based on KZ-, SA-, WW Index & Standard & Poor’s Credit Rating (investment grade vs. non-investment grade)
D_FC1 KZ D_HLFC2 KZ D_LFC3 KZ D_NE4 KZ D_NLFC5 KZ D_HNLFC6 KZ D_NFC7 KZ
Leverage 0.511109 0.320215 0.167409 0.150004 0.161369 0.148011 0.152525
Investment 0.181618 0.252192 0.259681 0.161023 0.109312 0.095821 0.102520
Firm Size 2.798466 5.699398 5.463330 5.938177 6.143086 5.919525 4.641767
Trade Credit 0.184283 0.091443 0.081086 0.085523 0.090424 0.085332 0.086761
Tobin’s q 5.105613 1.666506 1.533829 1.674121 1.906769 2.252894 3.166715
Profitability -0.644219 -0.013376 0.015035 0.061483 0.071451 0.048448 -0.097544
Cash 0.159221 0.069924 0.085029 0.131069 0.159544 0.195525 0.290041
Debt Issuance 0.102004 0.017639 -0.002849 -0.000169 0.006408 0.009888 0.024639
Equity Issuance 0.198617 0.053287 0.060103 0.046589 0.042194 0.057193 0.152155
Trade Issuance 0.021938 0.003801 0.002566 0.004660 0.005140 0.005346 0.004978
(table continues next page)
30. FINANCIALLY CONSTRAINED FIRMS AND THEIR FINANCING BEHAVIOUR
30
V. RESULTS AND DISCUSSION
This chapter provides an overview of results that can be derived from the empirical analyses
along with a discussion of those results.
A. Overview of Results
The analysis as performed in this paper has three parts to it. First, I analyze the direct effect
of financial constraint on firm financing choice, being debt, equity, and trade credit. Second, I
study the effect of the financial crisis on a constrained firm’s particular financing choice, and
third, I investigate if constrained firms display certain substitution behaviour, i.e., whether a
negative change in debt issuance levels causes constrained firms to refer to other sources of
financing, such as equity and/or trade credit. This chapter provides an elaborate overview of
the results obtained, along with the interpretation of these results for each relevant part. Each
analysis is executed by including the KZ index as a basic measure of financial constraint.
Robustness checks involve the SA index, WW index and S&P credit rating. An overview of
regression results is provided in Table 2 to 5.
i. Debt as a Financing Choice
I now describe the results from the first analysis in which I estimate Eq. (5). Regression
coefficients of a panel regression performance for the entire sample are reported in Table 2.
Dependent variable in this regression is firm debt issuance to total assets. As financially
constrained firms face restrictions from issuing additional debt, regression results should
indicate that these type of firms have lower debt issuance levels than unconstrained firms. As
the analysis indicates, during normal times, financially constrained firms issue 5.7 percentage
points less debt than unconstrained firms and highly likely financially constrained firms issue
3.4 percentage points less debt than unconstrained firms, with both effects significant at the 1
percent level. These estimations are quite substantial and thus can be interpreted as
economically meaningful since they clearly demonstrate that severe levels of financial
constraint have a considerably negative impact on firm debt issuance. Lower levels of constraint
have no significant effect on a firm’s decision to issue debt. However, re-estimating the
regression using different constraint parameters does not ensure the robustness of these
findings. As for both the SA and WW index, financially constrained firms issue more debt than
constrained firms, with both effects significant at the 1 percent level. More specifically, each
subsample of firms with larger financial constraint values than the reference group (i.e., the
subsample of firms with the lowest level of constraints) issues more debt than the reference
31. FINANCIALLY CONSTRAINED FIRMS AND THEIR FINANCING BEHAVIOUR
31
Table 2
Regression of Total Debt Issuance to Total Assets on Financial Constraint,
the 2008 Financial Crisis, and Control Variables
Table 2 reports coefficients, probability values, and significance levels for panel regressions
estimating Eq. (5) with dependent variable debt issuance to total assets and explanatory variables
financial constraint, firm size, profitability, investment, Tobin’s q, cash, and the 2008 financial
crisis. The table reports regression results with input of the KZ index, SA index, WW index, and
S&P credit rating (investment grade vs. non-investment grade) as different measures of constraint.
The dummy variable representing firms with the smallest form of financial constraint is excluded
from the regression as a reference group.
(1)
KZ Index
(2)
SA Index
(3)
WW Index
(4)
S&P Rating
Δ Total Debt / Total Assets
C -0.179***
(0.00)
-0.391***
(0.00)
-0.233***
(0.00)
-0.545***
(0.00)
D_FC1 (-1) -0.057***
(0.00)
0.200***
(0.00)
0.112***
(0.00)
0.007
(0.19)
D_HLFC2 (-1) -0.034***
(0.00)
0.124***
(0.00)
0.080***
(0.00)
-
D_LFC3 (-1) -0.009
(0.12)
0.102***
(0.00)
0.067***
(0.00)
-
D_NE4 (-1) -0.000
(0.99)
0.075***
(0.00)
0.050***
(0.00)
-
D_NLFC5 (-1) 0.001
(0.89)
0.045***
(0.00)
0.032***
(0.00)
-
D_HNLFC6 (-1) 0.002
(0.65)
0.020***
(0.00)
0.026***
(0.00)
-
D_CRISIS -0.001
(0.54)
-0.002
(0.63)
-0.001
(0.67)
0.008**
(0.02)
D_CRISIS * D_FC1 (-1) 0.002
(0.79)
-0.011
(0.27)
0.008
(0.23)
-0.015***
(0.00)
FIRM SIZE 0.035***
(0.00)
0.058***
(0.00)
0.034***
(0.00)
0.062***
(0.00)
PROFITABILITY -0.103***
(0.00)
-0.124***
(0.00)
-0.099***
(0.00)
0.008
(0.66)
INVESTMENT 0.067***
(0.00)
0.050***
(0.00)
0.076***
(0.00)
0.134***
(0.00)
TOBIN’S_Q 0.009***
(0.00)
0.003***
(0.00)
0.007***
(0.00)
0.001
(0.69)
CASH -0.145***
(0.00)
-0.086***
(0.00)
-0.126***
(0.00)
0.013
(0.55)
Adjusted R-squared 0.182 0.147 0.174 0.164
F-stat (P-value) 2.356 (0.00) 2.177 (0.00) 2.375 (0.00) 2.377 (0.00)
Fixed effects cross-section cross-section cross-section cross-section
Number of observations 41,067 25,160 49,718 11,744
*, **, *** Significant at the 1 percent, 5 percent, and 10 percent level, respectively.
32. FINANCIALLY CONSTRAINED FIRMS AND THEIR FINANCING BEHAVIOUR
32
group. These effects, by definition, contradict the meaning of financial constraint, as financially
constrained firms should find it more difficult or even impossible to issue additional debt. When
referring to S&P credit rating as indicator of constraint, the effect of constraint on debt issuance
no longer remains significant.
Table 2 also reports coefficients and significance levels on control variables included in the
analysis. The coefficients on most control variables are as expected, as firm size, investment
and Tobin’s q all have a positive effect on a firm’s debt issuance decision, whereas profitability
and cash have a negative effect. All these effects are rather straightforward, except for perhaps
Tobin’s q. Tobin’s q measures firm market-to-book ratios, hence indirectly, firm growth
opportunities. Finance literature on that topic is divided, with a long-standing general view that
firms with high growth opportunities experience greater borrowing costs and consequently
issue less debt. However, Chen & Zhao (2006) discover a positive relation between market-to-
book and leverage ratio and designate the previously documented negative relation as a result
of a subset of firms with high market-to-book ratios. All control variables can be interpreted as
economically significant. For instance, a 1 standard deviation increase in a firm’s profitability
ratio decreases a firm’s debt issuance ratio with 3.954 percentage points and a 1 standard
deviation increase in firm investment increases a firm’s debt issuance ratio with 2.076
percentage points.
A dummy variable capturing the effects of the 2008 financial crisis is also included in Table
2. Regression results indicate that the 2008 crisis did not have a significant effect on a firm’s
decision to issue less or more debt, not even for constrained firms. Therefore, I cannot conclude
that the 2008 financial crisis negatively affected a (constrained) firm’s debt issuance levels or
that debt supply and/or demand tightened during that period.
Previously discussed results might also be influenced by a financially constrained firm’s
decision to issue long-term debt over short-term debt or vice versa. Perhaps constrained firms
might experience less restriction towards one type of debt over the other. Both debt maturities
involve different aspects and consequences, and it would be interesting to see if financial
constraint affect them both differently. I estimate these equations by means of only the KZ
index and the WW index. Table 3 provides an overview of regression results. From those, I
observe that the results for short- and long-term debt issuance are rather similar to the estimation
of total debt issuance. The coefficient signs on financial constraint are similar to the previous
estimation, indicating that the positive effect on constraint is not driven by a preference of short-
term debt over long-term debt or vice versa. However, the interaction effect of constraints and
33. FINANCIALLY CONSTRAINED FIRMS AND THEIR FINANCING BEHAVIOUR
33
Table 3
Regression of Short- and Long-Term Debt Issuance to Total Assets on
Financial Constraint, the 2008 Financial Crisis, and Control Variables
Table 2 reports coefficients, probability values, and significance levels for panel regressions estimating Eq. (5)
with dependent variables short- and long-term debt issuance to total assets and explanatory variables financial
constraint, firm size, profitability, investment, Tobin’s q, cash, and the 2008 financial crisis. The table reports
regression results with input of the KZ index and WW index as different measures of constraint. The dummy
variable representing firms with the smallest form of financial constraint is excluded from the regression as a
reference group.
(1)
KZ Index
(2)
WW Index
(1)
KZ Index
(2)
WW Index
Δ Short-Term Debt /
Total Assets
Δ Long-Term Debt /
Total Assets
C -0.018***
(0.00)
-0.045***
(0.00)
-0.090***
(0.00)
-0.141***
(0.00)
D_FC1 (-1) -0.008***
(0.00)
0.034***
(0.00)
-0.021***
(0.00)
0.049***
(0.00)
D_HLFC2 (-1) -0.009***
(0.00)
0.020***
(0.00)
-0.023***
(0.00)
0.038***
(0.00)
D_LFC3 (-1) -0.002
(0.12)
0.018***
(0.00)
-0.009***
(0.00)
0.027***
(0.00)
D_NE4 (-1) 6.11E-05
(0.97)
0.013***
(0.00)
-0.002
(0.33)
0.028***
(0.00)
D_NLFC5 (-1) -0.001
(0.51)
0.009***
(0.00)
0.002
(0.36)
0.015***
(0.00)
D_HNLFC6 (-1) 0.001
(0.43)
0.005**
(0.02)
0.002
(0.27)
0.009***
(0.00)
D_CRISIS 0.000
(0.77)
0.001
(0.27)
-0.003***
(0.00)
-0.001
(0.13)
D_CRISIS * D_FC1 (-1) 8.06E-05
(0.97)
-0.003*
(0.07)
-0.008***
(0.01)
-0.017***
(0.00)
FIRM SIZE 0.005***
(0.00)
0.007***
(0.00)
0.018***
(0.00)
0.021***
(0.00)
PROFITABILITY -0.021***
(0.00)
-0.023***
(0.00)
-0.023***
(0.00)
-0.025***
(0.00)
INVESTMENT 0.006***
(0.00)
0.007***
(0.00)
0.044***
(0.00)
0.048***
(0.00)
TOBIN’S_Q 0.000
(0.14)
0.000*
(0.09)
0.000
(0.57)
0.000
(0.43)
CASH -0.033***
(0.00)
-0.032***
(0.00)
-0.022***
(0.00)
-0.019***
(0.00)
Adjusted R-squared 0.028 0.029 0.056 0.052
F-stat (P-value) 1.172 (0.00) 1.178 (0.00) 1.357 (0.00) 1.330 (0.00)
Fixed effects cross-section cross-section cross-section cross-section
Number of observations 41,113 40,857 41,060 40,805
*, **, *** Significant at the 1 percent, 5 percent, and 10 percent level, respectively.
34. FINANCIALLY CONSTRAINED FIRMS AND THEIR FINANCING BEHAVIOUR
34
crisis becomes significant for long-term debt issuance; indicating that during the 2008 financial
crisis, financially constrained firms decreased long-term debt issuance by approximately 0.8 to
1.7 percentage points. This result is economically meaningful and confirmed by both measures
of financial constraint.
ii. Equity as a Financing Choice
The pecking order theory as described earlier in this study proposes equity as a financing
measure of last resort due to the negative consequences resulting from asymmetric information.
However, firms constrained from debt might issue higher levels of equity to counter the effect
of a gap in debt financing. This section analyses the effect of financial constraint, the 2008
financial crisis, a change in debt level, and control variables on a firm’s decision to issue stock.
Dependent variable is firm stock issuance to total assets. Regression results are reported in
Table 4. The coefficients on financial constraint indicate that during normal times, financially
constrained firms issue relatively larger amounts of equity than unconstrained firms, that is, by
more than 9.8 percentage points (this is when the effect of a change in debt is controlled for).
Worth mentioning is the monotonic decline of stock issuance with level of financial constraint.
Overall, each firm with a higher constraint level than the reference group (i.e., the financially
unconstrained subsample) issues more equity than the reference group itself. All of these effects
are significant at the 1 percent level. These results persist when re-estimating the analysis by
means of the SA index, the WW index, and S&P credit rating as indicators of constraint,
confirming that financially constrained firms issue relatively higher equity levels than
unconstrained firms during normal times.
The analysis also incorporates the effects of the 2008 financial crisis on equity issuance. As
internal cash resources diminished, financial constraints increased, and bank lending tightened
during the 2008 crisis, the pecking order theory predicts firms to rely on alternative sources of
financing, with (constrained) firms intensifying the use of equity during that particular period.
However, regression results indicate a different situation. During crisis years, unconstrained
firms issued less equity than during non-crisis years, an effect that is highly significant for all
measures of constraint (except for the S&P credit rating method). According to the KZ index,
the 2008 financial crisis lowered the equity issuance of unconstrained firms by roughly 0.3
percentage points. This effect was even stronger for constrained firms, that issued 0.7
percentage points less equity during crisis years. Despite that stronger influence, constrained
firms still issued 9.1 percentage points more equity than unconstrained firms during the 2008
financial crisis. Using the SA index as an indicator of financial constraint yields similar results.
35. FINANCIALLY CONSTRAINED FIRMS AND THEIR FINANCING BEHAVIOUR
35
Possible explanation for the decrease in equity issuance among constrained firms during the
crisis could be that the intense negative pressure on the stock market during the time prevented
and/or even scared managers from issuing equity at low market prices, an effect that would
bring support to other capital structure theories, such as the market-timing theory as proposed
by Baker (2002). Another explanation could be that because of the economic downturn, firms
had low capital expenditures and therefore less need for external financing. Another assumption
is that during that period financial constraints stretched to the equity market as well, where
investors had neither the willingness nor the available funds to invest in corporate stock.
Another assumption I made at the beginning of this study is that constrained firms are more
likely to display certain substitution behaviour towards other sources of financing after a change
in debt level has occurred. Put differently, I expect that negative change in debt level causes
firms to increase other sources of financing, such as equity. For this, I look at the interaction
effect between debt issuance and financial constraint (both variables are lagged). From the
regression results in Table 4, I infer that the relationship for unconstrained firms between debt
issuance and stock issuance is a positive one during normal times; that is, one moves in the
same direction with the other. More specifically, a one-unit decrease (increase) in debt causes
unconstrained firms to decrease (increase) equity by 1.0 to 4.8 percentage points during normal
times, depending on the measure of financial constraint. For constrained firms, the effect of a
change in debt on equity issuance is insignificant, except for the SA index. The SA index
indicates that during normal times, financially constrained firms that experienced a one-unit
decrease in their debt issuance to total assets ratio, increased their stock issuance to total assets
ratios by 3 percentage points, an effect that is economically meaningful. From these results, it
can be inferred that for unconstrained firms, the issuance of debt is positively related to the
issuance of equity, where they attract and discard funding in a parallel manner. For constrained
firms, the regression results show some indication of a negative relationship between debt
issuance and equity issuance, however I cannot compellingly conclude that constrained firms
substitute debt with equity as this effect is not robust throughout the different measures of
constraint.
Nevertheless, regression results indicate that during the 2008 financial crisis, constrained
firms did substitute equity for debt, which is confirmed by the KZ index, the SA index, and the
36. FINANCIALLY CONSTRAINED FIRMS AND THEIR FINANCING BEHAVIOUR
36
Table 4
Regression of Net Stock Issuance to Total Assets on Financial Constraint,
the 2008 Financial Crisis, Debt Issuance, and Control Variables
Table 3 reports coefficients, probability values, and significance levels for panel regressions
estimating Eq. (6) with dependent variable stock issuance to total assets and explanatory variables
financial constraint, firm size, profitability, investment, Tobin’s q, cash, the 2008 financial crisis,
and debt issuance. the table reports regression results with input of the KZ index, SA index, WW
index, and S&P credit rating (investment grade vs. non-investment grade) as different measures of
constraint. The dummy variable representing firms with the smallest form of financial constraint
is excluded from the regression as a reference group.
(1)
KZ Index
(2)
SA Index
(3)
WW Index
(4)
S&P Rating
Δ Stock / Total Assets
C -0.113***
(0.00)
-0.367***
(0.00)
-0.043***
(0.00)
0.055***
(0.00)
D_FC1 (-1) 0.098***
(0.00)
0.408***
(0.00)
0.020*
(0.08)
0.004**
(0.04)
D_HLFC2 (-1) 0.059***
(0.00)
0.266***
(0.00)
0.024***
(0.00)
-
D_LFC3 (-1) 0.050***
(0.00)
0.143***
(0.00)
0.039***
(0.00)
-
D_NE4 (-1) 0.036***
(0.00)
0.081***
(0.00)
0.023***
(0.00)
-
D_NLFC5 (-1) 0.026***
(0.00)
0.046***
(0.00)
0.013**
(0.03)
-
D_HNLFC6 (-1) 0.017***
(0.00)
0.024***
(0.00)
-0.000
(0.92)
-
D_CRISIS -0.003**
(0.02)
-0.007***
(0.00)
-0.007***
(0.00)
-0.000
(0.82)
D_CRISIS * D_FC1 (-1) -0.007*
(0.09)
-0.018***
(0.01)
0.008**
(0.05)
0.001
(0.68)
DEBT ISSUANCE (-1) 0.010**
(0.03)
0.048***
(0.00)
0.022***
(0.00)
0.019***
(0.01)
DEBT ISSUANCE (-1) *
D_FC1 (-1)
0.010
(0.13)
-0.030***
(0.00)
0.013
(0.20)
0.001
(0.94)
DEBT ISSUANCE (-1) *
D_FC1 (-1) * D_CRISIS
-0.027***
(0.00)
-0.028**
(0.03)
-0.049***
(0.01)
0.002
(0.81)
FIRM SIZE 0.009***
(0.00)
0.042***
(0.00)
0.001
(0.60)
-0.007***
(0.00)
PROFITABILITY -0.025***
(0.00)
-0.059***
(0.00)
-0.022***
(0.00)
-0.056***
(0.00)
INVESTMENT 0.075***
(0.00)
0.053***
(0.00)
0.079***
(0.00)
0.012***
(0.01)
TOBIN’S_Q 0.014***
(0.00)
0.015***
(0.00)
0.016***
(0.00)
0.002**
(0.03)
(table continues next page)
37. FINANCIALLY CONSTRAINED FIRMS AND THEIR FINANCING BEHAVIOUR
37
(table 3 – cont’d)
CASH 0.219***
(0.00)
0.204***
(0.00)
0.233***
(0.00)
0.047***
(0.00)
Adjusted R-squared 0.551 0.553 0.536 0.342
F-stat (P-value) 8.038 (0.00) 8.473 (0.00) 7.776 (0.00) 4.250 (0.00)
Fixed effects cross-section cross-section cross-section cross-section
Number of observations 37,643 20,300 40,260 9,727
*, **, *** Significant at the 1 percent, 5 percent, and 10 percent level, respectively.
WW index. A one-unit decrease in a constrained firm’s debt issuance8
to total assets ratio
increased its stock issuance to total assets ratio by 2.7 to 4.9 percentage points during that
period, depending on the measure of financial constraint. Again, these results are economically
meaningful. This indicates that during crisis times, the pecking order theory does hold for
financially constrained firms, as debt is replaced with equity.
The control variables in this analysis are all highly significant and robust throughout the
different measures of constraint. Firm size, investment, Tobin’s q, and cash have a positive
effect on a firm’s decision to issue equity, whereas profitability reports a negative effect. The
analyses report adjusted R-squared values of 0.34 to 0.55, indicating that the different models
are a good fit.
iii. Trade Credit as a Financing Choice
As a financing source, trade credit has certain advantages over other sources of financing. For
instance, a reduced information asymmetry between lender and borrower (i.e., supplier and
buyer) might induce financially constrained firms to refer to trade credit as an alternative
funding source. I estimate the effect of financial constraint, the 2008 financial crisis, a previous
change in debt, and several control variables on a firm’s decision to issue trade credit, and report
regression results in Table 5. Reported coefficients indicate that for the KZ index, a small,
negative, significant effect can be observed for the two top levels of financial constraint. For
all other measures of financial constraint however, the effect of financial constraint on trade
credit issuance is positive and significant, ranging from 0.3 to 9.4 more percentage points
compared to unconstrained firms, during normal times. From this, I can only conclude that
some evidence exists that financial constraints have a positive effect on trade credit issuance
during normal times, however this argument should be interpreted with caution as the different
8
Re-estimating the full regression including long-term debt issuance instead of total debt issuance as an
explanatory variable provides similar results.
38. FINANCIALLY CONSTRAINED FIRMS AND THEIR FINANCING BEHAVIOUR
38
measures of constraint provide different results, with a small negative effect for the KZ index,
but a positive, significant effect for all other measures of financial constraint.
Table 5 also reports regression coefficients that take into account the effects of the 2008
financial crisis. From those, I observe that during that particular period, trade credit issuance
diminished for unconstrained firms by roughly 0.5 to 0.7 percentage points, a finding that is
robust throughout all measures of financial constraint. Severe financial constraints had no
significant influence on a firm’s decision to issue more or less trade credit though. The SA
index and S&P credit rating provide significant results; however, they contradict each other in
terms of sign. As this study’s primary measure of constraint is the KZ index, I follow these
regression results and argue that the 2008 crisis had no significant effect on a constrained firm’s
decision to issue either more or less trade credit.
Regression results report a negative relationship between debt issuance and trade credit
issuance for unconstrained firms, indicating that unconstrained firms substitute equity for debt
during normal times. This relationship does not apply to constrained firms however, as the
relationship between debt issuance and trade credit is a positive one. This means that during
normal times, a one-unit decrease in a firm’s debt issuance to total assets ratio causes roughly
a 1.2 percentage points decrease in a firm’s trade issuance to total assets ratio. During times of
crises this changes, as a one-unit decrease in a constrained firm’s debt issuance9
to total assets
ratio increases that firm’s trade issuance to total assets ratio by 1.6 to 5.7 percentage points
(according to both the KZ and SA index). These results are economically meaningful and show
evident support for substitution behaviour amongst financially constrained firms during crisis
times.
The control variables show significant effects in this analysis, with a positive result for firm
size, profitability, investment, and Tobin’s q, and a negative result for cash and asset maturity.
I add asset maturity (measured by working capital) to this particular analysis as trade credit is
heavily impacted by a firm’s inventory level and other current assets and liabilities, and I want
to control for that effect. Next, I provide a discussion and interpretation of previously reported
results.
9
Re-estimating the full regression including long-term debt issuance instead of total debt issuance as an
explanatory variable provides similar results.
39. FINANCIALLY CONSTRAINED FIRMS AND THEIR FINANCING BEHAVIOUR
39
Table 5
Regression of Trade Credit Issuance to Total Assets on Financial
Constraint, the 2008 Financial Crisis, and Control Variables
Table 4 reports coefficients, probability values, and significance levels for panel regressions estimating
Eq. (6) with dependent variable trade credit issuance to total assets and explanatory variables financial
constraint, firm size, profitability, capital expenditure, Tobin’s q, cash, asset maturity, the 2008 financial
crisis, and debt issuance. The table reports regression results with input of the KZ index, SA index, WW
index, and S&P credit rating (investment grade vs. non-investment grade) as different measures of
constraint. The dummy variable representing firms with the smallest form of financial constraint is
excluded from the regression as a reference group.
(1)
KZ Index
(2)
SA Index
(3)
WW Index
(4)
S&P Rating
Δ Trade / Total Assets
C -0.052***
(0.00)
-0.165***
(0.00)
-0.098***
(0.00)
-0.040***
(0.00)
D_FC1 (-1) -0.005**
(0.03)
0.094***
(0.00)
0.055***
(0.00)
0.003*
(0.06)
D_HLFC2 (-1) -0.005**
(0.05)
0.079***
(0.00)
0.042***
(0.00)
-
D_LFC3 (-1) -0.001
(0.56)
0.060***
(0.00)
0.054***
(0.00)
-
D_NE4 (-1) -0.002
(0.38)
0.044***
(0.00)
0.034***
(0.00)
-
D_NLFC5 (-1) -0.002
(0.42)
0.028***
(0.00)
0.021***
(0.00)
-
D_HNLFC6 (-1) -0.002
(0.44)
0.014***
(0.00)
0.009***
(0.00)
-
D_CRISIS -0.006***
(0.00)
-0.007***
(0.00)
-0.005***
(0.00)
-0.005***
(0.00)
D_CRISIS * D_FC1 (-1) 0.002
(0.56)
0.024***
(0.00)
-0.000
(0.90)
-0.003***
(0.01)
DEBT ISSUANCE (-1) -0.010***
(0.00)
-0.006
(0.16)
-0.004*
(0.08)
-0.020***
(0.00)
DEBT ISSUANCE (-1) *
D_FC1 (-1)
0.012***
(0.01)
0.012**
(0.03)
-0.014**
(0.03)
0.009
(0.16)
DEBT ISSUANCE (-1) *
D_FC1 (-1) * D_CRISIS
-0.016***
(0.01)
-0.057***
(0.00)
0.038***
(0.00)
-0.008
(0.17)
FIRM SIZE 0.011***
(0.00)
0.024***
(0.00)
0.014***
(0.00)
0.004***
(0.00)
PROFITABILITY 0.006**
(0.02)
0.009***
(0.00)
0.004
(0.14)
0.016***
(0.00)
INVESTMENT 0.013***
(0.00)
0.002
(0.54)
0.011***
(0.00)
0.005
(0.11)
TOBIN’S_Q 0.004***
(0.00)
0.003***
(0.00)
0.003***
(0.00)
0.005***
(0.00)
(table continues next page)
40. FINANCIALLY CONSTRAINED FIRMS AND THEIR FINANCING BEHAVIOUR
40
(table 4 – cont’d)
CASH -0.036***
(0.00)
-0.018***
(0.00)
-0.032***
(0.00)
-0.019***
(0.00)
ASSET MATURITY -0.040***
(0.00)
-0.049***
(0.00)
-0.039***
(0.00)
-0.010***
(0.01)
Adjusted R-squared 0.111 0.083 0.101 0.089
F-stat (P-value) 1.759 (0.00) 1.579 (0.00) 1.695 (0.00) 1.644 (0.00)
Fixed effects cross-section cross-section cross-section cross-section
Number of observations 40,708 22,329 43,574 10,366
*, **, *** Significant at the 1 percent, 5 percent, and 10 percent level, respectively.
B. Discussion of Results
i. Firm Financing Behaviour
As the KZ index previously indicated, financially constrained firms issue less debt (both short-
and long-term) and more equity than unconstrained firms during normal times. Except for the
KZ index, all measures of constraint indicate a larger use of trade credit for constrained firms
versus unconstrained firms. This largely supports the hypotheses for the first research question.
Financially constrained firm experience limited access to external debt and show larger issuance
levels for alternative funding sources. During the 2008 financial crisis, financially constrained
firms lowered their long-term debt issuance, which also corresponds with the hypothesis for the
second research question. Reasonable explanation for this effect is that the supply of bank loans
tightened or that firms simply had less need for external finance due to the economic downturn
as a whole. Equity issuance also decreased during the 2008 crisis for both constrained and
unconstrained firms, although the effect was stronger for constrained firms. This suggests that
besides a downturn in the debt market, the equity market was also severely affected. Both
supply and demand factors could be possible factors here. Financially constrained firms show
also signs of substitution behaviour during crises times, as all measures of constraint (except
for S&P credit rating) indicate that during the 2008 financial crisis, constrained firms
substituted debt with equity and trade credit. However, from the estimated results I cannot
convincingly conclude that constrained firms substitute debt with other sources of financing
during normal times. So rather during normal times, constrained firms substitute debt with
equity and trade credit during crisis times. This result may seem a bit counterintuitive, as
according to the KZ index, the financial crisis caused a small decrease in equity issuance levels
for constrained firms that did not experience a change in debt recently and yielded no significant
result for trade credit issuance. Possible explanation could be that the gap in debt financing
forced financially constrained firms to refer to equity and trade credit to finance operations,
whereas firms that did not experience such a gap did not require alternative funding. However,