Course Project SAHS Analysis Project Guidelines and Gradin
Bus Com Project Assessments
1. Business Communications
Project Assessment Guideline
I. Written Research Project - based on 100 pts, 10% of course
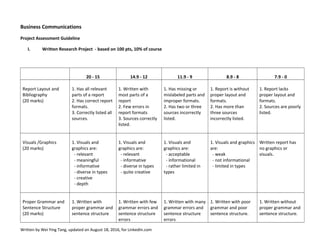
20 - 15 14.9 - 12 11.9 - 9 8.9 - 8 7.9 - 0
Report Layout and
Bibliography
(20 marks)
1. Has all relevant
parts of a report
2. Has correct report
formats.
3. Correctly listed all
sources.
1. Written with
most parts of a
report
2. Few errors in
report formats
3. Sources correctly
listed.
1. Has missing or
mislabeled parts and
improper formats.
2. Has two or three
sources incorrectly
listed.
1. Report is without
proper layout and
formats.
2. Has more than
three sources
incorrectly listed.
1. Report lacks
proper layout and
formats.
2. Sources are poorly
listed.
Visuals /Graphics
(20 marks)
1. Visuals and
graphics are:
- relevant
- meaningful
- informative
- diverse in types
- creative
- depth
1. Visuals and
graphics are:
- relevant
- informative
- diverse in types
- quite creative
1. Visuals and
graphics are:
- acceptable
- informational
- rather limited in
types
1. Visuals and graphics
are:
- weak
- not informational
- limited in types
Written report has
no graphics or
visuals.
Proper Grammar and
Sentence Structure
(20 marks)
1. Written with
proper grammar and
sentence structure
1. Written with few
grammar errors and
sentence structure
errors
1. Written with many
grammar errors and
sentence structure
errors
1. Written with poor
grammar and poor
sentence structure.
1. Written without
proper grammar and
sentence structure.
Written by Wei Ying Tang, updated on August 18, 2016, for LinkedIn.com
2. 20 - 15 14.9 - 12 11.9 - 9 8.9 - 8 7.9 - 1
Organization of
Information and
Report Unity
(20 marks)
1. Well organized
into logical parts.
2. Shows thoughts
and consideration of
subject.
3. Has introduction,
topics, and
conclusion/analysis/
recommendations
written with unity
and connectivity.
1. Organized into
mostly logical parts.
2. Shows some
thoughts and
consideration of
subject.
3. Has introduction,
topics, and
conclusion/analysis/
recommendations
written with some
unity and
connectivity.
1. Organized into an
acceptable report.
2. Shows little
thoughts and
consideration of
subject.
3. Has introduction,
topics, and
conclusion/analysis/
recommendations
written with little
unity and
connectivity.
1. Not well organized
and confusing.
2. Shows very little
thoughts and
consideration of
subject.
3. Has introduction,
topics, and
conclusion/analysis/
recommendations
written with confusing
parts or poorly
organized
information.
1. Poorly organized
with little logic.
2. Shows lack of
thoughts and
consideration of
subject.
3. Has introduction,
topics, and
conclusion/analysis/
recommendations
written with
confusing or missing
parts or no
organization.
Depth of Coverage,
Conclusion/Analysis/
Recommendation
(20 marks)
1. Well researched.
2. Subject is covered
fully.
3. Conclusion/
analysis/
recommendation
show creative
thoughts,
independent
thinking, proper logic
and reasoning, and
valid proofs.
1. Somewhat well
researched.
2. Subject is covered
fairly well.
3. Conclusion/
analysis/
recommendation
show some
independent
thinking, has some
logical reasoning,
and some valid
proofs.
1. Meeting the basic
standard.
2. Subject is covered.
3. Conclusion/
analysis/
recommendation
show little
independent
thinking, little logic
and reasoning, and
few valid proofs.
1. Poorly researched.
2.Subject is poorly
covered.
3. Conclusion/
analysis/
recommendation
show no independent
thinking, logic and
reasoning, and one or
two valid proofs.
1. Poorly researched.
2. Subject is
insufficiently
covered.
3. Conclusion/
analysis/
recommendation
lack substance,
coherence or valid
points.
Written by Wei Ying Tang, updated on August 18, 2016, for LinkedIn.com
3. II. PowerPoint and Oral Presentation – based on 100pts, 10% of course
25 - 21 20-16 15-11 10-6 5 - 1
PowerPoint:
Format
Organization
Clarity
Creativity
Bibliography
(25 marks)
1. Formats are very
organized and
creative.
2. Bullet points are
well written and
grammatically correct.
3. Research resources
are rich and well listed
in appropriate format.
1. Formats are
organized and well
presented.
2. Bullet points are
properly written and
one or two
grammatical errors.
3. Research resources
are above
requirement and are
listed in appropriate
format.
1. Formats are
organized in
acceptable and
readable format.
2. Bullet points are
written with three
or four errors.
3. Research
resources meet the
minimum
requirement and are
listed in proper
format.
1. Formats are not
well organized and
with little interests.
2. Bullet points are
poorly written with
many grammatical
errors.
3. Research resources
do not meet the
minimum
requirement.
1. Formats are
poorly organized
and lack interests.
2. Bullet points lack
coherence or
relevance and have
many grammatical
errors.
3. Research
resources are scare
or not meeting the
requirement.
PowerPoint:
Introduction
Content
Research
information
Visuals /Graphics
Conclusion
(25 marks)
1. PPT has good
introduction that
leads the audience
into the subject
coherently.
2. Content has
relevant topics that
are well researched
information.
3. PPT has many
visuals and graphics
and they are relevant
and creative.
4. Conclusion has
strong analysis, valid
1. PPT has good
introduction that
leads the audience
into the subject.
2. Content has good
researched
information on
relevant topics.
3. PPT has good and
relevant visuals and
graphics.
4. Conclusion is stated
clearly with valid
evidence and good
analysis.
1. PPT has an
introduction that
somewhat leads the
audience into the
subject.
2. Content has
relevant topics that
are research
information.
3. PPT has relevant
visuals and graphics.
4. Conclusion is
stated with some
supporting
information and a
1. PPT has an
introduction that lacks
coherence.
2. Content is poorly
organized research
information.
3. PPT has poor or
unconnected visuals
and graphics.
4. Conclusion is stated
with little support or
analysis.
1. PPT has an
introduction that
lacks direction.
2. Content has
irrelevant topics and
information is poorly
researched.
3. PPT has poor or
unrelated visuals
and graphics.
4. Conclusion is has
no supporting
information or
analysis. It is just a
report of
Written by Wei Ying Tang, updated on August 18, 2016, for LinkedIn.com
4. evidence, and
independent thinking.
light analysis of the
subject.
information.
Oral Presentation
25 - 21 20-16 15-11 10-6 5 - 1
Oral Presentation:
Group Effort
Preparation
Organization
Teamwork
Connectivity
(25 marks)
1. Presentation is
well- prepared and
well- organized, show
connectivity.
2. Presentation shows
good teamwork.
Everyone knows
his/her part and
supports each other.
3. Transitions
between team
members and topics
are done smoothly
and professionally.
1. Presentation shows
good preparation,
organization and
connectivity.
2. Presentation shows
teamwork. Everyone
knows his/her part
and shows
cooperation between
team members.
3. Transitions
between team
members and topics
are done smoothly.
1. Presentation
shows good
preparation and
organization.
2. Presentation
shows teamwork.
Everyone knows
his/her part well.
3. Transitions
between team
members and topics
are done with
acceptable
standard.
1. Presentation is not
well-prepared and not
well-organized-show
little connectivity.
2. Presentation shows
little teamwork.
There are one or two
members who do not
know their part well.
3. There are few
transitions between
team members and
topics.
1. Presentation is ill-
prepared and poorly
organized-show no
connectivity.
2. Presentation
shows no teamwork.
Team members do
not know his/her
part.
3. There are no
transitions between
team members and
topics.
Oral Presentation:
Student Evaluation
(25 marks)
1. Well-prepared and
well-organized
2. Excellent teamwork
and good transitions
3. Excellent oral
delivery by all
members
1. Nicely Prepared and
organized
2. Good teamwork
and transitions
3. Good presentation
by all
1. Acceptable level
of preparation and
organization
2. Acceptable
teamwork and little
transitions
3. Mix presentations
1. Loosely prepared,
lack organization
2. Little teamwork and
no transitions
3. Mostly poor
presentation
1. Poorly prepared,
no organization
2. No teamwork
3. Poor presentation
Written by Wei Ying Tang, updated on August 18, 2016, for LinkedIn.com