SlideShare a Scribd company logo
1 of 16
1
There are two main methods for computing
interest. Do you know the difference
between them? Do you know what
difference it makes in a savings account
after a period of some years? How does
this impact your analysis and investments
in Stock Market?
What is the difference between simple and compound
interest and does it really matter?
Economics of Arithmetic and Geometric
Growth Rates
CS110: Introduction to Computer Science: Lab8
Adapted by Fred Annexstein Univ Cincinnati
Prepared for SSAC by
Gary Franchy – Davenport University
© The Washington Center for Improving the Quality of Undergraduate Education. All rights reserved. 2005
Quantitative concepts and skills
Arithmetic Growth
Geometric Growth
Forward Modeling
Function, linear
Function, exponential
Graph, XY (scatter)
2
Simple interest is an example of arithmetic growth where the amount of
interest generated each term is constant; it is based on only the starting
amount. Year to year there is a constant difference in the value of the
savings account, and so the successive values track a linear function.
Compound interest is an example of geometric growth where the amount of
interest generated each term increases because it is based on both the
starting amount and the previously earned interest. Year to year there is a
constant ratio of the values in the savings account, and so the successive
values track an exponential function. Accordingly, compound interest is
commonly said to exhibit exponential growth,
Overview of Module
Slides 3-4 ask you to set up your worksheet and format the cells.
Slides 5-9 have you computing simple and compound interest for a set period of time and interest
rate. You will perform the calculation, graph the increasing savings accounts, and draw trendlines
through the plotted functions for the linearly increasing and geometrically increasing values.
Slides 10-12 ask you to calculate the difference between the two types of accounts using a variety
of interest rates.
Slides 13 has parts of assignment to hand in.
Slides 14-16 asks to consider the stock market and has remainder of assignment to hand in.
3
What is the difference in results between savings accounts that use simple
and compound interest when you invest $100,000 at 8% for 25 years?
Recreate this spreadsheet
= Cell with a number in it
= Cell with a formula in it
B C D E F G
2 Present Value = 100000 Year Simple Compound
3 Interest Rate = 8% 1
4 2
5 3
6 4
7 5
8 6
9 7
10 8
11 9
12 10
13 11
14 12
15 13
16 14
17 15
18 16
19 17
20 18
21 19
22 20
23 21
24 22
25 23
26 24
27 25
One way to answer the question
with a spreadsheet is to lay it out
year by year.
Type in the “%” symbol
when entering percents;
otherwise you must enter
the decimal form.
Question 1
4
B C D E F G
2 Present Value = $100,000 Year Simple Compound
3 Interest Rate = 8% 1
4 2
5 3
6 4
7 5
8 6
9 7
10 8
11 9
12 10
13 11
14 12
15 13
16 14
17 15
18 16
19 17
20 18
21 19
22 20
23 21
24 22
25 23
26 24
27 25
To format cells:
1. Select the cells.
2. Right-click the mouse.
3. Select “Format Cells”.
4. Choose “Number” tab.
5. Choose “Currency”.
6. Adjust “Decimal Places”
to the desired number of
places.
7. Select “OK”.
Question 1
Format these cells as
currency rounded to the
nearest dollar.
5
B C D E F G
2 Present Value = $100,000 Year Simple Compound
3 Interest Rate = 8% 1
4 2
5 3
6 4
7 5
8 6
9 7
10 8
11 9
12 10
13 11
14 12
15 13
16 14
17 15
18 16
19 17
20 18
21 19
22 20
23 21
24 22
25 23
26 24
27 25
Compute the results for future
value for each year in the column
labeled “Simple”.
The Simple Interest Formula:
Where
FV = Future Value ($)
PV = Present Value ($)
r = Interest Rate
t = Time (Years)
 
rt
PV
FV 
 1
Question 1
6
B C D E F G
2 Present Value = $100,000 Year Simple Compound
3 Interest Rate = 8% 1 $108,000
4 2 $116,000
5 3 $124,000
6 4 $132,000
7 5 $140,000
8 6 $148,000
9 7 $156,000
10 8 $164,000
11 9 $172,000
12 10 $180,000
13 11 $188,000
14 12 $196,000
15 13 $204,000
16 14 $212,000
17 15 $220,000
18 16 $228,000
19 17 $236,000
20 18 $244,000
21 19 $252,000
22 20 $260,000
23 21 $268,000
24 22 $276,000
25 23 $284,000
26 24 $292,000
27 25 $300,000
Compute the results for future
value for each year in the column
labeled “Compound”.
The Compound Interest Formula:
Where
FV = Future Value ($)
PV = Present Value ($)
r = Interest Rate
t = Time (Years)
 t
r
PV
FV 
 1
Question 1
7
Now create a single scatter graph
where future value is on the y-axis
and time is on the x-axis. Plot the
values for both accounts on the
same graph.
To draw a graph, you may
either click on the chart
wizard button
or use “Insert  Chart” from
the menu.
Question 1
B C D E F G
2 Present Value = $100,000 Year Simple Compound
3 Interest Rate = 8% 1 $108,000 $108,000
4 2 $116,000 $116,640
5 3 $124,000 $125,971
6 4 $132,000 $136,049
7 5 $140,000 $146,933
8 6 $148,000 $158,687
9 7 $156,000 $171,382
10 8 $164,000 $185,093
11 9 $172,000 $199,900
12 10 $180,000 $215,892
13 11 $188,000 $233,164
14 12 $196,000 $251,817
15 13 $204,000 $271,962
16 14 $212,000 $293,719
17 15 $220,000 $317,217
18 16 $228,000 $342,594
19 17 $236,000 $370,002
20 18 $244,000 $399,602
21 19 $252,000 $431,570
22 20 $260,000 $466,096
23 21 $268,000 $503,383
24 22 $276,000 $543,654
25 23 $284,000 $587,146
26 24 $292,000 $634,118
27 25 $300,000 $684,848
8
$0
$100,000
$200,000
$300,000
$400,000
$500,000
$600,000
$700,000
$800,000
0 5 10 15 20 25
Years
Future
Value
Add trendlines to each graph.
To add a trendline:
1. Place mouse over any data point of
the desired function.
2. Right-click the mouse.
3. Select “Add Trendline”.
4. Choose the function that resembles
the pattern
Question 1
B C D E F G
2 Present Value = $100,000 Year Simple Compound
3 Interest Rate = 8% 1 $108,000 $108,000
4 2 $116,000 $116,640
5 3 $124,000 $125,971
6 4 $132,000 $136,049
7 5 $140,000 $146,933
8 6 $148,000 $158,687
9 7 $156,000 $171,382
10 8 $164,000 $185,093
11 9 $172,000 $199,900
12 10 $180,000 $215,892
13 11 $188,000 $233,164
14 12 $196,000 $251,817
15 13 $204,000 $271,962
16 14 $212,000 $293,719
17 15 $220,000 $317,217
18 16 $228,000 $342,594
19 17 $236,000 $370,002
20 18 $244,000 $399,602
21 19 $252,000 $431,570
22 20 $260,000 $466,096
23 21 $268,000 $503,383
24 22 $276,000 $543,654
25 23 $284,000 $587,146
26 24 $292,000 $634,118
27 25 $300,000 $684,848
9
B C D E F G
2 Present Value = $100,000 Year Simple Compound
3 Interest Rate = 8% 1 $108,000 $108,000
4 2 $116,000 $116,640
5 3 $124,000 $125,971
6 4 $132,000 $136,049
7 5 $140,000 $146,933
8 6 $148,000 $158,687
9 7 $156,000 $171,382
10 8 $164,000 $185,093
11 9 $172,000 $199,900
12 10 $180,000 $215,892
13 11 $188,000 $233,164
14 12 $196,000 $251,817
15 13 $204,000 $271,962
16 14 $212,000 $293,719
17 15 $220,000 $317,217
18 16 $228,000 $342,594
19 17 $236,000 $370,002
20 18 $244,000 $399,602
21 19 $252,000 $431,570
22 20 $260,000 $466,096
23 21 $268,000 $503,383
24 22 $276,000 $543,654
25 23 $284,000 $587,146
26 24 $292,000 $634,118
27 25 $300,000 $684,848
The difference between them is almost $400,000.
The difference between them is exactly $384,848.
Question 1
$0
$100,000
$200,000
$300,000
$400,000
$500,000
$600,000
$700,000
$800,000
0 5 10 15 20 25
Years
Future
Value
10
$0
$200,000
$400,000
$600,000
$800,000
$1,000,000
$1,200,000
$1,400,000
$1,600,000
$1,800,000
0 5 10 15 20 25
Years
Future
Value
Question 2
What is the difference in results between savings accounts that use simple and
compound interest when you invest $100,000 at 12% for 25 years?
Note the change of
scale on the y-axis
B C D E F G
2 Present Value = 100000 Year Simple Compound
3 Interest Rate = 12% 1 $112,000 $112,000
4 2 $124,000 $125,440
5 3 $136,000 $140,493
6 4 $148,000 $157,352
7 5 $160,000 $176,234
8 6 $172,000 $197,382
9 7 $184,000 $221,068
10 8 $196,000 $247,596
11 9 $208,000 $277,308
12 10 $220,000 $310,585
13 11 $232,000 $347,855
14 12 $244,000 $389,598
15 13 $256,000 $436,349
16 14 $268,000 $488,711
17 15 $280,000 $547,357
18 16 $292,000 $613,039
19 17 $304,000 $686,604
20 18 $316,000 $768,997
21 19 $328,000 $861,276
22 20 $340,000 $964,629
23 21 $352,000 $1,080,385
24 22 $364,000 $1,210,031
25 23 $376,000 $1,355,235
26 24 $388,000 $1,517,863
27 25 $400,000 $1,700,006
11
$0
$50,000
$100,000
$150,000
$200,000
$250,000
0 5 10 15 20 25
Years
Future
Value
Question 3
What is the difference in results between savings accounts that use simple and
compound interest when you invest $100,000 at 3% for 25 years?
Note the change of
scale on the y-axis
B C D E F G
2 Present Value = 100000 Year Simple Compound
3 Interest Rate = 3% 1 $103,000 $103,000
4 2 $106,000 $106,090
5 3 $109,000 $109,273
6 4 $112,000 $112,551
7 5 $115,000 $115,927
8 6 $118,000 $119,405
9 7 $121,000 $122,987
10 8 $124,000 $126,677
11 9 $127,000 $130,477
12 10 $130,000 $134,392
13 11 $133,000 $138,423
14 12 $136,000 $142,576
15 13 $139,000 $146,853
16 14 $142,000 $151,259
17 15 $145,000 $155,797
18 16 $148,000 $160,471
19 17 $151,000 $165,285
20 18 $154,000 $170,243
21 19 $157,000 $175,351
22 20 $160,000 $180,611
23 21 $163,000 $186,029
24 22 $166,000 $191,610
25 23 $169,000 $197,359
26 24 $172,000 $203,279
27 25 $175,000 $209,378
12
$0
$2,000,000
$4,000,000
$6,000,000
$8,000,000
$10,000,000
$12,000,000
0 5 10 15 20 25
Years
Future
Value
Question 4
What is the difference in results between savings accounts that use simple and
compound interest when you invest $100,000 at 20% for 25 years?
Note the change of
scale on the y-axis
B C D E F G
2 Present Value = 100000 Year Simple Compound
3 Interest Rate = 20% 1 $120,000 $120,000
4 2 $140,000 $144,000
5 3 $160,000 $172,800
6 4 $180,000 $207,360
7 5 $200,000 $248,832
8 6 $220,000 $298,598
9 7 $240,000 $358,318
10 8 $260,000 $429,982
11 9 $280,000 $515,978
12 10 $300,000 $619,174
13 11 $320,000 $743,008
14 12 $340,000 $891,610
15 13 $360,000 $1,069,932
16 14 $380,000 $1,283,918
17 15 $400,000 $1,540,702
18 16 $420,000 $1,848,843
19 17 $440,000 $2,218,611
20 18 $460,000 $2,662,333
21 19 $480,000 $3,194,800
22 20 $500,000 $3,833,760
23 21 $520,000 $4,600,512
24 22 $540,000 $5,520,614
25 23 $560,000 $6,624,737
26 24 $580,000 $7,949,685
27 25 $600,000 $9,539,622
$0
$2,000,000
$4,000,000
$6,000,000
$8,000,000
$10,000,000
$12,000,000
0 5 10 15 20 25
13
Assignment: Part 1
1. Expand the number of years on your spreadsheet to 50 and redo the graph to
include the new values. Does the compound interest graph for an interest rate of
3% still look linear? (Refer to Slide 11 for comparison.)
2. How long does it take for $10,000 to double at 5% using simple interest?
3. How long does it take for $10,000 to double at 5% using compound interest?
(round answer to nearest year)
4. Redo questions #2 and #3 using interest rates of 10%, 15%, and 20%?
14
Investing in the Stock Market: Plotting the Dow Jones Industrial
Index
Now let's consider one portion of the Dow
Jones index, from 1980 to 2000,
where dramatic growth occurred. We
show that we can model this curve
using an exponential function.
The following are the DJIA closing values
on the last trading day of the years
indicated:
Plot this data as before: observe that it
produces a similar curve to our
exponential growth curve that we met
before. You are to add a trend line to
this data and in the process, find a
model. If you right-click on the graph
(not the background) you will see the
option "Add Trendline...".
Year DJIA
1980 963
1985 1546
1990 2633
1995 5117
2000 10787
15
• In "Options" check "Display equation on chart" (this is the model, or equation,
that we want).
• You should get the chart as above, showing the exponential graph and the
model:
• That model function gives DJIA as a function of the year and is explained as
follows: 2E-101 means 2 × 10 to the power -101 (This is a very small number
indeed.) Recall "E" here means base 10 and e0.1206x is the exponential
function with base e.
• You can now use the model to make a prediction for any year. You can use the
“Forecast” dialog under the "Options“ menu to extend the graph to year 2020.
• Finally, in the same dialog, you should display the R-squared value, which
indicates the goodness of fit.
16
•
5. Predict what will happen, given the same growth rate, out to year
2020. How much will the Dow Jones Index Stock be worth in your
prediction?
6. Now you will add a data point, and change the model. Add the
closing value of the Dow at the end of 2005 (10,717). Describe the
change in the model function, the R-squared value and the 2020
prediction.
7. Now add another data point, the value of the Dow today (about
13,583): Describe what happens to the model function and the R-
squared value and the 2020 predication.
8. Now investigate what happens to the model if the market dives in
2008 back to 10,000. What impact will it have on your 2020
predictions? Now use a linear model, what impact does it have on 2020
predictions?
9. Turn in your worksheet on Bb.
Assignment: Part 2

More Related Content

Similar to CS110-Lab8.ppt

CFA LEVEL 1- Time Value of Money_compressed (1).pdf
CFA LEVEL 1- Time Value of Money_compressed (1).pdfCFA LEVEL 1- Time Value of Money_compressed (1).pdf
CFA LEVEL 1- Time Value of Money_compressed (1).pdfAlison Tutors
 
Full Market April Market Watch 2022
Full Market April Market Watch 2022Full Market April Market Watch 2022
Full Market April Market Watch 2022Michelle Makos
 
Assignment' answers v2
Assignment' answers v2Assignment' answers v2
Assignment' answers v2Rene Rondon
 
A financial GPS to find the quickest route to ZERO debt, Presented by Serena ...
A financial GPS to find the quickest route to ZERO debt, Presented by Serena ...A financial GPS to find the quickest route to ZERO debt, Presented by Serena ...
A financial GPS to find the quickest route to ZERO debt, Presented by Serena ...Serena Rinaldi Lambiase
 
Everyday math ppt
Everyday math pptEveryday math ppt
Everyday math pptjbpotts
 
Time value of money
Time value of moneyTime value of money
Time value of moneyISYousafzai
 
June Market Report 2014
June Market Report 2014June Market Report 2014
June Market Report 2014Michelle Makos
 
Market Report for August 2017 - Residential Resale
Market Report for August 2017 - Residential ResaleMarket Report for August 2017 - Residential Resale
Market Report for August 2017 - Residential ResaleMichelle Makos
 
TREB January 2017 Market Watch
TREB January 2017 Market WatchTREB January 2017 Market Watch
TREB January 2017 Market WatchMichelle Makos
 
Toronto Real Estate Board's MARKET WATCH - JANUARY 2017
Toronto Real Estate Board's MARKET WATCH - JANUARY 2017Toronto Real Estate Board's MARKET WATCH - JANUARY 2017
Toronto Real Estate Board's MARKET WATCH - JANUARY 2017Shawn Venasse
 
Toronto Real Estate Board's MARKET WATCH - JANUARY 2017
Toronto Real Estate Board's MARKET WATCH - JANUARY 2017Toronto Real Estate Board's MARKET WATCH - JANUARY 2017
Toronto Real Estate Board's MARKET WATCH - JANUARY 2017Shawn Venasse
 
Payoff Your Mortgage Early
Payoff Your Mortgage EarlyPayoff Your Mortgage Early
Payoff Your Mortgage Earlysuzannekwong
 
September 2021 Market Watch Report
September 2021 Market Watch ReportSeptember 2021 Market Watch Report
September 2021 Market Watch ReportMichelle Makos
 
TREB MARKET WATCH 2017
TREB MARKET WATCH 2017TREB MARKET WATCH 2017
TREB MARKET WATCH 2017Michelle Makos
 

Similar to CS110-Lab8.ppt (20)

EIA2016 Turin - Rick Rasmussen. P&L Statements
EIA2016 Turin - Rick Rasmussen. P&L StatementsEIA2016 Turin - Rick Rasmussen. P&L Statements
EIA2016 Turin - Rick Rasmussen. P&L Statements
 
CFA LEVEL 1- Time Value of Money_compressed (1).pdf
CFA LEVEL 1- Time Value of Money_compressed (1).pdfCFA LEVEL 1- Time Value of Money_compressed (1).pdf
CFA LEVEL 1- Time Value of Money_compressed (1).pdf
 
Full Market April Market Watch 2022
Full Market April Market Watch 2022Full Market April Market Watch 2022
Full Market April Market Watch 2022
 
Time value slide
Time value slideTime value slide
Time value slide
 
Assignment' answers v2
Assignment' answers v2Assignment' answers v2
Assignment' answers v2
 
KMT Sample 7.16
KMT Sample 7.16KMT Sample 7.16
KMT Sample 7.16
 
A financial GPS to find the quickest route to ZERO debt, Presented by Serena ...
A financial GPS to find the quickest route to ZERO debt, Presented by Serena ...A financial GPS to find the quickest route to ZERO debt, Presented by Serena ...
A financial GPS to find the quickest route to ZERO debt, Presented by Serena ...
 
Everyday math ppt
Everyday math pptEveryday math ppt
Everyday math ppt
 
Time value of money
Time value of moneyTime value of money
Time value of money
 
June Market Report 2014
June Market Report 2014June Market Report 2014
June Market Report 2014
 
Market Report for August 2017 - Residential Resale
Market Report for August 2017 - Residential ResaleMarket Report for August 2017 - Residential Resale
Market Report for August 2017 - Residential Resale
 
ch03.ppt
ch03.pptch03.ppt
ch03.ppt
 
chapter 03
chapter 03chapter 03
chapter 03
 
Timevalueofmoney
TimevalueofmoneyTimevalueofmoney
Timevalueofmoney
 
TREB January 2017 Market Watch
TREB January 2017 Market WatchTREB January 2017 Market Watch
TREB January 2017 Market Watch
 
Toronto Real Estate Board's MARKET WATCH - JANUARY 2017
Toronto Real Estate Board's MARKET WATCH - JANUARY 2017Toronto Real Estate Board's MARKET WATCH - JANUARY 2017
Toronto Real Estate Board's MARKET WATCH - JANUARY 2017
 
Toronto Real Estate Board's MARKET WATCH - JANUARY 2017
Toronto Real Estate Board's MARKET WATCH - JANUARY 2017Toronto Real Estate Board's MARKET WATCH - JANUARY 2017
Toronto Real Estate Board's MARKET WATCH - JANUARY 2017
 
Payoff Your Mortgage Early
Payoff Your Mortgage EarlyPayoff Your Mortgage Early
Payoff Your Mortgage Early
 
September 2021 Market Watch Report
September 2021 Market Watch ReportSeptember 2021 Market Watch Report
September 2021 Market Watch Report
 
TREB MARKET WATCH 2017
TREB MARKET WATCH 2017TREB MARKET WATCH 2017
TREB MARKET WATCH 2017
 

More from VnDr

3_3_Notes.ppt
3_3_Notes.ppt3_3_Notes.ppt
3_3_Notes.pptVnDr
 
1322606945 (1).pptx
1322606945 (1).pptx1322606945 (1).pptx
1322606945 (1).pptxVnDr
 
Trade Discountq.pptx
Trade Discountq.pptxTrade Discountq.pptx
Trade Discountq.pptxVnDr
 
MEASURES OF DISPERSION.ppt
MEASURES OF DISPERSION.pptMEASURES OF DISPERSION.ppt
MEASURES OF DISPERSION.pptVnDr
 
Mindfulness_Laura_Chabot.ppt
Mindfulness_Laura_Chabot.pptMindfulness_Laura_Chabot.ppt
Mindfulness_Laura_Chabot.pptVnDr
 
Geometric Sequence and Series.pdf
Geometric Sequence and Series.pdfGeometric Sequence and Series.pdf
Geometric Sequence and Series.pdfVnDr
 

More from VnDr (6)

3_3_Notes.ppt
3_3_Notes.ppt3_3_Notes.ppt
3_3_Notes.ppt
 
1322606945 (1).pptx
1322606945 (1).pptx1322606945 (1).pptx
1322606945 (1).pptx
 
Trade Discountq.pptx
Trade Discountq.pptxTrade Discountq.pptx
Trade Discountq.pptx
 
MEASURES OF DISPERSION.ppt
MEASURES OF DISPERSION.pptMEASURES OF DISPERSION.ppt
MEASURES OF DISPERSION.ppt
 
Mindfulness_Laura_Chabot.ppt
Mindfulness_Laura_Chabot.pptMindfulness_Laura_Chabot.ppt
Mindfulness_Laura_Chabot.ppt
 
Geometric Sequence and Series.pdf
Geometric Sequence and Series.pdfGeometric Sequence and Series.pdf
Geometric Sequence and Series.pdf
 

Recently uploaded

SBP-Market-Operations and market managment
SBP-Market-Operations and market managmentSBP-Market-Operations and market managment
SBP-Market-Operations and market managmentfactical
 
Q3 2024 Earnings Conference Call and Webcast Slides
Q3 2024 Earnings Conference Call and Webcast SlidesQ3 2024 Earnings Conference Call and Webcast Slides
Q3 2024 Earnings Conference Call and Webcast SlidesMarketing847413
 
Independent Lucknow Call Girls 8923113531WhatsApp Lucknow Call Girls make you...
Independent Lucknow Call Girls 8923113531WhatsApp Lucknow Call Girls make you...Independent Lucknow Call Girls 8923113531WhatsApp Lucknow Call Girls make you...
Independent Lucknow Call Girls 8923113531WhatsApp Lucknow Call Girls make you...makika9823
 
Financial institutions facilitate financing, economic transactions, issue fun...
Financial institutions facilitate financing, economic transactions, issue fun...Financial institutions facilitate financing, economic transactions, issue fun...
Financial institutions facilitate financing, economic transactions, issue fun...Avanish Goel
 
letter-from-the-chair-to-the-fca-relating-to-british-steel-pensions-scheme-15...
letter-from-the-chair-to-the-fca-relating-to-british-steel-pensions-scheme-15...letter-from-the-chair-to-the-fca-relating-to-british-steel-pensions-scheme-15...
letter-from-the-chair-to-the-fca-relating-to-british-steel-pensions-scheme-15...Henry Tapper
 
VIP High Class Call Girls Saharanpur Anushka 8250192130 Independent Escort Se...
VIP High Class Call Girls Saharanpur Anushka 8250192130 Independent Escort Se...VIP High Class Call Girls Saharanpur Anushka 8250192130 Independent Escort Se...
VIP High Class Call Girls Saharanpur Anushka 8250192130 Independent Escort Se...Suhani Kapoor
 
Vip B Aizawl Call Girls #9907093804 Contact Number Escorts Service Aizawl
Vip B Aizawl Call Girls #9907093804 Contact Number Escorts Service AizawlVip B Aizawl Call Girls #9907093804 Contact Number Escorts Service Aizawl
Vip B Aizawl Call Girls #9907093804 Contact Number Escorts Service Aizawlmakika9823
 
call girls in Nand Nagri (DELHI) 🔝 >༒9953330565🔝 genuine Escort Service 🔝✔️✔️
call girls in  Nand Nagri (DELHI) 🔝 >༒9953330565🔝 genuine Escort Service 🔝✔️✔️call girls in  Nand Nagri (DELHI) 🔝 >༒9953330565🔝 genuine Escort Service 🔝✔️✔️
call girls in Nand Nagri (DELHI) 🔝 >༒9953330565🔝 genuine Escort Service 🔝✔️✔️9953056974 Low Rate Call Girls In Saket, Delhi NCR
 
VIP Call Girls Service Begumpet Hyderabad Call +91-8250192130
VIP Call Girls Service Begumpet Hyderabad Call +91-8250192130VIP Call Girls Service Begumpet Hyderabad Call +91-8250192130
VIP Call Girls Service Begumpet Hyderabad Call +91-8250192130Suhani Kapoor
 
Monthly Market Risk Update: April 2024 [SlideShare]
Monthly Market Risk Update: April 2024 [SlideShare]Monthly Market Risk Update: April 2024 [SlideShare]
Monthly Market Risk Update: April 2024 [SlideShare]Commonwealth
 
Stock Market Brief Deck for 4/24/24 .pdf
Stock Market Brief Deck for 4/24/24 .pdfStock Market Brief Deck for 4/24/24 .pdf
Stock Market Brief Deck for 4/24/24 .pdfMichael Silva
 
Call Girls In Yusuf Sarai Women Seeking Men 9654467111
Call Girls In Yusuf Sarai Women Seeking Men 9654467111Call Girls In Yusuf Sarai Women Seeking Men 9654467111
Call Girls In Yusuf Sarai Women Seeking Men 9654467111Sapana Sha
 
fca-bsps-decision-letter-redacted (1).pdf
fca-bsps-decision-letter-redacted (1).pdffca-bsps-decision-letter-redacted (1).pdf
fca-bsps-decision-letter-redacted (1).pdfHenry Tapper
 
(办理原版一样)QUT毕业证昆士兰科技大学毕业证学位证留信学历认证成绩单补办
(办理原版一样)QUT毕业证昆士兰科技大学毕业证学位证留信学历认证成绩单补办(办理原版一样)QUT毕业证昆士兰科技大学毕业证学位证留信学历认证成绩单补办
(办理原版一样)QUT毕业证昆士兰科技大学毕业证学位证留信学历认证成绩单补办fqiuho152
 
20240417-Calibre-April-2024-Investor-Presentation.pdf
20240417-Calibre-April-2024-Investor-Presentation.pdf20240417-Calibre-April-2024-Investor-Presentation.pdf
20240417-Calibre-April-2024-Investor-Presentation.pdfAdnet Communications
 
(办理学位证)加拿大萨省大学毕业证成绩单原版一比一
(办理学位证)加拿大萨省大学毕业证成绩单原版一比一(办理学位证)加拿大萨省大学毕业证成绩单原版一比一
(办理学位证)加拿大萨省大学毕业证成绩单原版一比一S SDS
 
OAT_RI_Ep19 WeighingTheRisks_Apr24_TheYellowMetal.pptx
OAT_RI_Ep19 WeighingTheRisks_Apr24_TheYellowMetal.pptxOAT_RI_Ep19 WeighingTheRisks_Apr24_TheYellowMetal.pptx
OAT_RI_Ep19 WeighingTheRisks_Apr24_TheYellowMetal.pptxhiddenlevers
 
Quantitative Analysis of Retail Sector Companies
Quantitative Analysis of Retail Sector CompaniesQuantitative Analysis of Retail Sector Companies
Quantitative Analysis of Retail Sector Companiesprashantbhati354
 

Recently uploaded (20)

SBP-Market-Operations and market managment
SBP-Market-Operations and market managmentSBP-Market-Operations and market managment
SBP-Market-Operations and market managment
 
Q3 2024 Earnings Conference Call and Webcast Slides
Q3 2024 Earnings Conference Call and Webcast SlidesQ3 2024 Earnings Conference Call and Webcast Slides
Q3 2024 Earnings Conference Call and Webcast Slides
 
🔝+919953056974 🔝young Delhi Escort service Pusa Road
🔝+919953056974 🔝young Delhi Escort service Pusa Road🔝+919953056974 🔝young Delhi Escort service Pusa Road
🔝+919953056974 🔝young Delhi Escort service Pusa Road
 
Monthly Economic Monitoring of Ukraine No 231, April 2024
Monthly Economic Monitoring of Ukraine No 231, April 2024Monthly Economic Monitoring of Ukraine No 231, April 2024
Monthly Economic Monitoring of Ukraine No 231, April 2024
 
Independent Lucknow Call Girls 8923113531WhatsApp Lucknow Call Girls make you...
Independent Lucknow Call Girls 8923113531WhatsApp Lucknow Call Girls make you...Independent Lucknow Call Girls 8923113531WhatsApp Lucknow Call Girls make you...
Independent Lucknow Call Girls 8923113531WhatsApp Lucknow Call Girls make you...
 
Financial institutions facilitate financing, economic transactions, issue fun...
Financial institutions facilitate financing, economic transactions, issue fun...Financial institutions facilitate financing, economic transactions, issue fun...
Financial institutions facilitate financing, economic transactions, issue fun...
 
letter-from-the-chair-to-the-fca-relating-to-british-steel-pensions-scheme-15...
letter-from-the-chair-to-the-fca-relating-to-british-steel-pensions-scheme-15...letter-from-the-chair-to-the-fca-relating-to-british-steel-pensions-scheme-15...
letter-from-the-chair-to-the-fca-relating-to-british-steel-pensions-scheme-15...
 
VIP High Class Call Girls Saharanpur Anushka 8250192130 Independent Escort Se...
VIP High Class Call Girls Saharanpur Anushka 8250192130 Independent Escort Se...VIP High Class Call Girls Saharanpur Anushka 8250192130 Independent Escort Se...
VIP High Class Call Girls Saharanpur Anushka 8250192130 Independent Escort Se...
 
Vip B Aizawl Call Girls #9907093804 Contact Number Escorts Service Aizawl
Vip B Aizawl Call Girls #9907093804 Contact Number Escorts Service AizawlVip B Aizawl Call Girls #9907093804 Contact Number Escorts Service Aizawl
Vip B Aizawl Call Girls #9907093804 Contact Number Escorts Service Aizawl
 
call girls in Nand Nagri (DELHI) 🔝 >༒9953330565🔝 genuine Escort Service 🔝✔️✔️
call girls in  Nand Nagri (DELHI) 🔝 >༒9953330565🔝 genuine Escort Service 🔝✔️✔️call girls in  Nand Nagri (DELHI) 🔝 >༒9953330565🔝 genuine Escort Service 🔝✔️✔️
call girls in Nand Nagri (DELHI) 🔝 >༒9953330565🔝 genuine Escort Service 🔝✔️✔️
 
VIP Call Girls Service Begumpet Hyderabad Call +91-8250192130
VIP Call Girls Service Begumpet Hyderabad Call +91-8250192130VIP Call Girls Service Begumpet Hyderabad Call +91-8250192130
VIP Call Girls Service Begumpet Hyderabad Call +91-8250192130
 
Monthly Market Risk Update: April 2024 [SlideShare]
Monthly Market Risk Update: April 2024 [SlideShare]Monthly Market Risk Update: April 2024 [SlideShare]
Monthly Market Risk Update: April 2024 [SlideShare]
 
Stock Market Brief Deck for 4/24/24 .pdf
Stock Market Brief Deck for 4/24/24 .pdfStock Market Brief Deck for 4/24/24 .pdf
Stock Market Brief Deck for 4/24/24 .pdf
 
Call Girls In Yusuf Sarai Women Seeking Men 9654467111
Call Girls In Yusuf Sarai Women Seeking Men 9654467111Call Girls In Yusuf Sarai Women Seeking Men 9654467111
Call Girls In Yusuf Sarai Women Seeking Men 9654467111
 
fca-bsps-decision-letter-redacted (1).pdf
fca-bsps-decision-letter-redacted (1).pdffca-bsps-decision-letter-redacted (1).pdf
fca-bsps-decision-letter-redacted (1).pdf
 
(办理原版一样)QUT毕业证昆士兰科技大学毕业证学位证留信学历认证成绩单补办
(办理原版一样)QUT毕业证昆士兰科技大学毕业证学位证留信学历认证成绩单补办(办理原版一样)QUT毕业证昆士兰科技大学毕业证学位证留信学历认证成绩单补办
(办理原版一样)QUT毕业证昆士兰科技大学毕业证学位证留信学历认证成绩单补办
 
20240417-Calibre-April-2024-Investor-Presentation.pdf
20240417-Calibre-April-2024-Investor-Presentation.pdf20240417-Calibre-April-2024-Investor-Presentation.pdf
20240417-Calibre-April-2024-Investor-Presentation.pdf
 
(办理学位证)加拿大萨省大学毕业证成绩单原版一比一
(办理学位证)加拿大萨省大学毕业证成绩单原版一比一(办理学位证)加拿大萨省大学毕业证成绩单原版一比一
(办理学位证)加拿大萨省大学毕业证成绩单原版一比一
 
OAT_RI_Ep19 WeighingTheRisks_Apr24_TheYellowMetal.pptx
OAT_RI_Ep19 WeighingTheRisks_Apr24_TheYellowMetal.pptxOAT_RI_Ep19 WeighingTheRisks_Apr24_TheYellowMetal.pptx
OAT_RI_Ep19 WeighingTheRisks_Apr24_TheYellowMetal.pptx
 
Quantitative Analysis of Retail Sector Companies
Quantitative Analysis of Retail Sector CompaniesQuantitative Analysis of Retail Sector Companies
Quantitative Analysis of Retail Sector Companies
 

CS110-Lab8.ppt

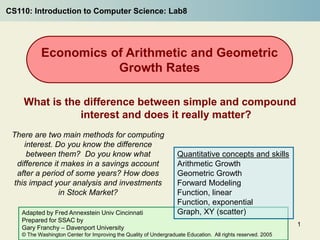
  • 1. 1 There are two main methods for computing interest. Do you know the difference between them? Do you know what difference it makes in a savings account after a period of some years? How does this impact your analysis and investments in Stock Market? What is the difference between simple and compound interest and does it really matter? Economics of Arithmetic and Geometric Growth Rates CS110: Introduction to Computer Science: Lab8 Adapted by Fred Annexstein Univ Cincinnati Prepared for SSAC by Gary Franchy – Davenport University © The Washington Center for Improving the Quality of Undergraduate Education. All rights reserved. 2005 Quantitative concepts and skills Arithmetic Growth Geometric Growth Forward Modeling Function, linear Function, exponential Graph, XY (scatter)
  • 2. 2 Simple interest is an example of arithmetic growth where the amount of interest generated each term is constant; it is based on only the starting amount. Year to year there is a constant difference in the value of the savings account, and so the successive values track a linear function. Compound interest is an example of geometric growth where the amount of interest generated each term increases because it is based on both the starting amount and the previously earned interest. Year to year there is a constant ratio of the values in the savings account, and so the successive values track an exponential function. Accordingly, compound interest is commonly said to exhibit exponential growth, Overview of Module Slides 3-4 ask you to set up your worksheet and format the cells. Slides 5-9 have you computing simple and compound interest for a set period of time and interest rate. You will perform the calculation, graph the increasing savings accounts, and draw trendlines through the plotted functions for the linearly increasing and geometrically increasing values. Slides 10-12 ask you to calculate the difference between the two types of accounts using a variety of interest rates. Slides 13 has parts of assignment to hand in. Slides 14-16 asks to consider the stock market and has remainder of assignment to hand in.
  • 3. 3 What is the difference in results between savings accounts that use simple and compound interest when you invest $100,000 at 8% for 25 years? Recreate this spreadsheet = Cell with a number in it = Cell with a formula in it B C D E F G 2 Present Value = 100000 Year Simple Compound 3 Interest Rate = 8% 1 4 2 5 3 6 4 7 5 8 6 9 7 10 8 11 9 12 10 13 11 14 12 15 13 16 14 17 15 18 16 19 17 20 18 21 19 22 20 23 21 24 22 25 23 26 24 27 25 One way to answer the question with a spreadsheet is to lay it out year by year. Type in the “%” symbol when entering percents; otherwise you must enter the decimal form. Question 1
  • 4. 4 B C D E F G 2 Present Value = $100,000 Year Simple Compound 3 Interest Rate = 8% 1 4 2 5 3 6 4 7 5 8 6 9 7 10 8 11 9 12 10 13 11 14 12 15 13 16 14 17 15 18 16 19 17 20 18 21 19 22 20 23 21 24 22 25 23 26 24 27 25 To format cells: 1. Select the cells. 2. Right-click the mouse. 3. Select “Format Cells”. 4. Choose “Number” tab. 5. Choose “Currency”. 6. Adjust “Decimal Places” to the desired number of places. 7. Select “OK”. Question 1 Format these cells as currency rounded to the nearest dollar.
  • 5. 5 B C D E F G 2 Present Value = $100,000 Year Simple Compound 3 Interest Rate = 8% 1 4 2 5 3 6 4 7 5 8 6 9 7 10 8 11 9 12 10 13 11 14 12 15 13 16 14 17 15 18 16 19 17 20 18 21 19 22 20 23 21 24 22 25 23 26 24 27 25 Compute the results for future value for each year in the column labeled “Simple”. The Simple Interest Formula: Where FV = Future Value ($) PV = Present Value ($) r = Interest Rate t = Time (Years)   rt PV FV   1 Question 1
  • 6. 6 B C D E F G 2 Present Value = $100,000 Year Simple Compound 3 Interest Rate = 8% 1 $108,000 4 2 $116,000 5 3 $124,000 6 4 $132,000 7 5 $140,000 8 6 $148,000 9 7 $156,000 10 8 $164,000 11 9 $172,000 12 10 $180,000 13 11 $188,000 14 12 $196,000 15 13 $204,000 16 14 $212,000 17 15 $220,000 18 16 $228,000 19 17 $236,000 20 18 $244,000 21 19 $252,000 22 20 $260,000 23 21 $268,000 24 22 $276,000 25 23 $284,000 26 24 $292,000 27 25 $300,000 Compute the results for future value for each year in the column labeled “Compound”. The Compound Interest Formula: Where FV = Future Value ($) PV = Present Value ($) r = Interest Rate t = Time (Years)  t r PV FV   1 Question 1
  • 7. 7 Now create a single scatter graph where future value is on the y-axis and time is on the x-axis. Plot the values for both accounts on the same graph. To draw a graph, you may either click on the chart wizard button or use “Insert  Chart” from the menu. Question 1 B C D E F G 2 Present Value = $100,000 Year Simple Compound 3 Interest Rate = 8% 1 $108,000 $108,000 4 2 $116,000 $116,640 5 3 $124,000 $125,971 6 4 $132,000 $136,049 7 5 $140,000 $146,933 8 6 $148,000 $158,687 9 7 $156,000 $171,382 10 8 $164,000 $185,093 11 9 $172,000 $199,900 12 10 $180,000 $215,892 13 11 $188,000 $233,164 14 12 $196,000 $251,817 15 13 $204,000 $271,962 16 14 $212,000 $293,719 17 15 $220,000 $317,217 18 16 $228,000 $342,594 19 17 $236,000 $370,002 20 18 $244,000 $399,602 21 19 $252,000 $431,570 22 20 $260,000 $466,096 23 21 $268,000 $503,383 24 22 $276,000 $543,654 25 23 $284,000 $587,146 26 24 $292,000 $634,118 27 25 $300,000 $684,848
  • 8. 8 $0 $100,000 $200,000 $300,000 $400,000 $500,000 $600,000 $700,000 $800,000 0 5 10 15 20 25 Years Future Value Add trendlines to each graph. To add a trendline: 1. Place mouse over any data point of the desired function. 2. Right-click the mouse. 3. Select “Add Trendline”. 4. Choose the function that resembles the pattern Question 1 B C D E F G 2 Present Value = $100,000 Year Simple Compound 3 Interest Rate = 8% 1 $108,000 $108,000 4 2 $116,000 $116,640 5 3 $124,000 $125,971 6 4 $132,000 $136,049 7 5 $140,000 $146,933 8 6 $148,000 $158,687 9 7 $156,000 $171,382 10 8 $164,000 $185,093 11 9 $172,000 $199,900 12 10 $180,000 $215,892 13 11 $188,000 $233,164 14 12 $196,000 $251,817 15 13 $204,000 $271,962 16 14 $212,000 $293,719 17 15 $220,000 $317,217 18 16 $228,000 $342,594 19 17 $236,000 $370,002 20 18 $244,000 $399,602 21 19 $252,000 $431,570 22 20 $260,000 $466,096 23 21 $268,000 $503,383 24 22 $276,000 $543,654 25 23 $284,000 $587,146 26 24 $292,000 $634,118 27 25 $300,000 $684,848
  • 9. 9 B C D E F G 2 Present Value = $100,000 Year Simple Compound 3 Interest Rate = 8% 1 $108,000 $108,000 4 2 $116,000 $116,640 5 3 $124,000 $125,971 6 4 $132,000 $136,049 7 5 $140,000 $146,933 8 6 $148,000 $158,687 9 7 $156,000 $171,382 10 8 $164,000 $185,093 11 9 $172,000 $199,900 12 10 $180,000 $215,892 13 11 $188,000 $233,164 14 12 $196,000 $251,817 15 13 $204,000 $271,962 16 14 $212,000 $293,719 17 15 $220,000 $317,217 18 16 $228,000 $342,594 19 17 $236,000 $370,002 20 18 $244,000 $399,602 21 19 $252,000 $431,570 22 20 $260,000 $466,096 23 21 $268,000 $503,383 24 22 $276,000 $543,654 25 23 $284,000 $587,146 26 24 $292,000 $634,118 27 25 $300,000 $684,848 The difference between them is almost $400,000. The difference between them is exactly $384,848. Question 1 $0 $100,000 $200,000 $300,000 $400,000 $500,000 $600,000 $700,000 $800,000 0 5 10 15 20 25 Years Future Value
  • 10. 10 $0 $200,000 $400,000 $600,000 $800,000 $1,000,000 $1,200,000 $1,400,000 $1,600,000 $1,800,000 0 5 10 15 20 25 Years Future Value Question 2 What is the difference in results between savings accounts that use simple and compound interest when you invest $100,000 at 12% for 25 years? Note the change of scale on the y-axis B C D E F G 2 Present Value = 100000 Year Simple Compound 3 Interest Rate = 12% 1 $112,000 $112,000 4 2 $124,000 $125,440 5 3 $136,000 $140,493 6 4 $148,000 $157,352 7 5 $160,000 $176,234 8 6 $172,000 $197,382 9 7 $184,000 $221,068 10 8 $196,000 $247,596 11 9 $208,000 $277,308 12 10 $220,000 $310,585 13 11 $232,000 $347,855 14 12 $244,000 $389,598 15 13 $256,000 $436,349 16 14 $268,000 $488,711 17 15 $280,000 $547,357 18 16 $292,000 $613,039 19 17 $304,000 $686,604 20 18 $316,000 $768,997 21 19 $328,000 $861,276 22 20 $340,000 $964,629 23 21 $352,000 $1,080,385 24 22 $364,000 $1,210,031 25 23 $376,000 $1,355,235 26 24 $388,000 $1,517,863 27 25 $400,000 $1,700,006
  • 11. 11 $0 $50,000 $100,000 $150,000 $200,000 $250,000 0 5 10 15 20 25 Years Future Value Question 3 What is the difference in results between savings accounts that use simple and compound interest when you invest $100,000 at 3% for 25 years? Note the change of scale on the y-axis B C D E F G 2 Present Value = 100000 Year Simple Compound 3 Interest Rate = 3% 1 $103,000 $103,000 4 2 $106,000 $106,090 5 3 $109,000 $109,273 6 4 $112,000 $112,551 7 5 $115,000 $115,927 8 6 $118,000 $119,405 9 7 $121,000 $122,987 10 8 $124,000 $126,677 11 9 $127,000 $130,477 12 10 $130,000 $134,392 13 11 $133,000 $138,423 14 12 $136,000 $142,576 15 13 $139,000 $146,853 16 14 $142,000 $151,259 17 15 $145,000 $155,797 18 16 $148,000 $160,471 19 17 $151,000 $165,285 20 18 $154,000 $170,243 21 19 $157,000 $175,351 22 20 $160,000 $180,611 23 21 $163,000 $186,029 24 22 $166,000 $191,610 25 23 $169,000 $197,359 26 24 $172,000 $203,279 27 25 $175,000 $209,378
  • 12. 12 $0 $2,000,000 $4,000,000 $6,000,000 $8,000,000 $10,000,000 $12,000,000 0 5 10 15 20 25 Years Future Value Question 4 What is the difference in results between savings accounts that use simple and compound interest when you invest $100,000 at 20% for 25 years? Note the change of scale on the y-axis B C D E F G 2 Present Value = 100000 Year Simple Compound 3 Interest Rate = 20% 1 $120,000 $120,000 4 2 $140,000 $144,000 5 3 $160,000 $172,800 6 4 $180,000 $207,360 7 5 $200,000 $248,832 8 6 $220,000 $298,598 9 7 $240,000 $358,318 10 8 $260,000 $429,982 11 9 $280,000 $515,978 12 10 $300,000 $619,174 13 11 $320,000 $743,008 14 12 $340,000 $891,610 15 13 $360,000 $1,069,932 16 14 $380,000 $1,283,918 17 15 $400,000 $1,540,702 18 16 $420,000 $1,848,843 19 17 $440,000 $2,218,611 20 18 $460,000 $2,662,333 21 19 $480,000 $3,194,800 22 20 $500,000 $3,833,760 23 21 $520,000 $4,600,512 24 22 $540,000 $5,520,614 25 23 $560,000 $6,624,737 26 24 $580,000 $7,949,685 27 25 $600,000 $9,539,622 $0 $2,000,000 $4,000,000 $6,000,000 $8,000,000 $10,000,000 $12,000,000 0 5 10 15 20 25
  • 13. 13 Assignment: Part 1 1. Expand the number of years on your spreadsheet to 50 and redo the graph to include the new values. Does the compound interest graph for an interest rate of 3% still look linear? (Refer to Slide 11 for comparison.) 2. How long does it take for $10,000 to double at 5% using simple interest? 3. How long does it take for $10,000 to double at 5% using compound interest? (round answer to nearest year) 4. Redo questions #2 and #3 using interest rates of 10%, 15%, and 20%?
  • 14. 14 Investing in the Stock Market: Plotting the Dow Jones Industrial Index Now let's consider one portion of the Dow Jones index, from 1980 to 2000, where dramatic growth occurred. We show that we can model this curve using an exponential function. The following are the DJIA closing values on the last trading day of the years indicated: Plot this data as before: observe that it produces a similar curve to our exponential growth curve that we met before. You are to add a trend line to this data and in the process, find a model. If you right-click on the graph (not the background) you will see the option "Add Trendline...". Year DJIA 1980 963 1985 1546 1990 2633 1995 5117 2000 10787
  • 15. 15 • In "Options" check "Display equation on chart" (this is the model, or equation, that we want). • You should get the chart as above, showing the exponential graph and the model: • That model function gives DJIA as a function of the year and is explained as follows: 2E-101 means 2 × 10 to the power -101 (This is a very small number indeed.) Recall "E" here means base 10 and e0.1206x is the exponential function with base e. • You can now use the model to make a prediction for any year. You can use the “Forecast” dialog under the "Options“ menu to extend the graph to year 2020. • Finally, in the same dialog, you should display the R-squared value, which indicates the goodness of fit.
  • 16. 16 • 5. Predict what will happen, given the same growth rate, out to year 2020. How much will the Dow Jones Index Stock be worth in your prediction? 6. Now you will add a data point, and change the model. Add the closing value of the Dow at the end of 2005 (10,717). Describe the change in the model function, the R-squared value and the 2020 prediction. 7. Now add another data point, the value of the Dow today (about 13,583): Describe what happens to the model function and the R- squared value and the 2020 predication. 8. Now investigate what happens to the model if the market dives in 2008 back to 10,000. What impact will it have on your 2020 predictions? Now use a linear model, what impact does it have on 2020 predictions? 9. Turn in your worksheet on Bb. Assignment: Part 2