Rankin VE Early Language and Mathematics ASA 08 2009
1. Effect of Early Language Development on First Grade Mathematics Achievement
Victoria E. Rankin, PhD.
Introduction
• Mathematics is a ‘gatekeeper’ to advanced professional
opportunities.
• Previous studies suggest that African American children
lag behind European American children in math
achievement.
• The hypothesis is that language, as the method through
which teaching and learning occurs, is also a factor in
mathematics achievement.
• This research explores effect of early language
development on early achievement in mathematics.
• Early Language Achievement is measured using the
Expressive Communication component of the Preschool
Language Scale-3 (PLS-3).
• Mathematics Achievement is measured using the
Woodcock-Johnson Applied Problems subtest.
Address Correspondence to:
Victoria E. Rankin, PhD.
vrm8g@virginia.edu
Purposes of the Study
• Examine the correlation between early language
development and early achievement in mathematics.
• Examine the effect of early language development on
first grade achievement in mathematics.
Data
NICHD-initiated longitudinal Study
of Early Child Care and Youth
Development (1989).
• 1364 children and their families at
10 locations across the U.S.
• Sample size in this study is 1273
African American and European
American children at 54 months of
age and at 1st grade (93% of
original sample).
Participants
• Gender: 52% male; 48% female.
• Race: 86% white; 14% black.
• Household Type: 83% two-parent; 17% single-parent.
• Mean Maternal Age=28.2 years; sd = 5.7.
• Mean Years of Mother’s Education=14.3 years; sd = 2.5.
• Mean Income= $37,781.
• Mean Income-to-Needs Ratio=4.0.
Procedures
• Cross-sectional regression—54
Months steps:
1. Effect of race on math
achievement.
2. Addition of PLS-3 effect.
3. Addition of gender, maternal
age, maternal education,
income-to-needs ratio, and
household type.
• Longitudinal regression—
Grade 1 steps:
Same steps as 54 months, but
controlled for students’ prior
PLS-3 achievement at Step 2,
and prior mathematics
achievement at Step 3.
Measures
Demographics: Race, gender,
mother’s age, mother’s years of
education, income-to-needs ratio,
household type.
Early Language Development:
Preschool Language Scale-3 (PLS-3),
Expressive Communication.
Outcome Measures: Mathematics
Achievement (Woodcock Johnson-
Revised Applied Problems subtest).
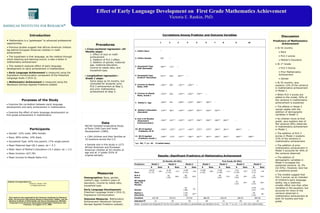
Results—Significant Predictors of Mathematics Achievement
Discussion
Predictors of Mathematics
Achievement
• At 54 months
• Race
• PLS-3 scores
• Mother’s Education
• At 1st Grade
• PLS-3 Scores
• Prior Mathematics
Achievement
• Gender
• At 54 months, race
explains 12% of the variance
in mathematics achievement
in Model 1.
• When PLS-3 scores are
added to the model, 50% of
the variance in mathematics
achievement is explained.
• The effects in Model 2
remain stable with the
addition of demographic
variables in Model 3.
• As children move to first
grade, race explains less of
the variance (8%) observed
in mathematics achievement
in Model 1.
• The addition of PLS-3
scores in Model 2 explains
31% of the variance in
mathematics achievement.
• The addition of prior
mathematics achievement in
Model 3 accounts for 40% of
the variance observed.
• The addition of
demographic variables in
Model 4 increases the
explained variance by 3%
(to 43%). However, race has
no predictive power.
• The models suggest that
PLS-3 scores, as an indicator
of children’s early language
ability, has a relatively
smaller effect size than other
variables in the equation, but
accounts for more of the
variance observed in
mathematics achievement at
both 54 months and first
grade.
This research was supported by the American Institutes for Research
(AIR), the American Educational Research Association (AERA), and the
National Institute of Child Health and Human Development (NICHD).
Presented at the American Sociological Association Conference, San
Francisco, CA August 14-17, 2009.
Correlations Among Predictor and Outcome Variables
1 2 3 4 5 6 7 8 9 10
1. Child's Race --
2. Child's Gender .007 --
3. Household Type
54M (Recoded)
.384** -.017 --
4. Household Type
Grade1F (Recoded)
.341** .028 .667** --
5. Income-to-Needs
Ratio, 54M
-.246** .055 -.267** -.209** --
6. Income-to-Needs
Ratio, Grade 1
-.255** .026 -.255** -.264** .736** --
7. Mother's Age -.266** .041 .-268** -.239** .384** .384** --
8. Mother's Education
(Recoded)
-.234** .061* -.234** -.240** .487** .526** .552** --
9. PLS-3 54 Months
(Expressive
Communication)
-.356** .167** -.229** -.187** .346** .346** .360** .460** --
10. WJ-R Applied
Problems, 54 M
-.339** .135** -.231** -.140** .275** .275** .283** .381** .696** --
11. WJ-R Applied
Problems, Grade 1
-.298** -.072* -.167** -.186** .267** .303** .266** .345** .569** .598**
*p< .05; ** p< .01 (2-tailed tests).
54 Months (N=951) First Grade (N=852)
Predictors Model 1 Model 2 Model 3 Model 1 Model 2 Model 3 Model 4
B Beta B Beta B Beta B Beta B Beta B Beta B Beta
Race
-20.05
(1.73)
-.35+
-6.20
(1.41)
-.11+
-5.48
(1.51)
-.10+
-13.86
(1.62)
-.28+
-5.40
(1.49)
-.11+
-3.51
(1.40)
-.07*
-1.91
(1.5)
-.04
PLS-3
Score
.61
(.02)
.66+
.58
(.03)
.62+
.40
(.02)
.51+
.19
(.03)
.24+
.19
(.03)
.24+
WJ Applied
Math, 54
Months
.37
(.03)
.42+
.35
(.03)
.40+
Gender
.43
(.88)
.01
-5.52
(.81)
-.18+
Mother’s
Education
1.55
(.46)
.10**
.45
(.43)
.04
Constant 447.59 370.53 373.92 486.99 436.55 300.91 309.30
Adjusted R2 .12 .50 .50 .08 .31 .40 .43
Notes: Constant and Adjusted R2 are for full models. Numbers in parentheses are standard errors. * p<.05. ** p<.01. + p<.001 (two-tailed tests).